. 2021 Oct 29;10:e64983. doi: 10.7554/eLife.64983

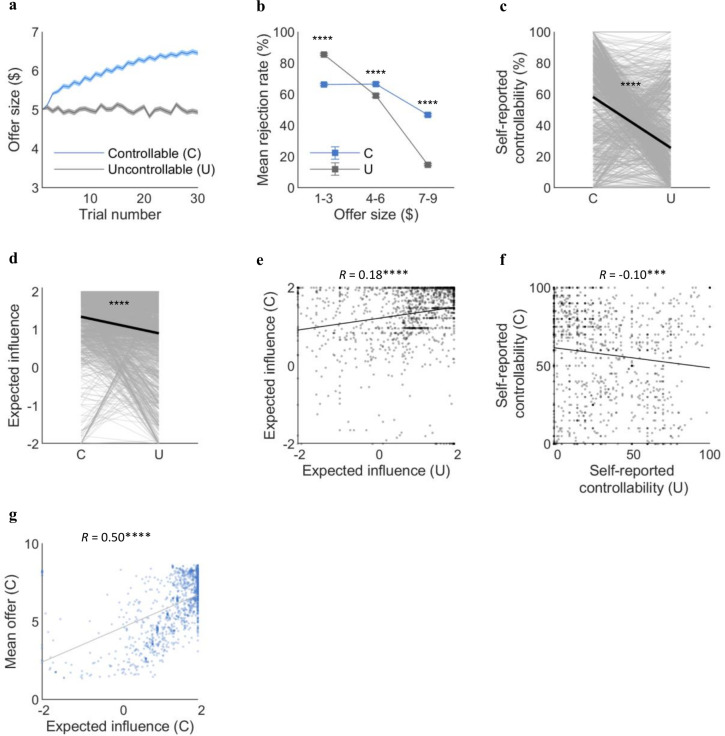
Figure 4. Replication of the behavioral and computational results in an independent large online sample (n=1342).

(a) Online participants successfully increased the offer under the Controllable condition as fMRI participants did (meanC=6.0, meanU=5.0, t(1,341)=20.29, p<<0.0001). (b) Rejection rates binned by offer sizes differed between the two conditions in the online sample (low ($1–3): meanC=66%, meanU=86%, t(741.54)=–12.28, p<<0.0001; middle ($4–6): meanC=67%, meanU=59%, t(2,606)=5.96, p<<0.0001; high ($7–9): meanC=47%, meanU=15%, t(1,925)=31.67, p<<0.0001). (c) Online participants reported higher self-reported controllability for the Controllable than Uncontrollable (meanC=58.3, meanU=25.6, t(2,579)=27.93, p<<0.0001). (d) Consistent with the fMRI sample, expected influence was higher for the Controllable than the Uncontrollable for the online sample (meanC=1.34, meanU=0.90, t(1,341)=12.97, p<<0.0001). (e) The expected influence was correlated between the two conditions (r=0.18, p<<0.0001). (f) The self-reported controllability showed negative correlation between the two conditions for the online sample (r=–0.10, p<0.001). (g) The significant correlation between expected influence and mean offers under the Controllable was replicated in the online sample (r=0.50, p<<0.0001). Each dot represents a participant. The t-statistics for the mean offer size, binned rejection rate, and self-reported controllability are from two-sample t-tests assuming unequal variance using Satterthwaite’s approximation according to the results of F-tests for equal variance. Error bars and shades represent SEM. For (c, d), each line represents a participant and each bold line represents the mean. C, controllable; U, Uncontrollable.

Figure 4.

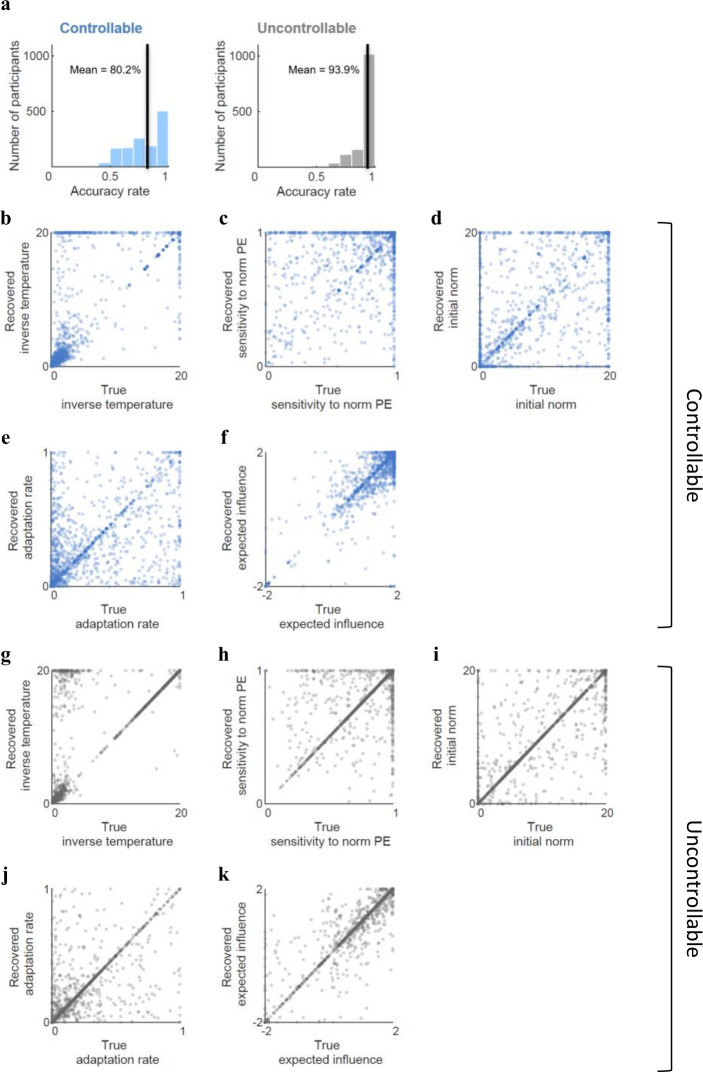
Figure 4—figure supplement 1. Model accuracy and parameter recovery for the online sample.

Figure 4—figure supplement 1.

(a) The 2-step FT model’s prediction of choices was accurate for 80.2% of the trials on average for the Controllable, and 93.9% for the Uncontrollable. Each bold black line represents mean accuracy rate. (b–k) We recovered the parameters from the 2-step FT model for the online sample in the same way as we did for the fMRI sample. Under the Controllable condition, all parameters were well identified: (b) inverse temperature (β) (r=0.79, p<10–289), (c) sensitivity to norm PE (α) (r=0.39, p<10–49), (d) initial norm (μ) (r=0.60, p<10–136), (e) adaptation rate (ε) (r=0.48, p<10–77), and (f) expected influence (δ) (r=0.87, p<10–325). Under the Uncontrollable condition as well, all parameters were well identified: (g) inverse temperature (β) (r=0.74, p<10–235), (h) sensitivity to norm PE (α) (r=0.60, p<10–130), (i) initial norm (μ) (r=0.82, p<10–325), (j) adaptation rate (ε) (r=0.68, p<10–182), and (k) expected influence (δ) (r=0.90, p<10–325). Each dot represents an individual. fMRI, functional magnetic resonance imaging; FT, forward thinking.
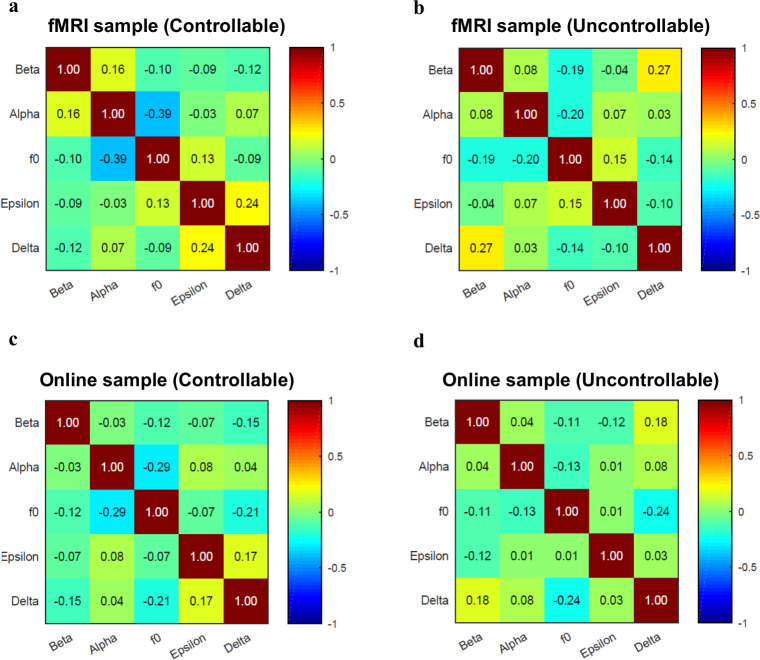
Figure 4—figure supplement 2. Cross-parameter correlations.

Figure 4—figure supplement 2.

The numbers in the matrix denote Pearson’s correlation coefficients. The parameters did not have high correlations in general. The alpha (sensitivity to norm prediction error) and the f0 (initial norm) was moderately negatively correlated (r=–0.39) under the Controllable condition for the fMRI sample, but they still were recoverable (alpha: r=0.57, p<10–4, f0: r=0.66, p<10–6; see Figure 3—figure supplement 3b,c). fMRI, functional magnetic resonance imaging.
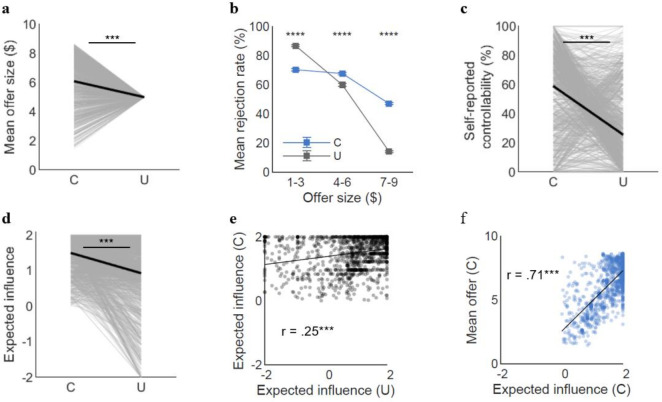
Figure 4—figure supplement 3. Online sample: results without those who had negative deltas.

Figure 4—figure supplement 3.

All behavioral results still held without the individuals who had negative deltas. Specifically, there were significant differences between the two conditions in (a) offer size (t(1,265)=22.94, p<0.001), (b) rejection rates for the middle (t(1,265)=10.23, p<0.001) and high offers (t(934)=31.40, p<0.001), (c) self-reported controllability (t(1,265)=26.23, p<0.001), and (d) expected influence (t(1,265)=19.54, p<0.001). (e) Expected influence was positively correlated between the two conditions (r=0.25, p<0.001), and (f) particularly, expected influence under the Controllable condition was positively correlated with mean offers (r=0.71, p<0.001). Error bars and shades represent SEM. ***p<0.001. For (a, c, d), each line represents a participant and each bold line represents the mean. For (e, f), each dot represents an individual. C, Controllable; U, Uncontrollable.
Figure 4—figure supplement 4. Correlations between expected influence and self-reported controllability for each condition and each sample.
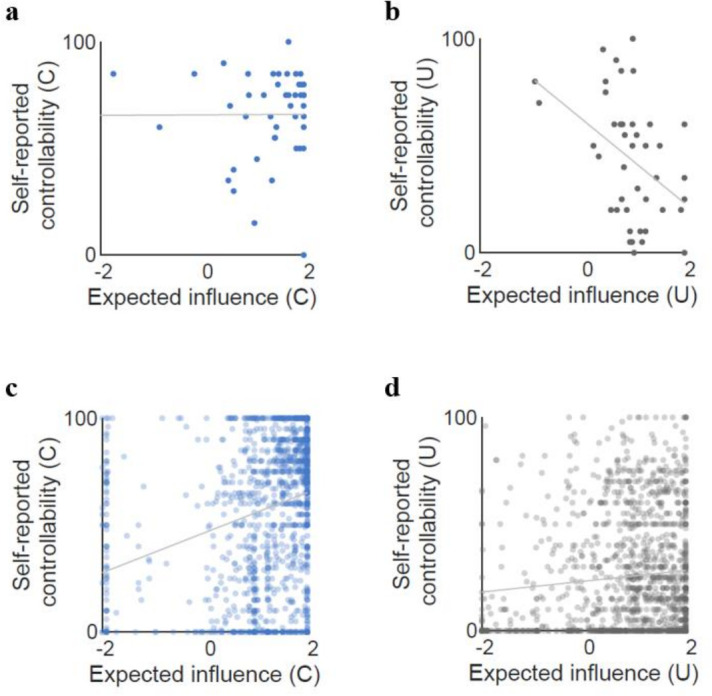
Figure 4—figure supplement 4.

(a, b) For the fMRI sample, expected influence and self-reported controllability were not correlated under the Controllable condition (r=0.00, p=0.98), but negatively correlated under the Uncontrollable condition (r=–0.43, p<0.01). (c, d) For the online sample, self-reported controllability was correlated with expected influence for both the Controllable (r=0.27, p<<0.0001) and the Uncontrollable conditions (r=0.10, p<0.001). Here, expected influence captures an individual’s estimation of controllability on an objective scale (in dollars), whereas self-reported belief reflects a person’s sense of controllability on a subjective scale (0–100%). Despite the result from the fMRI sample, it would be unrealistic that the practical mental estimation of controllability and the high-level belief about it are completely dissociated. Indeed, the larger online sample showed a weak but positive correlation between the two measures. Although quantitative measures of ‘mentally simulated’ controllability are absent, the existing literature also supports the significant connection between ‘actual’ controllability and perceived controllability (Guinote, 2017; Lachman and Weaver, 1998). Based on such premise, further studies are needed to assess the structure of their relationship (i.e., to what degree they are processed hierarchically and in parallel) and thus to better understand the connection and discrepancy of the two systems—exploitation of controllability and the construction of sense of control. Each dot represents an individual. C, controllable; fMRI, functional magnetic resonance imaging; U, Uncontrollable.