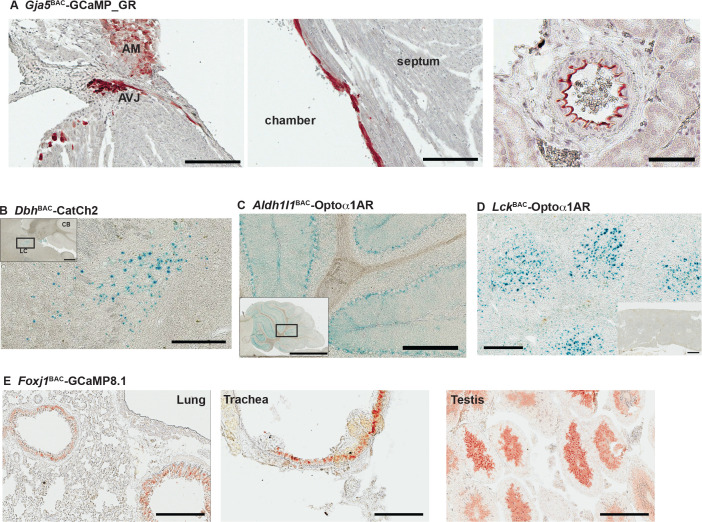
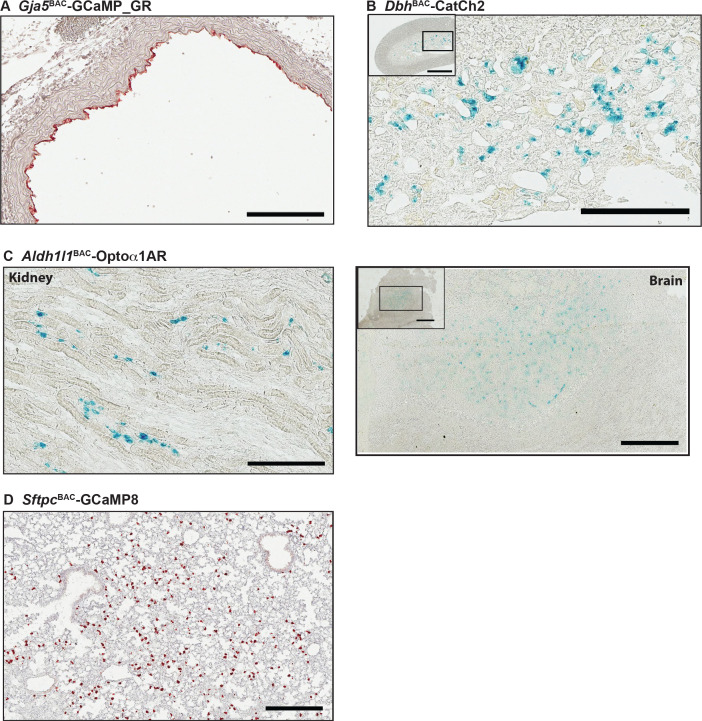
Figure 8. Characterization of other CHROMus mouse lines.
(A) Anti-GFP immunohistochemistry (IHC) of Gja5BAC-GCaMP_GR mouse. The modified GCaMP3 protein is expressed in the atrioventricular junction (AVJ) region, atrial myocytes (AM) (left panel) and cells lining the endocardium in the adult heart (middle panel; scale bars: 200 µm) and the renal artery (right panel; scale bar: 60 µm). (B) X-gal staining of adult brain sagittal section from DbhBAC-CatCh2_IRES_lacZ mouse showing LacZ expression in the locus coeruleus region. Box outlines area of enlargement. CB: cerebellum; LC: locus coeruleus. Scale bars; top panel: 500 µm; bottom panel: 200 µm. (C) X-gal staining of cerebellar region from Aldh1l1BAC-Optoα1AR_IRES_lacZ mouse. Box outlines area of enlargement. Scale bars; top panel: 2 mm; bottom panel: 200 µm. (D) X-gal staining of spleen from LckBAC-Optoα1AR_IRES_lacZ mouse. Inset image shows X-gal staining from a wildtype littermate control. Scale bars: 300 µm; inset: 600 µm. (E) Anti-GFP IHC of lung, trachea, and testis tissues from Foxj1BAC-GCaMP8.1 mouse. Scale bars: 200 µm. All images shown are representative images from three animals unless otherwise specified.


