Abstract
The world's population is aging, and eldercare services that use smart facilities such as smart homes are widely common in societies now. With the aid of smart facilities, the present study aimed at understanding an elder's moods based on the person’s activities of daily living (ADLs). With this end in view, an explainable probabilistic graphical modeling approach, applying the Bayesian network (BN), was proposed. The proposed BN-based model was capable of defining the relationship between the elder's ADLs and moods in three different levels: Activity-based Feature (AbF), Category of Activity (CoA), and the mood state. The model also allowed us to explain the transformations among the different levels/nodes on the defined BNs. A framework featured with smart facilities, including a smart home, a smartphone, and a wristband, was utilized to assess the model. The smart home was an elderly woman's house, equipped with a set of binary-based sensors. For about five months, the ADLs' data have been recorded through daily behavioral-based information, registered by experts using a defined questionnaire. The obtained results proved that the proposed BN-based model of the current study could promisingly estimate the elder's moods and CoA states. Moreover, in contrast to the machine learning techniques that behave like a black box, the effect of each feature from the lower levels to the higher levels of information of the BNs can be traced. Implications of the findings for future diagnosis and treatment of the elderly are considered.
Keywords: Activities of daily living, Ambient-assisted living, Bayesian network model, Smart home, Human mood prediction
Introduction
Nowadays, developed societies are characterized by an increase in people's life expectancy and growth in the research on the aging phenomenon. In most communities, with the growth of medical, welfare, and economic indices, the number of elderly people is expected to increase significantly. The World Health Organization (WHO) has estimated that the number of people aged 60 and over will reach 1.2 billion by the year 2025 and more than 2 billion by the year 2050 [1].
The elderly people are more susceptible to diseases such as Parkinson's, diabetes, Alzheimer's, cardiovascular diseases, or physical and mental disabilities. Among the diseases related to old age, mental disorders such as depression and dementia are important to researchers. Depression is the most common cause of emotional distress in life that significantly reduces the quality of life in the elderly [2]. In the UK, half of all health issues are related to mental disorders such as depression or nervous breakdown, and 13% of the UK National Health Service budget is devoted to mental illnesses, with an approximate estimate of around 12 billion pounds a year [3].
Looking into the literature of research on the elderly reveals that researchers have conducted plenty of studies aiming at monitoring the elderlies' behavior, early understanding of the illness symptoms, and preventing physical and mental issues. One of the relevant innovations in this regard is called the ambient-assisted living (AAL) system, which focuses on the use of communication and information technologies in people's daily lives and their environment. The AAL system can assist the elderly to be more active and live longer independently. Nowadays, the latest developments in the AAL are obtained with the aid of smart facilities, which are used to monitor and assist people in their daily lives. Early diagnosis of diseases, full-time monitoring of medical conditions, and assistance in treating diseases are examples of the benefits of using smart facilities.
The activity of daily living (ADL) is one of the most important concepts concerning smart homes, which allows the early diagnosis of symptoms of diseases such as Alzheimer's and dementia. ADL can also indicate a decrease in a person's ability to live independently [4]. ADL refers to a set of activities such as eating, bathing, getting dressed, sleeping, and watching TV, all done throughout the day by a person. Detecting and monitoring ADLs with the aid of sensors that are embedded in the living environment of the person of interest to researchers are an important feature of AAL technology and smart homes. It is common among researchers to apply signal processing and machine learning algorithms to analyze and detect ADL-related activities [5].
According to the construction-defined goals for smart homes, the relevant ADLs should be selected and monitored consecutively. Thus, in a smart home, any abnormal behavior or abnormality in a person's life can be detected prior to the advanced stages of any disease and reacted appropriately. This process is called abnormality diagnosis.
Mental illnesses such as depression, Alzheimer's, and neurological disorders include symptoms such as depressive behavior, weight loss, insomnia, oversleeping, slowness of daily activities, lack of energy, disorders in eating and social activities, and decreased concentration. In other words, mental disorders lead to changes in the normal pattern of daily activities. With a network of different sensors in smart homes, many abnormalities in the quality of the above-mentioned activities and the symptoms of disorders such as depression or Alzheimer's can be detected with the aid of a smart system [6, 7].
To process information in smart homes, raw data can be collected with the aid of environmental, wearable, and audio/video-based sensors from the elderlies and their surroundings. In a preprocessing stage, the data need to be cleared of noise, lost data need to be managed, and then, the preprocessed data have to be converted into an appropriate machine-readable format. In the next steps, the data are converted into a set of segments, and then, appropriate features can be extracted for diagnostic purposes [8].
In the literature, there are two approaches for analyzing human’s daily activities and cognitive behaviors: using a method to find a pattern of the interested behavior or activity of the individual, and using machine learning techniques for modeling the relationship between human activity-based features and its cognitive behaviors.
Park et al. [9] considered each activity as an episode and recorded it as a triple set of events, including the sensor ID, time, and duration of sensor activities to perform an event. For estimating anomaly, similarity-based scoring functions were used to compare each new episode with the existing episodes. Other researchers have applied the same mechanism in using clustering approaches [10], and a voting system among several models [11].
There are different approaches to detect human habits and anomalies, such as: using the period and amount of activity of the sensors to perform a specific activity [12], investigating the pattern of room-to-room transitions [13], extracting features such as the duration and time of work, the number of sensors activated to perform the activities, and the information about sleep disorders [14].
In another category of methods for diagnosing cognitive behaviors, the theories and ideas of experts in cognitive sciences, medicine, and psychiatry were used to extract the features and annotate the samples. At each given time period, based on clinical evaluations, points were assigned to activities performed (as labels), and the intelligent system attempted to model the relationship between the extracted features and the labels. For example, in [15], the user utilized a mobile application that was created based on Russell's circumplex model of affect (RCMA) [16] to declare his mood several times a day, which was used by the machine learning system to learn. Similar studies were performed using a smart wristband [5], smartphone [17], smart home [6], smart home, and wearable sensors [18].
For analyzing individual behavior abnormalities, various studies attempted to compare an individual's daily activities with different health assessments such as Geriatric Depression Scale (GDS), Mini-Mental State Exam (MMSE), and Short-Form Health Survey (SFHS) [19], Timed Up and Go (TUG) test and Repeatable Battery for the Assessment of Neuropsychological Status (RBANS) [6], Pittsburgh Sleep Quality Index (PSQI) [20, 21], RBANS, Prospective, Retrospective Memory Questionnaire (PRMQ), Digit Cancellation, ARM Curl, TUG, and GDS [7].
Different machine learning methods such as regression [15], SVM (support vector machines) [5], the voting method [11], and neural networks [10] have been used to diagnose abnormalities in the human mood or behavior. In this study, a probabilistic Bayesian network(BN) method was proposed that could deal with uncertainty and missing data, which is one of the undeniable challenges in similar sensorial-based systems [22]. Another advantage of the BN model is the possibility of using expert knowledge in designing the BN model's topology [23]. Firstly, this helps us to train the system parameters with a smaller number of instances, and secondly, the transformation of different levels of information can be explained on the network, meaning that the impact of each of the lower levels of information on the higher levels is assessable.
Table 1 summarizes some of the studies in the field of anomaly diagnosis over behavior and mood in which data collection methods, data analysis methods, anomaly diagnosis techniques, the types of the anomaly, and the psychological labeling approach (if there is) are described.
Table 1.
A summary of the studies that used datasets to diagnose an anomaly in behavior and mood
| References | Sensors | Data analysis method | Anomaly diagnosis technique | Type of anomaly | Psychological labels |
|---|---|---|---|---|---|
| [5] | Wristbands | RCMA | SVM | Mood | Yes, by mobile app and interview |
| [6] | Smart home | RBANS, and TUG Assessments | SVM | cognitive/ physical health | Yes, every 180 days |
| [7] | Smart home | Various assessments | ML techniques | Alzheimer | Yes, twice a year |
| [9] | Smart home | Normal pattern | Scoring function | Behavior | No |
| [10] | Smart home | Clustering | Threshold values | Dementia | Yes, before and after changing medications |
| [11] | Smart home | Normal ADLs | Voting approach | ADL Abnormality | No |
| [12] | wearable | Normal ADLs | Decision tree | Habit | No |
| [13] | Smart home | Rooms transitions | Rule-Based approach | Behavior | No |
| [14] | Smart home |
ADLs pattern related to MCI |
ML techniques | Symptom’ MCI | Yes, case base label |
| [15] | Smartphone | RCMA | Regression model | Mood | Yes, daily by user |
| [17] | Smartphone | CESD assessment | Tertius algorithm | Depression | Yes, weekly by user |
| [18] | Smart home, Wearable sensors | Various assessments | ML techniques | MCI, Parkinson | Yes, case base label |
| [19] | Smart home | Various assessments | Activity density map | Dementia and depression | Yes, every 6 months |
| [21] | Smart home | PSQI’s Assessment and awakening score | Decision trees, ensemble methods | Human behavior | Yes, daily by Measuring sleep and wake Score |
|
Current proposed work |
Smart home, Smart wristband, smartphone | Evaluation of ADLs and Behavior |
Multilayer Bayesian network |
Mood | Yes, daily by an expert |
ML, MCI and CESD denote machine learning, mild cognitive impairment, and Center for Epidemiological Studies Depression, respectively
In this study, the activities of the elderly and the impact of mood changes on their daily activities are investigated. In order to collect the required data, a framework featured with smart facilities, including smart home, a smartphone, and a smart wristband, was used. The required human activity-based features such as the amount and quality of prayers, physical conditions, watching TV, eating meals, being active to do home chores, social activities, the quality and manner of activities related to sleeping and napping (relaxing) were extracted and used to analyze an elderly's mood. After collecting the daily sensorial-based information, a psychology team inspected the information, observed the subject, and recorded her psychological scores accordingly. The psychologists' scores were then used as labels for the collected data for the intelligent system model to learn. The main contribution of this article is proposing a multilevel probabilistic BN framework as a learning system to model the relationship between a person's mood and his/her daily activities at different levels, which can be used for diagnosing, analyzing, and estimating his/her mood’s state. The proposed system, including a smart home (with simple sensors) and commonly available devices, used three different smart devices, which could cover daily human activities.
This paper is organized as follows. Section 2 elaborates on the methodological issues underpinning the current study, including the main processes, data acquisition processes, feature extraction, and discretization procedures, the annotation process, and BN modeling. Experimental results and discussions of the results are presented in Sect. 3, and finally, Sect. 4 presents the concluding remarks concerning the current study.
Methodology
In this study, a descriptive model was proposed to estimate human mood’s state, by modeling the relationship between daily human activities and mood’s states. For implementing such a model, a sensorial-based dataset with a psychological-based label of the elderly's daily mood states was needed for the machine learning and information analysis processes.
For the psychological-based labeling process, based on the General Health Questionnaire (GHQ-28), Beck Depression Inventory, and PSQI, which are known standard questionnaires, the team of psychologists proposed a new questionnaire suitable for our experiment scenario and its limitations.
There are various datasets concerning the ADLs obtained by different intelligent systems; however, information concerning the daily elderly person's mood state, labeled by experts, was not available. Therefore, a system was designed to collect the required daily data with regard to the elderly's ADLs through a specific intelligent system. The psychological status of the person was checked every day by a psychologist team.
From the data of the intelligent system and the information of the psychologist team, the features related to the ADLs of the subject and her feelings were extracted. Moreover, with the aid of the proposed probabilistic BN model, the mood of the person was estimated with different levels of analysis.
In what follows in this section, the intelligent system for data acquisition will be elaborated on, along with the procedure of extracting the features of the elderly. Then, the feature discretizing technique and the annotating process will be described, and finally, the proposed BN model method for predicting the mood state will be presented.
Data acquisition and feature extraction
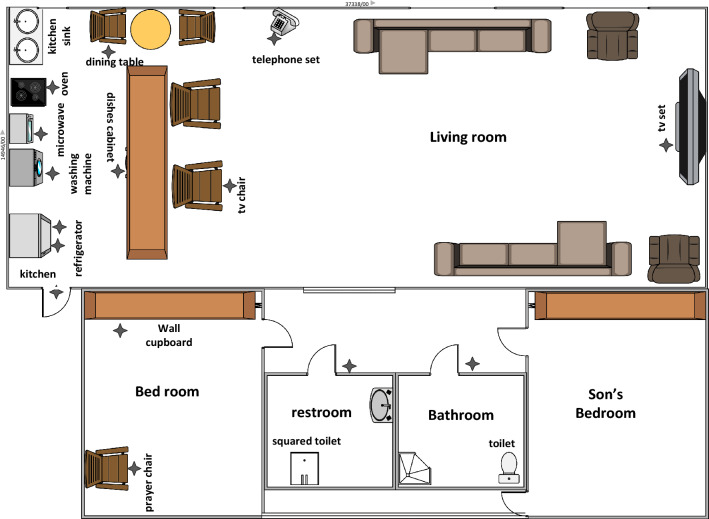
The components of the designed intelligent system were a smart home, a smartphone, and a smart wristband. In the current study, to make the data collection conditions more natural, the private home of a 60-year-old woman was selected as the test site. The smart home, as a smart agent that perceived its environment with the aid of the sensors, could track the ADLs of the resident and the extent to which they interacted with surrounding objects and appliances. For equipping the house, we have been inspired by the smart homes of Center for Advanced Studies in Adaptive Systems (CASAS), which are well known in this research field. These homes use simple sensors with low energy consumption, low expenses, and a high privacy capability [24]. Thus, for this study's purpose, 15 binary sensors were installed in the house of the subject to collect the required information on her ADLs (Fig. 1).
Fig. 1.
The plan of the designed smart house. Sensor’s locations are marked with an asterisk
The types of binary sensors that were used to collect the required information are shown in Table 2. These sensors sent a value of 1 to the data registering system when an event occurred.
Table 2.
List of sensors used in the designed smart home
| No | Location of the sensor | Sensor type |
|---|---|---|
| 1 | Oven | MQ-9 gas sensor |
| 2 | In the refrigerator | IR Sensor |
| 3 | In the freezer | IR Sensor |
| 4 | In the microwave | IR Sensor |
| 5 | Praying chair | IR Sensor |
| 6 | Kitchen cabinet | IR Sensor |
| 7 | Landline phone | IR Sensor |
| 8 | In entry and exit | IR Sensor |
| 9 | Washing machine | IR Sensor |
| 10 | Dining chair | IR Sensor |
| 11 | TV chair | IR Sensor |
| 12 | TV | Power usage sensor |
| 13 | Bathroom | Micro-switch |
| 14 | Restroom | Micro-switch |
| 15 | Closet | Push-button |
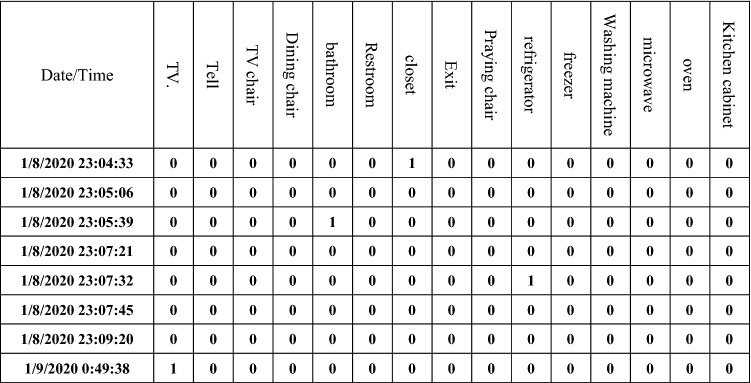
The data storage system was designed so that if the value of one of the sensors changed, all values of the sensors were recorded simultaneously. Figure 2 shows a sample of how the data were stored in the system.
Fig. 2.
A schematic view of the data storage of sensor’s output
With the aid of a mobile application, information about smartphone-related activities, including call time and time spent on social networks, was extracted. The Xiaomi's Mi Band-3 wristband was used to obtain the feature of the daily steps and confirm the information related to sleep, which was detected by the smart home sensors. From the sensors in the smart facilities, 11 activities and 18 features, called activity-based features (AbFs), were extracted (depicted in Table 3).
Table 3.
List of activities with their relevant sensor’s locations and extracted features
| No | Activity | Sensor’s locations | Activity-based Feature (AbF) |
|---|---|---|---|
| 1 | Watching TV | TV, TV’s chair | The period of time spent on watching TV |
| 2 | Calling | Landline phone | Duration and number of phone calls |
| 3 | Eating | Dining chair | Number and duration of meals |
| 4 | Going out | Entry door’s sensor, smart wristband | The period of time being out of the house |
| 5 | Day and night prayers | Praying chair | The period of time spent on day and night prayers |
| 6 | Cooking | Oven, kitchen cabinets, refrigerator, freezer | Number and duration of time spent on cooking |
| 7 | Taking naps | Closet located in the bedroom | The amount of rest times per day, the start and end of rest times |
| 8 | Sleeping | Closet located in the bedroom, other sensors located in places such as the bathroom, restroom, smart wristband, etc | Adequate sleep, sleeping start and end times, number of sleep interruptions, Habitual Sleep Efficiency |
| 9 | Smartphone call | Smartphone | Number and duration of calls |
| 10 | Activity on social networks | Smartphone | Duration of use of social networks |
| 11 | Walking steps | Smart wristband | Number of steps during a day |
Feature discretization
As mentioned before, 18 features were extracted with the aid of the smart facilities, which were continuous values. In order to be able to limit the input states of the proposed BN model, the values of the features were discretized into three discrete values. To discretize some of the features related to walking, sleeping, and watching TV, various studies have been conducted, and there are criteria for discretizing their values, which have been used in this study.
On the other hands, performing some of the ADLs depends on individual habits, and we could not find any criteria for their discretization processes. Thus, for such activities, based on the collected data related to the subject and with the aid of percentile measure or the person's behavioral habits of the previous days, the discretizing process was applied. The following sections describe the discretizing processes of the different features:
Duration of phone calls, eating meals, cooking, using social media, prayer at night, and the duration of time spent out of the house: the total duration of the desired activity for each day was calculated in the whole data set. By using the percentile measure, the values were discretized in three categories (< 33%, > 33% and < 66%, > 66%) with two thresholds. Then, the whole experimental data were discretized with the two thresholds. For example, in one of the experimental processes, the threshold values of 3,530 and 6,197 s were obtained for the duration of the eating meals, in which case, if the duration was above 6,197, between 3,530 and 6,197, and less than 3,530 s per day (< 3530, > 3530 and < 6197, > 6197), scores of three, two, and one were assigned to them, respectively.
The start and end time of napping and sleep and amount of napping: The value of the desired activity was compared with the average value of the activity from the previous seven days. If the difference was less than half an hour, it indicated a small amount of change compared with the pattern during the previous week, and it was given a score of three. If this amount of difference was between 30 min to an hour, it indicated a medium change in the pattern, and its score was two. If the difference was more than an hour, it indicated a large change and was given a score of one.
Watching TV: According to [25], if the rate of watching TV was up to 15% of the ADLs (except sleeping and napping), it was considered ideal, and we assigned a score of three to it. If this amount was between 15 and 27% of the ADLs, the amount was considered almost optimal, and a score of two was assigned to it. If this amount was above 27% of the ADLs, this amount was completely negative that indicated boredom and inactivity, and a score of one was assigned to it.
Walking: According to [26], if the number of steps was above 7,499 per day, it indicated being active, and it was given a score of three. If this value was between 5,000 and 7,499 steps per day, it indicated an average amount of mobility, and it was given a score of two. If the number of steps was less than 5,000, it indicated inactivity whose score was one.
Day prayers: The elderly performed the day prayers every day, but this feature was checked whether the prayers were performed in a mosque (outside of the home) or at home. If she performed her daily prayers in the mosque, it was given a score of three. If she performed only one of the two prayers in the mosque, it was given a score of two; otherwise, the score assigned was one.
Sleep time: According to [21] and based on the PSQI assessment, the total amount of sleep time during the night was discretized. If the duration was more than 7 h, it indicated a sufficient amount of sleep, and its score was three. If this time was between 6 and 7 h, it indicated that the amount of sleep was almost optimal, and its score was two. If this time was less than 6 h, it indicated insufficient sleep, and a score of one was assigned to it.
Sleep interruptions: Based on [21] and according to the PSQI assessment, the number of sleep interruptions, except prayer interruptions during the night, was collected. If there were no interruptions, the score was three. If the subject woke up only once during sleep, the score was two, and if it was more than two times, the score was one.
- Habitual Sleep Efficiency (HSE): This criterion indicates the ratio of the duration of uninterrupted sleep activity to the total sleep time. Based on [21], it is obtained through the following formula.
If the HSE number was above 85, between 75 and 84, and below 75, the assigned scores were three, two, and one, respectively.
Annotation process
In addition to 18 features extracted from the smart facilities, the psychologist team evaluated a set of psychological features, including stress, loneliness, sleep quality, physical health, home chores, charity, and appetite. In other words, the psychologist team used 26 features to obtain the subject’s daily mood. There were three psychologists in the team for labeling the psychological-based features. The voting approach is used for the labeling process. It means for any state of each of those features, that has selected by more than one expert, was the label of that specific feature, otherwise, we have used an averaging process.
To annotate the psychological features as well as the daily mood, a questionnaire with 38 items in eight categories was prepared, the validity of which has been reviewed and approved by three psychologists (Table 4). The psychologist team answered the questionnaire items on a daily basis by visiting the subject’s home, observing and talking to the subject, and the information provided by the smart facilities. Each question had three options, high (score of three), average (score of two), and low (score of one).
Table 4.
Information collected for analyzing mood by a team of psychologists by using the obtained data from the sensorial system and psychologist observations on a daily basis
| No | Category | Items of the questionnaire | Feature | IS | Ps |
|---|---|---|---|---|---|
| 1 | Social activities (SoA) | Duration of being out of home | Outside | * | |
| Duration of telephone usage | Tel | * | |||
| Duration of cellphone call | Cell | * | |||
| Duration of using mobile applications | App | * | |||
| Doing charitable work | Charity | * | |||
| 2 | Cook/Meal (CoM) | Duration of eating meals | Meal | * | |
| Duration of meals preparation | Cook | * | |||
| Having an appetite for food | Appetite | * | |||
| 3 | Sleep (Slp) | Sleep interruptions | Int | * | |
| Getting to bed on time | BeginS | * | |||
| Waking up on time in the morning | EndS | * | |||
| Habitual Sleep Efficiency | HSE | * | |||
| Adequate sleep during the night | TimeS | * | |||
| Sleep Quality | SleepـQuality | * | |||
| 4 | Relax (Rlx) | Watching TV | TV | * | |
| Starting on-time rest during the day | BeginR | * | |||
| Finishing on-time rest during the day | EndR | * | |||
| Adequate rest during the day | TimeR | * | |||
| 5 | Pray (Pry) | Performing daily prayers | P_Day | * | |
| Performing night prayers | P_Night | * | |||
| 6 | Physical state | Number of steps of walking during the day | Step | * | |
| Having mobility and sprightliness | Physical health | * | |||
| Absence of feeling lethargic, weakness, and tiredness | |||||
| Absence of physical pain | |||||
| Absence of dizziness and headache | |||||
| Absence of flushing and sweating | |||||
| Absence of gastric reflux | |||||
| 7 | Home chores | Doing house cleaning chores | Home chores | * | |
| 8 | Emotional | Not feeling sad | Happy | * | |
| Being happy | |||||
| Daily life enjoyment | |||||
| Having a sense of hope | |||||
| Not feeling angry | |||||
| Not feeling bored | |||||
| Not sense of restlessness | Stress | * | |||
| Not feeling worried | |||||
| Not feeling scared | |||||
| Not feeling lonely | Loneness | * |
IS and Ps denote the extracting features from intelligent systems and psychological assessments, respectively
According to the scores given by the psychologist team for the above-mentioned 26 features and summarizing them, a number between 26 and 78 was obtained as the scoring point for subject's each day's mood. By examining the daily scores of training data and using percentile measures, we reached the number of 55 as the threshold mood for the subject under the observation of this study. In other words, a score above and below the threshold is considered as a normal and abnormal mood, respectively. It should be noted that the threshold was obtained according to the mood conditions of the subject and her characteristics. Moreover, the system was personalized based on the specific participant of the current study, meaning that this number can be adapted for other subjects in other settings.
As Table 4 shows, up to 8 categories have been identified; moreover, the emotional categories and home chores were entirely based on the psychological team observations. The rest of the categories, called the Category of Activities (CoAs) with the relevant data from the smart facilities, could be analyzed. Thus, these CoAs’ states were also annotated.
To annotate each of the CoAs, the discretized values of each CoAs’ AbFs were aggregated for each day, and a percentile measure was used on the training data to obtain three categories with two thresholds. The whole data were then discretized with those two obtained thresholds, and then, the CoAs’ states were annotated.
Bayesian network modeling
The Bayesian network is a probabilistic supervised learning approach in which an expert can define the features or variables and their relationships such as directed acyclic graph with a set of nodes (variables) and arches (relationships). The labeled samples would be used for the Bayesian learning parameters that are needed for the BN classification process. Since the network topology can be defined by an expert, the number of samples needed for the learning process is less than other similar machine learning approaches.
In this study, there were three levels of information, namely AbF, CoA, and mood state. The BN was defined to transform the different levels of information in two steps; from a set of AbFs to a CoA, and then from a set of CoAs to a person's mood state. Thus, to understand a person’s mood state, first, the CoAs needed to be estimated. To estimate each CoA, a BN was defined by using the relevant AbFs as the inputs.
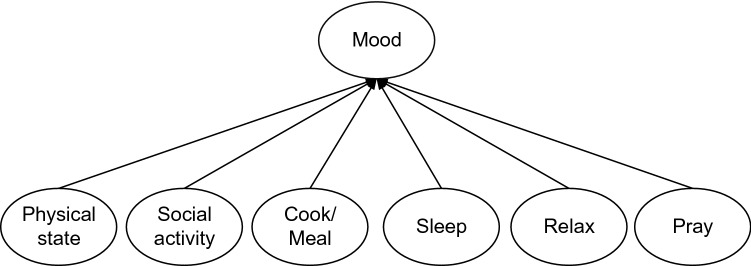
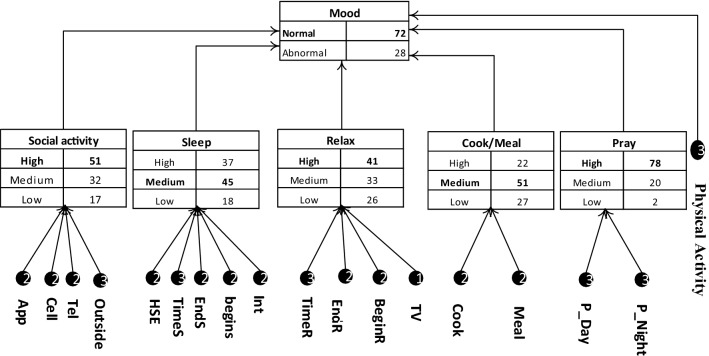
Figure 3 presents the graph of BN that transformed the information from the CoA level to the mood state level. As can be seen, before recognizing the mood state, there were six CoAs that needed to be estimated by the AbFs.
Fig. 3.
BN’s graph for mood state analysis using CoAs
Equation 1 shows the Bayesian formula, which estimates the probability of the mood state, given the CoAs’ states. The right part of the formula, which contains prior probabilities and , and also the likelihood of the CoAs, , was estimated in the training process. The denotes the mood state, and , , , , , and denote the category of Physical state, Social activity, Cook/Meal, Sleep, Relax, and Pray, respectively.
| 1 |
To be able to estimate the likelihood of the CoAs, given the mood state, first, we needed to estimate their states for each trial. Thus, for recognizing each of the CoAs’ states, a BN was defined for each of them to use the relevant AbFs to estimate their correspondent CoAs. In the following, BN for each of the CoAs will be described.
Figure 4 presents the BN for estimating the social activity category (SoA) using the four AbFs. The BN Formula can be seen in Eq. 2. To estimate the CoA, and , as prior probabilities and also as the likelihood of the AbFs, are needed to be calculated during the learning process.
| 2 |
Fig. 4.
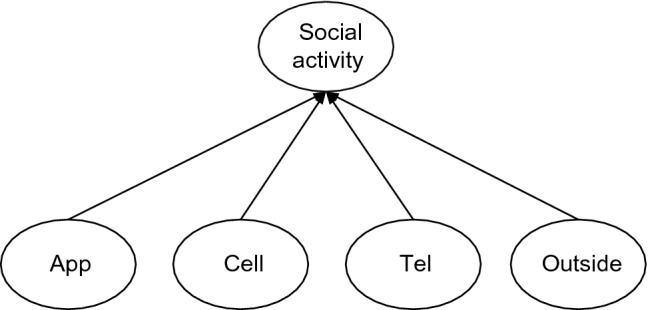
BN’s graph for social activity category analysis using the relevant AbFs. App, Cell, Tel, and Outside denote the time duration of using mobile social networks apps, the time duration of a person’s call by the smartphone and telephone, and the time duration of not being at home, respectively
The category of Cook/Meal (CoM) analyzes the person's daily activities related to cooking and eating the meals, which can be affected by the person's mood. To estimate the related CoA, a couple of AbFs related to the cooking and eating meals are used (See Fig. 5 and Eq. 3).
| 3 |
Fig. 5.
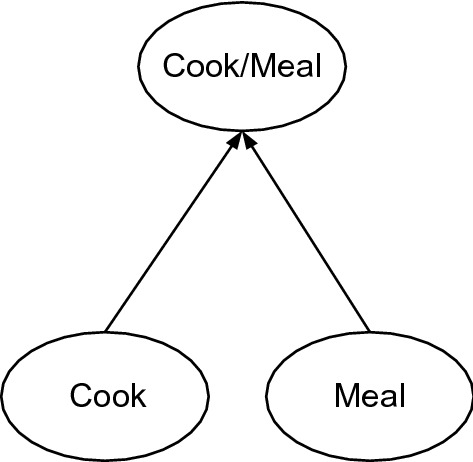
BN’s graph for Cook/Meal category analysis. Cook and Meal mean the overall time duration that a person consumes for cooking and eating her/his meals, respectively
Five AbFs are used to estimate the category of sleep quality, as shown in Fig. 6. The Bayesian formula (Eq. 4) shows how the Sleep category state can be estimated using the relevant AbFs.
| 4 |
Fig. 6.
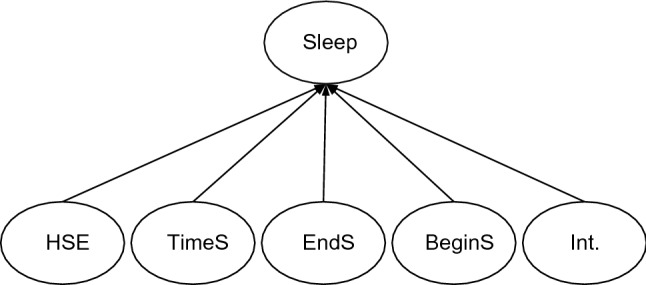
BN’s graph for Sleep category analysis. HSE, TimeS, EndS, BeginS, and Int. denote Habitual Sleep Efficiency, the duration of sleep, wake up time, bedtime, and the sleep’s interruption feature
In the category of Relax, the napping and TV watching times of the subject are analyzed. Thus, for the mentioned purpose, a BN network is defined whose graph and formula are shown in Fig. 7 and Eq. 5, respectively.
| 5 |
Fig. 7.
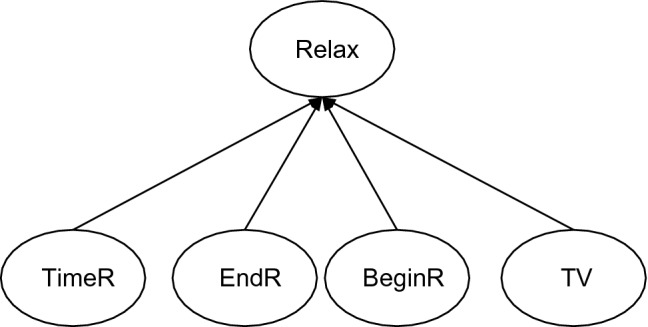
BN’s graph for the category of Relax state analysis. TimeR, EndR, BeginR, and TV denote the time duration of napping, the time going to nap’s end, naptime, and the time duration of watching TV, respectively
The prayers category is defined with respect to the person’s praying activities during the day and night. Thus, a couple of AbFs, P_Day and P_Night are extracted to estimate the Prayers category state of the person. The Bayesian graph and formula can be seen in Fig. 8 and Eq. 6.
| 6 |
Fig. 8.
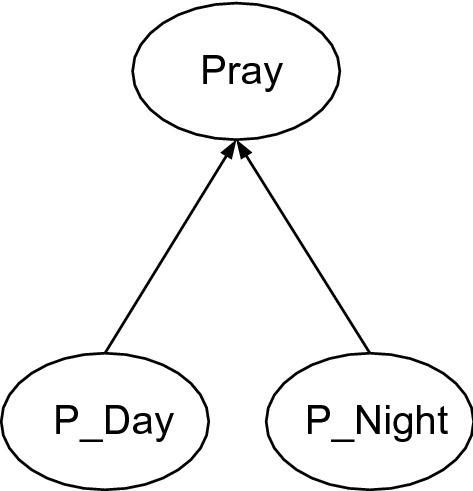
BN’s graph for the category of prayers state analysis. P_Day denotes how many times of the subject’s prayers during a day were in the mosque, and P_Night denotes the time duration of prayers during a night
Finally, for the Physical state category, there is only one relevant AbF, person mobility state that is analyzed by the number of steps per day. For the mentioned category in this model, there is no BN, and the AbF state is directly used as the correspondent CoA state.
Experiment and discussion
As explained in the previous sections, for the implementation part of the study, an elderly woman's house was equipped with different sensors, and also a smartphone and a smart wristband were used to record all needed data related to her daily activities. Meanwhile, a psychology team prepared her mood and CoAs' states (labels) with a set of defined AbFs for every day. Finally, data of 147 consecutive days, which contained 30,844 events from the smart home, 32,420 events from the smartphone, and 735 events from the wristband, were recorded.
The data were collected from 8/1/2020 to 2/6/2020. During this time, various unexpected events happened. There was heavy snow in the winter, due to which the electricity cut off for several hours. Thus, data were not available during this time. Also, for a few days, this event changed the participant's habits. There was also the month of Ramadan, which changed the participants’ activity habits such as meal times, the prayers’ duration time, sleep time, and so forth. From the 44th day of the data collection process, the Covid-19 pandemic was prevalent in the region, which affected the daily activities of the subject. With respect to the mentioned issues, the person's daily activity routine changed many times; thus, it could be expected that the machine learning system had difficulties to find a proper activity-based pattern for understanding the subject's mood states.
To extract the mentioned AbFs for each day, the data needed to be segmented day by day; thus, the AbFs of each day were extracted from two consecutive midnights, except the sleep activity-based features. For the current day's sleep activity-based features, we used the data from 10 at night of the previous day until the mid-noon of the current day. The reason was that each day's sleep activity could start from the previous day, and the standard segmentation could not cover a complete sleep activity of the day.
After extracting the AbFs, and defining the labels of CoAs and Mood states, the dataset was ready for training and evaluating the proposed BN models estimators, using a tenfold cross-validation approach. For the designing and implementation of the BN, the BNT MATLAB toolbox was used [27]. The well-known evaluation parameters, accuracy, precision, recall, and F-score were used to present the proposed model’s performance. Table 5 presents the experimental results from the BNs performed for each of the CoAs and mood states estimation. As mentioned before, the CoAs have three states, and the mood has two states. The accuracy measures what percentage of the model predictions have matched with the psychologist labels, during the testing process. The precision and recall results mean that what percentage of all predicted abnormal mood’s state samples is correct, and what percentage of actual abnormal mood’s state is correctly predicted, respectively. F-score combines both precision and recall characteristics.
Table 5.
Experimental results of the BNs for CoAs and mood estimation
| CoA and mood / evaluator | Accuracy | Precision | Recall | F-Score |
|---|---|---|---|---|
| Social category | 62.80 | 66.93 | 70.51 | 68.53 |
| Sleep category | 62.62 | 61.06 | 71.11 | 65.54 |
| Pray category | 99.59 | 99.20 | 99.58 | 99.38 |
| Relax category | 72.05 | 71.25 | 70.00 | 70.60 |
| Cook/Meal category | 87.95 | 89.35 | 88.11 | 88.68 |
| Mood | 71.66 | 71.04 | 73.32 | 72.11 |
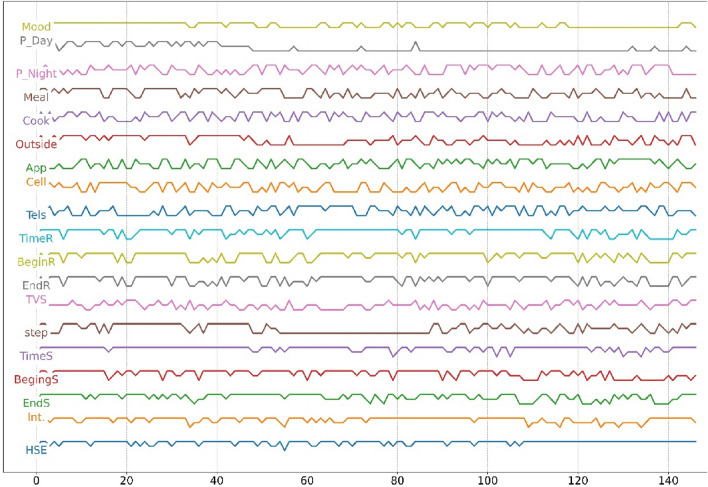
Prayers and Cook/Meal categories were estimated more precisely compared with other categories because (as mentioned in Sect. 2.2) the AbFs of Prayers and Cook/Meal were discretized using the percentile measure method, and only the AbF of “Day prayers” was different. Another reason was that the corresponding AbFs were less affected by the different mentioned unexpected events, which means, by different existent events in the dataset, the state changes of Prayers and Cook/Meal categories could be adequately covered by the defined AbFs. However, the social, relax, and sleep categories were more affected by unexpected events. This was expected because the person’s habits for sleeping and doing social-based activities changed arbitrarily (during the month of Ramadan) or mandatory (during the Covid-19 event). In Fig. 9, we can see the mentioned AbFs’ values and mood state changes during the acquisition days. As can be seen, the mood state is decreasing after the Covid-19 pandemic. During the Covid-19 pandemic, when the month of Ramadan began, a massive change in the participant’s activities could be detected, which decreased her quality of life and affected her mood state strongly.
Fig. 9.
Presenting extracted features (AbFs), which are discretized, and mood state changes during all 147 days. There was heavy snow on the 35th day of our data collection phase, due to which electricity of the whole city cut off for several hours. The 109th day to the 137th day of our data collection phase coincided with the month of Ramadan, and from the 45th day, the Covid-19 pandemic started in the region
During the pandemic, especially between the 55th to 85th day of the collection data, the person's outside-based activities like the step, outside, and visiting family were limited; however, the daily psychologist visiting was still remained, with respect to the COVID-19 restrictions. As can be seen in Fig. 9, the event strongly affected the person's mood state. However, our system could deal with it.
We should mention that the proposed system can deal with those routine changes, like what’s happened during COVID-19. Thus, the problem is that in the dataset, the number of sampling data with respect to the amount of daily routine changes was not adequate, which is understandable, because our system needs about 7 days to adapt to the new changes. However, dealing faster with the daily routine changes is an open issue for our future works.
The obtained results proved that the proposed system could estimate the subject’s CoAs states, and then, with respect to their estimated states, the next level of BN could predict her mood states. Since the system is a probabilistic-based approach, the probability of all CoAs states and the mood states will be available every day, and the state with maximum probability for each of the CoAs and mood was considered as the BN estimation result. Figure 10 presents our BN results for one example day, which predicts the normal state of the person’s mood with a probability of 72%. Meanwhile, the probabilities of CoAs’ states are available. As can be seen, the categories of prayers, relaxation, social activity, and physical activity are estimated at a high and the others at a medium level.
Fig. 10.
A sample of BN results with three levels of information, AbFs, CoAs, and mood. The estimated probabilities of CoAs and mood states are available, and the states with the highest probability for each of the CoAs or mood are selected as the BN’s outputs. The mentioned numbers on the AbFs circles are the discretized values obtained from the input. AbFs values were extracted from the example day
Analyzing whether the proposed BN approach is comparable to the state-of-the-art ML approaches, to check whether the explainability of the model was not at expense of its prediction accuracy, we have used the same dataset and the same cross-validation approach for the evaluation process of the other ML approaches. For implementing the ML techniques, we have used the AbFs and the Mood’s state as input and output of those models, respectively. Thus, in those models, we do not have any midlevel analysis. As shown in Table 6, Naïve Bayesian technique outperformed the rest of the ML techniques.
Table 6.
A comparison between the proposed BN model and other machine learning techniques for Mood’s state estimation
| Machine learning methods | Accuracy | Precision | Recall | F-Score |
|---|---|---|---|---|
| K-Nearest Neighbors (KNN) | 75.51 | 69.12 | 75.81 | 72.31 |
| Support vector machine (SVM) | 82.31 | 82.35 | 80.00 | 81.16 |
| Decision tree (DT) | 70.75 | 67.65 | 68.66 | 68.15 |
| AdaBoost tree | 75.51 | 69.12 | 75.81 | 72.31 |
| Multilayer perceptron (MLP) | 82.31 | 82.35 | 80.00 | 81.16 |
| Naïve Bayesian | 86.39 | 86.76 | 84.29 | 85.51 |
| Proposed BN model | 71.66 | 71.04 | 73.32 | 72.11 |
We should mention that the focus of this article is on proposing a multilayer explainable model, and the Mood’s states prediction directly from the AbFs is not our main concern, but it would be informative to have a comparison between our proposed model and the state-of-the-art ML approaches. As can be seen in the comparison table (Table 6), the Naïve Bayesian technique has a higher performance than our BN model. The difference is that in the Naïve Bayesian method, the mood’s states are estimated directly from the AbFs, and those AbFs are considered independent to each other and have the lack of explainability. Since there is a midlevel transformation in our proposed BN, it makes sense that its performance for Mood’s state estimation would be lower than others.
For analyzing the resiliency of the model for missing data in the system, we tested the BN model by losing one type of feature in a separate analysis. For testing this situation, data for the learning process were the same, but during the test, we did not give the value of one of the input features to the model, and then, we calculated the evaluation parameters using the same cross-validation approach. Since the Bayesian theory keeps the prior knowledge of all of the input features obtained during the training process, the model uses the prior information of the missed value and with the probability of other features try to do the estimation properly. Table 7 presents the evaluation results of the person's mood estimation with missing different feature types of values. It can be realized that the model can promisingly deal with the missing data.
Table 7.
The BN performance with losing different AbFs for estimating person’s mood state
| Type of feature | Accuracy | Precision | Recall | F-Score |
|---|---|---|---|---|
| P_Night | 71.09 | 70.57 | 72.71 | 71.59 |
| P_Day | 70.76 | 70.19 | 72.84 | 71.38 |
| Tel | 71.02 | 70.51 | 72.54 | 71.43 |
| Cell and App | 70.21 | 69.55 | 71.72 | 70.52 |
| Outside | 70.60 | 69.98 | 72.54 | 71.18 |
| Meal | 71.07 | 70.69 | 72.21 | 71.41 |
| Cook | 71.37 | 71.08 | 72.63 | 71.82 |
| Int. sleep | 70.47 | 69.93 | 71.99 | 70.90 |
| End/begin sleep | 71.66 | 71.16 | 72.76 | 71.90 |
| Time sleep | 70.83 | 70.18 | 72.26 | 71.10 |
| HSE | 71.09 | 70.47 | 72.62 | 71.50 |
| End/begin relax | 70.56 | 69.97 | 71.98 | 70.89 |
| Time relax | 70.86 | 70.22 | 72.72 | 71.40 |
| TV | 70.22 | 69.40 | 71.82 | 70.46 |
In this study, we are proposing an explainable framework for estimating human daily mood state by analyzing his/her daily activities. Thus, the BN framework does not rely on the subject; it is defined based on the expert questionnaire and the available sensorial system. Thus, it would work with others. However, the performance of the system is another issue that can rely on the quality of raw data, extracted features, and discretization process. The raw data and extracted features came from the available sensorial system and our expert questionnaire. Thus, the only part should we concern is the features of discretized values which can be different with the different subjects. Thus, we have proposed a discretization approach for the extracted features, to deal with that challenge.
For instance, one of the discretization methods for some of those features relies on the average of the feature’s values in the previous seven days of the person. It means, if the person's daily routine changed, it affects the value discretization of the feature, but it can be adapted by a maximum of seven days. For example, if the routine start time of sleep of a person is 11 pm, and it suddenly changed to 1 AM, in the discretization process, we would have a low score for that feature, but if the start time of sleep, stay at 1 AM for seven continues days, the score would not be low anymore, because it considers that the person daily routine is changed, and the normal start time of sleep for that person is 1 AM.
These types of feature discretization methods help the system elaborate itself if the daily routine of a person changes, and also, we believe it would work for a new participant with different daily routines data in the system. Thus, we expect that the framework can adapt itself to a new subject after a week.
Conclusions
In this study, a probabilistic multilevel Bayesian network model was proposed and implemented to estimate an elderly person’s mood state with respect to changes in her daily activities. The BN contains three levels of information, namely activity-based features, category of activities, and mood state of the participant. Based on the multilevel BN, each of the different levels of information can be analyzed by psychologists to realize the reason for the estimated mood state. To do the experiment part, a new dataset was provided using a smart home, a smartphone, and a smart wristband, all annotated by a team of psychologists on a daily basis.
The obtained results proved that the proposed BN can practically estimate a person's mood state and category of activities at different levels and perfectly deal with the uncertainty issues. Since the subject's daily activity habits were changed several times because of unexpected events, it could affect the model performance. However, a specific discretization method has proposed to deal with the changes in person's daily routines, in the future, we intend to solve the problem by extracting new features and investigate on temporal-based modeling approaches such as dynamic Bayesian model definition to properly deal with changes in habits.
Acknowledgments
The authors/creators would like to acknowledge the financial support of Ministry of Science, Research and Technology, and Information and Communication Technology Park for this project under grant number 26-99-02-000267.
Declarations
Conflict of interest
The authors declared that there is no conflict of interest.
Footnotes
Publisher's Note
Springer Nature remains neutral with regard to jurisdictional claims in published maps and institutional affiliations.
Change history
2/9/2022
A Correction to this paper has been published: 10.1007/s10044-021-01056-x
Contributor Information
Mohsen Falah Rad, Email: mfalahrad@iaurasht.ac.ir.
Mojtaba Shakeri, Email: shakeri@guilan.ac.ir.
Kamrad Khoshhal Roudposhti, Email: kamrad@liau.ac.ir.
Iraj Shakerinia, Email: Irajeshakerinia@guilan.ac.ir.
References
- 1.Hossain MA, Ahmed DT. Virtual caregiver: an ambient-aware elderly monitoring system. IEEE Trans Inf Technol Biomed. 2012;16:1024–1031. doi: 10.1109/TITB.2012.2203313. [DOI] [PubMed] [Google Scholar]
- 2.Blazer DG. Depression in late life: review and commentary. J Gerontol A Biol Sci Med Sci. 2003;58:249–265. doi: 10.1093/gerona/58.3.M249. [DOI] [PubMed] [Google Scholar]
- 3.Palmius N, Osipov M, Bilderbeck AC, Goodwin GM, Saunders K, Tsanas A, Clifford GD (2014) A multi-sensor monitoring system for objective mental health management in resource constrained environments. In: Appropriate Healthcare Technologies for Low Resource Settings (AHT 2014). pp. 1–4. 10.1049/cp.2014.0764.
- 4.Debes C, Merentitis A, Sukhanov S, Niessen M, Frangiadakis N, Bauer A. Monitoring activities of daily living in smart homes: understanding human behavior. IEEE Signal Process Mag. 2016;33:81–94. doi: 10.1109/MSP.2015.2503881. [DOI] [Google Scholar]
- 5.Bautista-Salinas D, González JR, Méndez I, Mozos OM (2019) Monitoring and prediction of mood in elderly people during daily life activities. In: 2019 41st Annual International Conference of the IEEE Engineering in Medicine and Biology Society (EMBC). pp. 6930–6934. 10.1109/EMBC.2019.8857847 [DOI] [PubMed]
- 6.Dawadi PN, Cook DJ, Schmitter-Edgecombe M. Automated clinical assessment from smart home-based behavior data. IEEE J Biomed Health Inform. 2016;20:1188–1194. doi: 10.1109/JBHI.2015.2445754. [DOI] [PMC free article] [PubMed] [Google Scholar]
- 7.Alberdi A, Weakley A, Schmitter-Edgecombe M, Cook DJ, Aztiria A, Basarab A, Barrenechea M. Smart home-based prediction of multidomain symptoms related to alzheimer’s disease. IEEE J Biomed Health Inform. 2018;22:1720–1731. doi: 10.1109/JBHI.2018.2798062. [DOI] [PMC free article] [PubMed] [Google Scholar]
- 8.Ni Q, García Hernando AB, De la Cruz IP. The Elderly’s independent living in smart homes: a characterization of activities and sensing infrastructure survey to facilitate services development. Sensors. 2015;15:11312–11362. doi: 10.3390/s150511312. [DOI] [PMC free article] [PubMed] [Google Scholar]
- 9.Park K, Lin Y, Metsis V, Le Z, Makedon F (2010) Abnormal human behavioral pattern detection in assisted living environments. In: Proceedings of the 3rd International Conference on PErvasive Technologies Related to Assistive Environments. pp. 1–8. Association for Computing Machinery, New York, NY, USA. 10.1145/1839294.1839305
- 10.Lotfi A, Langensiepen C, Mahmoud SM, Akhlaghinia MJ. Smart homes for the elderly dementia sufferers: identification and prediction of abnormal behaviour. J Ambient Intell Human Comput. 2012;3:205–218. doi: 10.1007/s12652-010-0043-x. [DOI] [Google Scholar]
- 11.Yahaya SW, Lotfi A, Mahmud M. A consensus novelty detection ensemble approach for anomaly detection in activities of daily living. Appl Soft Comput. 2019 doi: 10.1016/j.asoc.2019.105613. [DOI] [Google Scholar]
- 12.Meng L, Miao C, Leung C. Towards online and personalized daily activity recognition, habit modeling, and anomaly detection for the solitary elderly through unobtrusive sensing. Multimed Tools Appl. 2017;76(8):10779–10799. doi: 10.1007/s11042-016-3267-8. [DOI] [Google Scholar]
- 13.Eisa S, Moreira A. A behaviour monitoring system (BMS) for ambient assisted living. Sensors. 2017;17(9):1946. doi: 10.3390/s17091946. [DOI] [PMC free article] [PubMed] [Google Scholar]
- 14.Paudel R (2018) Cognitive health prediction on the elderly using sensor data in smart homes. Proceedings of the Thirty-First International Florida Artificial Intelligence Research Society Conference, FLAIRS 2018
- 15.LiKamWa R, Liu Y, Lane ND, Zhong L (2013) MoodScope: building a mood sensor from smartphone usage patterns. In: MobiSys 2013—Proceedings of the 11th Annual International Conference on Mobile Systems, Applications, and Services. pp. 389–401 (2013). 10.1145/2462456.2464449
- 16.Russell JA. A circumplex model of affect. J Pers Soc Psychol. 1980;39:1161–1178. doi: 10.1037/h0077714. [DOI] [Google Scholar]
- 17.Doryab A, Jun Ki M, John Z, Jason H (2014) Can your smartphone reveal if you are depressed? KDD 2014 workshop on connected health at big data era. (2014).
- 18.Cook DJ, Schmitter-Edgecombe M, Dawadi P. Analyzing activity behavior and movement in a naturalistic environment using smart home techniques. IEEE J Biomed Health Inform. 2015;19:1882–1892. doi: 10.1109/JBHI.2015.2461659. [DOI] [PMC free article] [PubMed] [Google Scholar]
- 19.Galambos C, Skubic M, Wang S, Rantz M. Management of dementia and depression utilizing in- home passive sensor data. Gerontechnology. 2013;11:457–468. doi: 10.4017/gt.2013.11.3.004.00. [DOI] [PMC free article] [PubMed] [Google Scholar]
- 20.Backhaus J, Junghanns K, Broocks A, Riemann D, Hohagen F. Test-retest reliability and validity of the Pittsburgh Sleep Quality Index in primary insomnia. J Psychosom Res. 2002;53:737–740. doi: 10.1016/s0022-3999(02)00330-6. [DOI] [PubMed] [Google Scholar]
- 21.Williams JA, Cook DJ. Forecasting behavior in smart homes based on sleep and wake patterns. Technol Health Care. 2017;25:89–110. doi: 10.3233/THC-161255. [DOI] [PMC free article] [PubMed] [Google Scholar]
- 22.Khoshhal Roudposhti K, Dias J, Peixoto P, Metsis V, Nunes U. A multilevel body motion-based human activity analysis methodology. IEEE Trans Cog Develop Syst. 2017;9:16–29. doi: 10.1109/TCDS.2016.2607154. [DOI] [Google Scholar]
- 23.Santos L, Khoshhal K, Dias J. Trajectory-based human action segmentation. Pattern Recogn. 2015;48:568–579. doi: 10.1016/j.patcog.2014.08.015. [DOI] [Google Scholar]
- 24.Cook DJ, Crandall AS, Thomas BL, Krishnan NC. CASAS: a smart home in a box. Computer. 2013;46:62–69. doi: 10.1109/MC.2012.328. [DOI] [PMC free article] [PubMed] [Google Scholar]
- 25.Depp CA, Schkade DA, Thompson WK, Jeste DV. Age, affective experience, and television use. Am J Prev Med. 2010;39:173–178. doi: 10.1016/j.amepre.2010.03.020. [DOI] [PMC free article] [PubMed] [Google Scholar]
- 26.Tudor-Locke CE, Myers AM. Methodological considerations for researchers and practitioners using pedometers to measure physical (ambulatory) activity. Res Q Exerc Sport. 2001;72:1–12. doi: 10.1080/02701367.2001.10608926. [DOI] [PubMed] [Google Scholar]
- 27.Murphy KP (2001) Active learning of causal bayes net structure


