

Abstract
Purpose:
The environmental impact of the Fukushima Daiichi nuclear power plant accident is a source of ongoing concern as there is uncertainty regarding the effects of chronic radiation exposure on local plant and animal life from Fukushima-derived radionuclides. In the current study, changes in proteomic biomarker expression due to chronic environmentally derived radiation exposures was examined in wild field mice.
Methods:
Serum from 10 wild field mice (Apodemus speciosus) native to the Fukushima difficult to return zone and from 8 wild field mice native to the Soma area (control) were collected. External dose estimations were completed using measurements of ambient radiation levels and calculating 137Cs concentrations in soil. Internal dose was estimated by counting whole mice using an HPGe detector. Age of the mice was estimated using molar wear. Serum was screened using the aptamer-based SOMAscan proteomic assay technology, for changes in expression of 1,310 protein analytes. A subset panel of protein biomarkers which demonstrated significant changes in expression between control and exposed mice was determined and analyzed using Ingenuity Pathway Analysis (IPA).
Results:
Control animals had a calculated lifetime dose range from 0.001 to 0.007 Gy and exposed animals had a calculated lifetime dose range from 0.01 to 0.64 Gy. No discernable effect of dose rate was seen as relative dose rate correlated with dose for all samples. Detectable values were obtained for all 1,310 proteins included in the SOMAscan assay. Subset panels of proteins demonstrating significant p < 0.05 changes in expression with either an upregulated or downregulated 1.5 fold change over control were identified for both the sample cohort inclusive of all exposed samples and the sample cohort restricted to samples from animals receiving “low” dose exposures. These panels of proteins from exposed animals were analyzed using IPA which highlighted changes in key biological pathways related to injury, respiratory, renal, urological and gastrointestinal disease and cancer.
Conclusion:
Significant changes in expression of proteomic biomarkers were seen in the serum of wild field mice who received environmental exposures to Fukushima-derived radionuclides. Our findings demonstrate novel biomarkers of radiation exposure in wildlife within the Fukushima difficult to return zone.
Introduction
Great East Japan Earthquake and the Fukushima Nuclear Accident
The Great East Japan earthquake, resultant tsunami and Fukushima Daiichi nuclear disaster represents one of the most complex and far reaching disaster events of this century. On March 11, 2011, a category 9 earthquake and resultant tsunami struck the east coast of Japan resulting in the deaths of approximately 20,000 individuals, the displacement of 340,000, and the evacuation of over 100,000 residents from the surrounding Daiichi district. Region wide power outages from the tsunami included loss of power to cooling mechanisms at the Fukushima Daiichi nuclear power plant and resulted in core meltdown of all three operational reactors. Buildup of hydrogen from attempts to vent and cool the reactors caused explosions allowing aerosolized release of radioactive material consisting primarily of 137Cs, 134Cs and 131I isotopes. Later, additional contamination occurred from the unintentional release of water containing radioactive material from the surrounding core and from the spent fuel pools (Mimura et al. 2011, Norio et al. 2011, Holt et al. 2012, IAEA 2015). Though the majority of the radionuclide plume was deposited offshore in the surrounding Pacific Ocean, there was also deposition within the surrounding environment (Steinhauser et al. 2014). Initially, a 20 km “difficult to return” zone was established, which was further expanded to 30 km. This difficult to return zone still exists around the reactor, although it is much smaller than the original 30 km radius. Today’s difficult to return zone contains the towns of Futaba, Okuma, and parts of Namie (Fukushima Prefectural Government Japan 2019). Lack of human activity in much of the difficult to return zone have allowed for animal populations to flourish, to include the large Japanese field mouse.
The Large Japanese Field Mouse
The large Japanese field mouse (Apodemus speciosus) is an endemic species throughout the islands of Japan and specifically to the island of Honshu in which Fukushima prefecture sits (Yuta et al. 2012). The large Japanese field mouse is not to be confused with the small Japanese field mouse (Apodemus argenteus), which has a similar body morphology apart from the size difference. Both mice species are present in the entire Japanese archipelago, but they have a differing preference in terrain. The small Japanese field mouse prefers a dense canopy while the large Japanese field mouse prefers open forests (Shioya et al. 1990). Both animals are characterized as semi-subterranean foragers that often consume seeds. The animals have an almost isotropic exposure to radio cesium depending on the depth of the burrow and the sedimentation rate of the cesium in the soil. For this study, we sought to characterize potential changes in the mammalian blood proteome due to environmental exposures to radiation. The large Japanese field mouse was selected due to the heterogeneity of its environmental exposure to radioactive contamination as its habitat is both above and below ground and as the majority of radiocesium deposition is within the soil this provides a unique exposure pattern.
Biomarker Expression Analysis
Characterization of proteomic biomarkers of radiation exposure and novel proteomic biomarkers of other disease states have previously been done using singleplex enzyme-linked immunoassay (ELISA) or using multiplex immunoassay approaches including reverse phase protein arrays (RPPAs), bead-based assays or electrochemiluminescent-antibody based technologies (Blakely et al. 2018, Boellner and Becker 2015, Himburg et al. 2016, Kuang et al. 2018, Sproull et al. 2017). Multiplex approaches have clear benefits in exploratory studies for biomarker discovery in terms of cost and efficiency as they maximize target screening using less sample volume. To date, the best of these various multiplex platforms could offer was target screening at the level of a few hundred proteomic targets.
In the current study, given the unique nature of the sample set, both in terms of species type and difficulty of collection, we sought to maximize the probability of gaining useful findings by taking advantage of emerging high-throughput technologies, which examine changes in the mammalian proteome using a highly multiplexed approach. With access to a larger array of protein targets, changes in the mammalian proteome due to radiation injury can be better characterized. The novel aptamer-based SOMA-scan proteomic assay technology was used, as it has been validated across multiple species including human, murine, canine, feline and a variety of non-human primates (SomaLogic 2015). This assay also includes analysis of over 1,300 protein analytes using a relatively small volume of sample and as such, was considered the ideal choice for this study to examine changes in the proteome of large Japanese field mice due to radiation exposure.
Materials and Methods
Animal Capture Methods & Blood Extraction
We selected a small mammal for collection for its ease of capture and handling. Only specimens of the Apodemus speciosus species were included in the current study. All mice were captured in (2018) in the Takase Gorge region of the Fukushima difficult to return zone, and control animals were captured in the town of Soma as detailed in Figure 1. Animals were live-captured using a Sherman trap that was baited with a variety of nuts and seeds. It was found that peanuts were the most effective form of bait. The traps were set up in trap lines of 10–15 traps per line and 4–5 lines per location. The traps were secured to the ground, and a brightly colored piece of tape was tied to a tree above its location to minimize traps being lost in the underbrush. Traps were checked daily and reset if needed. A total of 18 mice were captured and one blood sample was taken from each mouse. Information on each mouse can be found in Table 1.
Figure 1. Map of collection sites for the large Japanese field mouse in Japan.
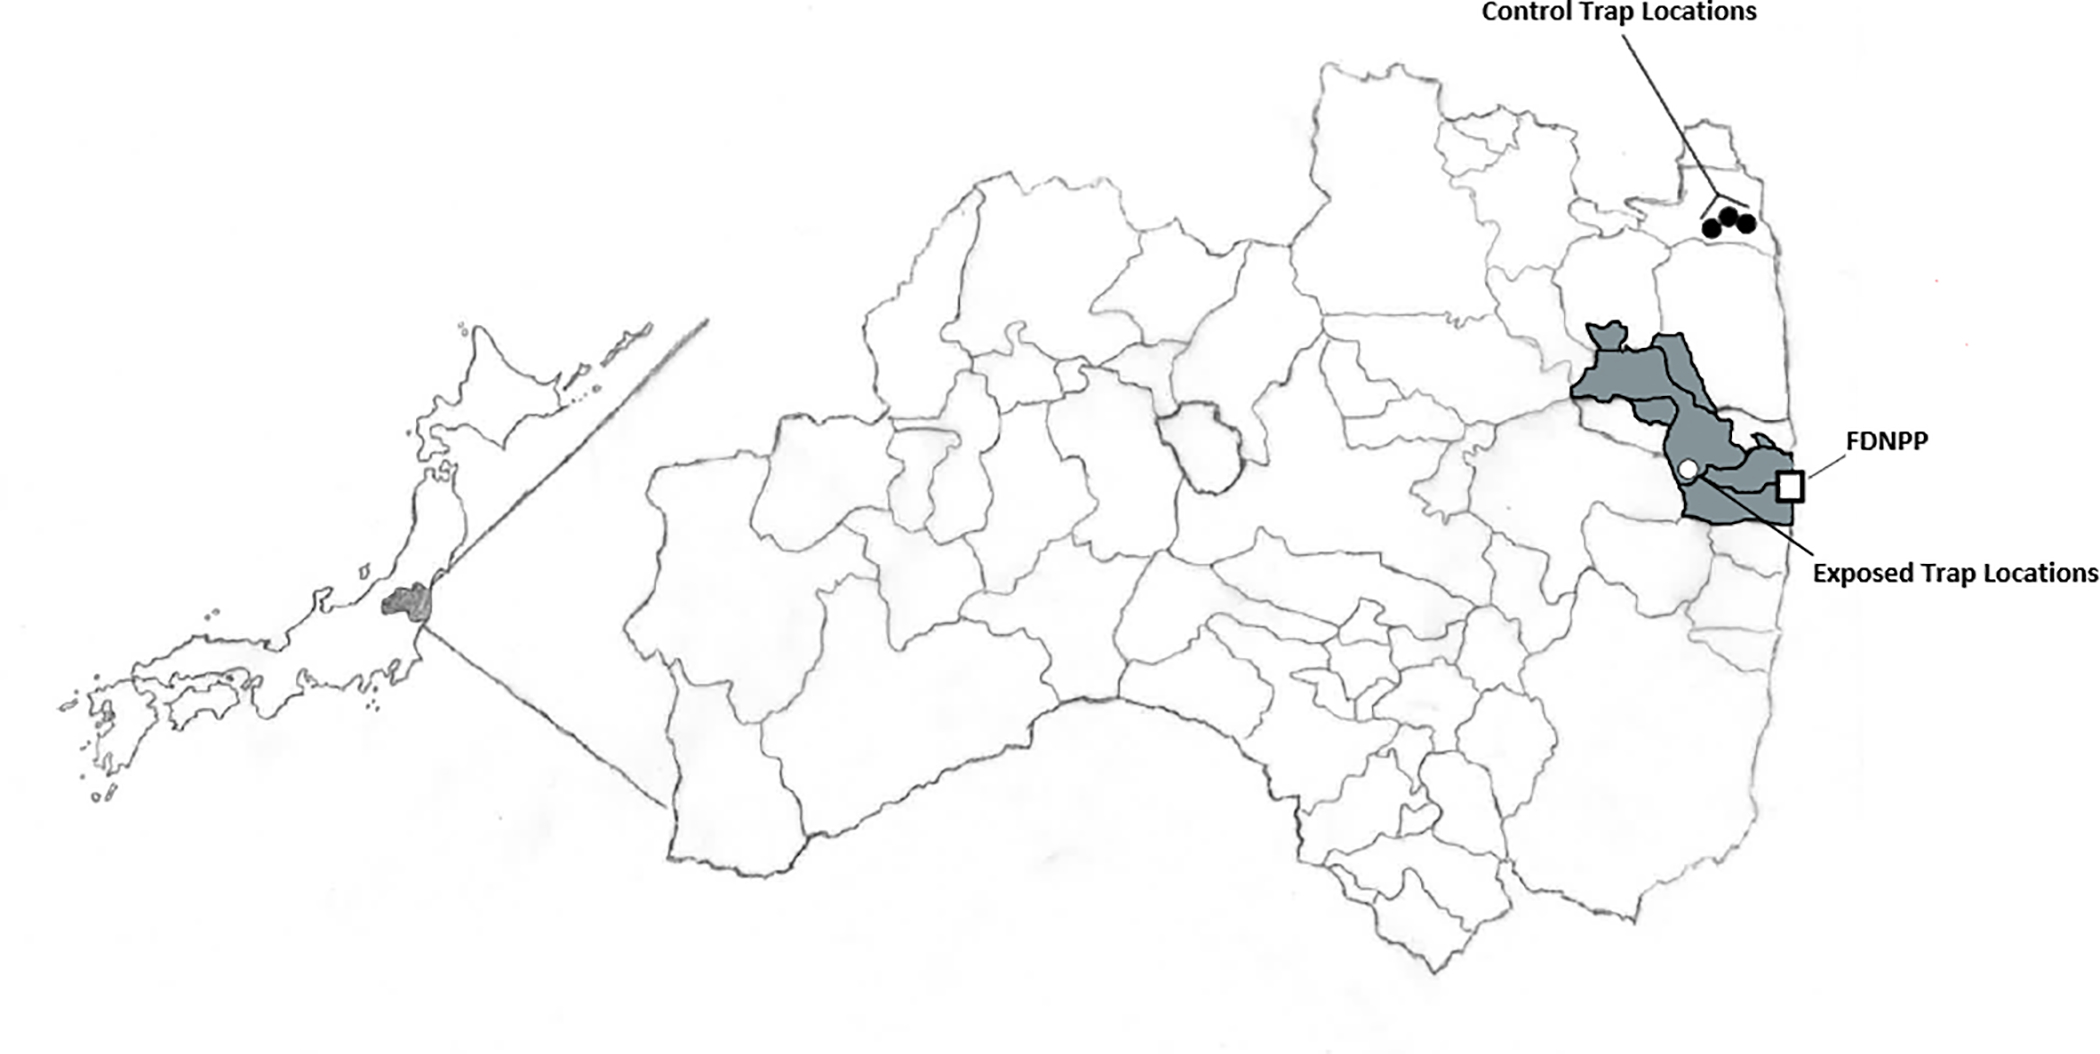
Black circles depict respective trapping regions for control animals within the town of Soma. The white circle depicts the trapping region for all exposed animals. The gray shaded area represents the boundaries of the difficult to return zone as of 2018 and the FDNPP symbol represents the location of the Fukushima Daichi Nuclear Power Plant.
Table 1. Demographics of collected samples.
Summary of age, dose and collection site for all samples from the Large Japanese field mouse included in this study. “Control” samples were collected with the town of Soma and “Exposed” samples were collected within the Takase Gorge region of the Fukushima difficult to return zone.
| Sample Demographics | |||||
|---|---|---|---|---|---|
| Mouse ID | Dose (Gy)* | Age^ | Dose Label | Sample Group | Collection Site |
| 181103S1 | 0.001 | 107 | Control | Control | Soma Site 1 |
| 181110S4 | 0.002 | 213 | Control | Control | Soma Site 3 |
| 181108S1 | 0.003 | 213 | Control | Control | Soma Site 1 |
| 181111S3 | 0.003 | 213 | Control | Control | Soma Site 3 |
| 181110S2 | 0.004 | 304 | Control | Control | Soma Site 2 |
| 181110S1 | 0.005 | 411 | Control | Control | Soma Site 2 |
| 181110S5 | 0.006 | 411 | Control | Control | Soma Site 3 |
| 181110S3 | 0.007 | 472 | Control | Control | Soma Site 3 |
| 181106T1 | 0.010 | 472 | Low | Exposed | Takase Site 1 |
| 181111T1 | 0.119 | 92 | Low | Exposed | Takase Site K3 |
| 181104T1 | 0.120 | 91 | Low | Exposed | Takase Site 1 |
| 181025T1 | 0.120 | 91 | Low | Exposed | Takase Site B7 |
| 181110T2 | 0.120 | 92 | Low | Exposed | Takase Site K7 |
| 181027T2 | 0.126 | 91 | Low | Exposed | Takase Site I7 |
| 181107TI | 0.150 | 107 | Low | Exposed | Takase Site K2 |
| 181025T4 | 0.163 | 107 | Low | Exposed | Takase Site J7 |
| 181025T2 | 0.307 | 213 | High | Exposed | Takase Site G7 |
| 181025T3 | 0.637 | 472 | High | Exposed | Takase Site H2 |
Age value (days) represents the average value from the estimated age range.
Dose estimates represent total lifetime dose.
Following capture, the mouse was removed from the trap and placed into a mesh bag. The animal was secured by grasping the scruff of the animal’s neck through the mesh bag and anesthetized using Telazol or Zoletil at a concentration of 20 milligrams per kilogram body mass, administered via an intraperitoneal injection. Following the confirmed anesthetization of the animal inspection of the animal’s physical characteristics was conducted. Aging of the mice was determined using molar wear (Hikida and Murakami 1980). Undesired species such as the small Japanese field mouse and voles were released. An image of a large Japanese field mouse inside of a Sherman trap can be seen in Figure 2.
Figure 2. Sample collection within the Fukushima difficult to return zone.
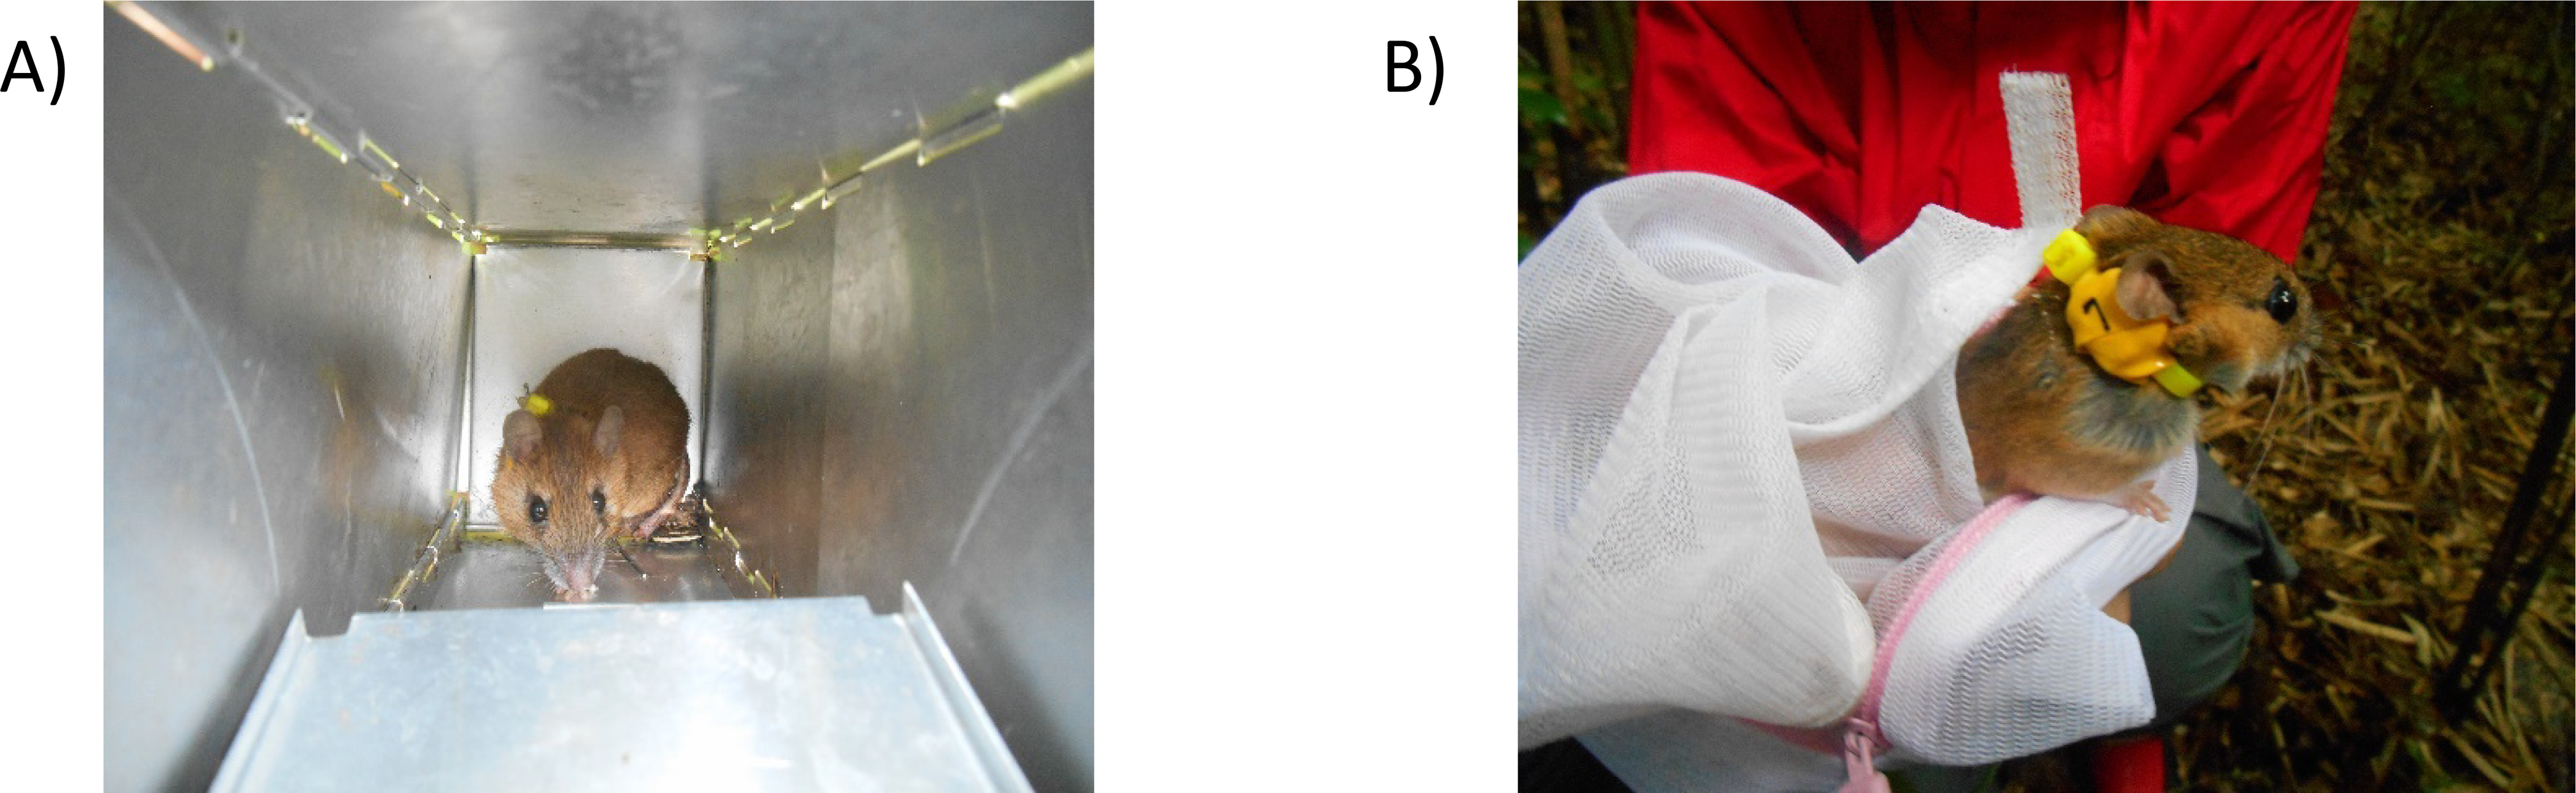
Depicts the capture and handling technique for collection of blood samples from the Large Japanese field mouse (Apodemus speciosus). A) Depicts capture using a baited Sherman trap B) Depicts handling of a specimen using a net bag and tagging with an improvised dosimeter collar
Blood collection was conducted via cardiac puncture. Whole blood was collected in Serum Separator Tubes (SST) and stored upright at ambient temperature until researchers could centrifuge the samples. The SSTs were spun down in the field using a battery operated Tomy benchtop centrifuge for approximately 12 minutes. Serum was transferred from the SST to an Eppendorf microcentrifuge tube and placed in a Styrofoam cooler with ice packs for transportation. Upon return to the laboratory the microcentrifuge tubes were transferred to a −80C freezer within 4 hours of collection for storage. Animals were euthanized via cervical dislocation following blood collection and the bodies were kept for both aging and cesium body burden analysis.
All animal sampling and experiments were conducted with the approval of the Institutional Animal Care and Use Committee of Fukushima University (Permission No. 29–01) and the Colorado State University Institutional Animal Care and Use Committee Protocol # 18–8134A.
Dosimetry
Internal Dosimetry:
Whole mice were counted in a Canberra HPGe detector for 5 × 10⁴ s. The concentration of 134Cs and 137Cs were determined for each mouse in Bq g-1. The internal dose was computed using internal dose factors from Perri and Johnson (Perri and Johnson 2019). Mouse blood samples were paired with concentrations of 134Cs and 137Cs in the mouse from which the blood was drawn. The dose calculations assumed that the concentration was the same throughout the lifetime of the mouse. No corrections for decay were made since no mouse was older than 18 months, and no significant changes in concentration were assumed. The concentration was assumed to be the same throughout the lifetime of the animal because the home range of the large Japanese field mouse is small enough that they would likely not move into or out of areas of lesser or greater environmental contamination for where they were captured (Shioya et al. 1990). Additional methodology for internal dosimetry may be found in Appendix 1.
External Dosimetry:
External doses were assessed using ion chamber readings at 1 m above the surface of the ground near the trap location, then extrapolating 137Cs soil concentration to 5 cm assuming a soil density of 1.6 g cm−3 using FGR-15 (US EPA 2019). The soil concentration was used to calculate external radiation dose rate to the mice using mouse dose factors from Perri and Johnson and estimated age of the mouse (Perri and Johnson 2019). The mice were assumed to spend 50% of their time on the surface and 50% below the surface. The dose contribution due to 134Cs- was not computed based on the small contribution (less than 10%) of 134Cs to internal dose. No corrections for decay were made since no mouse was older than 18 months, and no significant changes in concentration were assumed. External doses due to natural background radiation imparted on control samples were assessed using ion chamber readings 1 m above the surface of the ground near the trap locations. No ground contamination was present, so an extrapolation of cesium soil concentration was not necessary. Additional methodology for external dosimetry may be found in Appendix 1.
SomaLogic SOMAscan Assay
Approximately 160 uL of serum per sample was used for the Somalogic SOMAscan Assay (SomaLogic SOMAscan v3.0 Assay), which uses a novel protein-capture aptamer-based technology (Rohloff et al. 2014). For this study the SOMAscan HTS Assay 1.3K was used and processed through the Center for Human Immunology at the National Institutes of Health. The assay included measurement of 1,310 protein analytes.
Statistical Analysis
In brief, data was received in the form of Relative Fluorescent Units (RFU) for each of the 1,310 proteins in the SOMAscan assay after normalizing for intraplate and interplate variation. These RFU scores for each protein were log2 and z-score transformed. Statistical data analyses were performed using R and Ingenuity Pathway Analysis (Qiagen IPA) (R Core Team 2018).
Results:
This study sought to identify potential changes in blood biomarkers from environmental exposures to ionizing radiation in wildlife from within the Fukushima difficult to return zone. To that end, specimens of the large Japanese field mouse were captured from either the Takase Gorge region of the Fukushima difficult to return zone or from the town of Soma. Serum samples were collected from each specimen and run on the Somalogic SOMAscan assay. Images of the capture and handling methods are shown in Figure 2. Samples from animals taken within the Takase region were considered “Exposed” and samples taken from animals in Soma area were considered “Control.” Sample demographics including dosimetry, estimated age, collection site and dose labels given based on cohort designation are shown in Table 1.
As immunoassays with homology for the large Japanese field mouse are not currently available and in consideration of the scarcity of collected field sample, we sought to take advantage of an emerging technology, the Somalogic SOMAscan assay, which uses a high throughput multiplex proteomic analysis approach. Though the SOMAscan assay was initially designed for homology within human samples, it has been validated for samples from a variety of mammalian species. We determined that the large Japanese field mouse was compatible with the SOMAscan platform and obtained values for all 1,310 targets in both control and “Exposed” samples. For this study, two sample cohorts were compared to the control group. The “Exposed” cohort included samples from all animals captured within the Takase Gorge region and the “Low” dose sample subset included all the “Low” dose labeled samples from within the “Exposed” sample cohort with the (2) “High” dose samples removed.
Control animals received an estimated dose range of 0.001 Gy- 0.007 Gy. Samples labeled “Low” received an estimated dose range of 0.01– 0.16 Gy and the two samples labeled “High” were estimated to have received a dose of 0.31 and 0.64 Gy respectively. These dose labels were selected based on the relative difference in range of exposure within the given sample set. No discernable effect of dose rate was seen as relative dose rate correlated with dose for all samples (Table 1). For a detailed description of the calculation of total dose see Appendix 1.
Using relative fluorescent units (RFU) data obtained for all 1,310 proteins for each sample, differential expression analysis was done selecting for significantly changed proteins with at least a 1.5 fold change (FC) in expression (p < 0.05). Expression profiles for the 38 proteins identified using this criteria for the Control vs. Exposed sample cohort are represented by heatmap (Figure 3A) and volcano plot (Figure 3B). Control samples clustered in this cohort relatively tightly whereas the Exposed samples clustered into two distinct groups (Figure 3A). With removal of the 2 “High” dose labeled samples from the analysis, a separate subset panel of 15 proteins were identified in the Control vs. Low Dose sample subset analysis. These findings are shown in Figure 4 by heatmap (A) and volcano plot (B) respectively. The samples showed reasonable congruency by hierarchical clustering between control and radiation exposed samples with only two of the radiation exposed samples clustering separately (Figure 4A). In the Control vs. Low Dose sample subset there were fewer significantly changed proteins as compared to the Control vs. Exposed analysis. In both analyses, the majority of the proteins showed positive expression changes over control with only matrix metalloproteinase 14 (MMP14) and serine/threonine-protein kinase (PAK6) demonstrating negative expression changes for both analyses (Figure 3B/Figure 4B).
Figure 3. Biomarker expression of Control vs. Exposed samples.
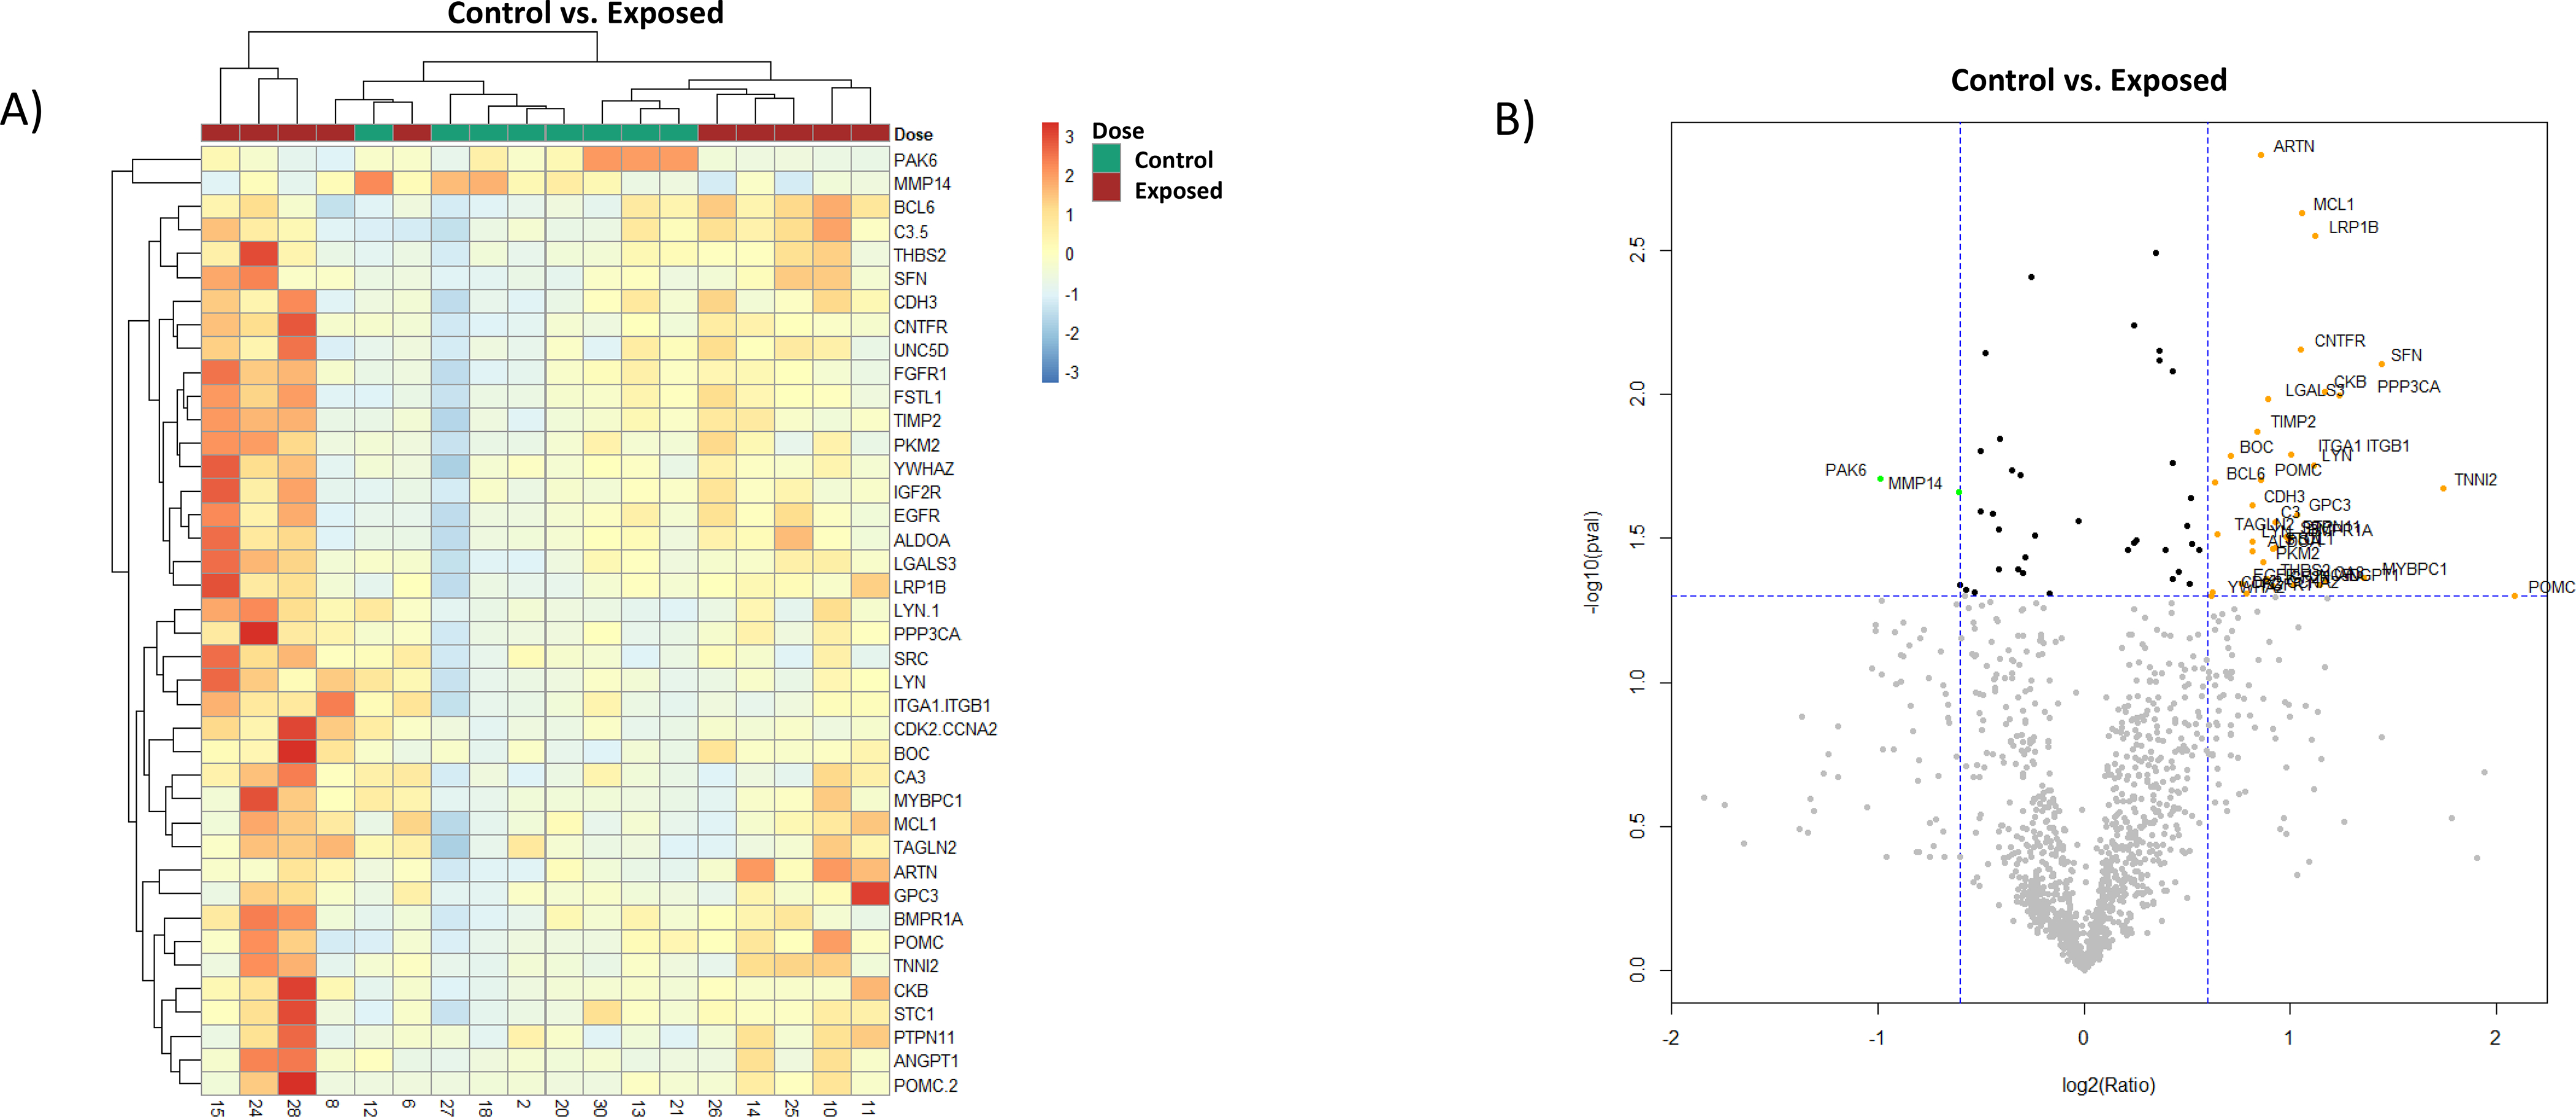
Analysis of proteomic expression within the Control vs. Exposed sample cohorts. Findings are depicted by A) heatmap and B) Volcano plot. For the Volcano plot, the color green represents downregulation and orange upregulation of expression, the horizontal dotted line marks the p-value cutoff (p = 0.05), and vertical dotted lines are FC <1.5 and FC >1.5.
Figure 4. Biomarker expression of Control vs. Low Dose sample subset.
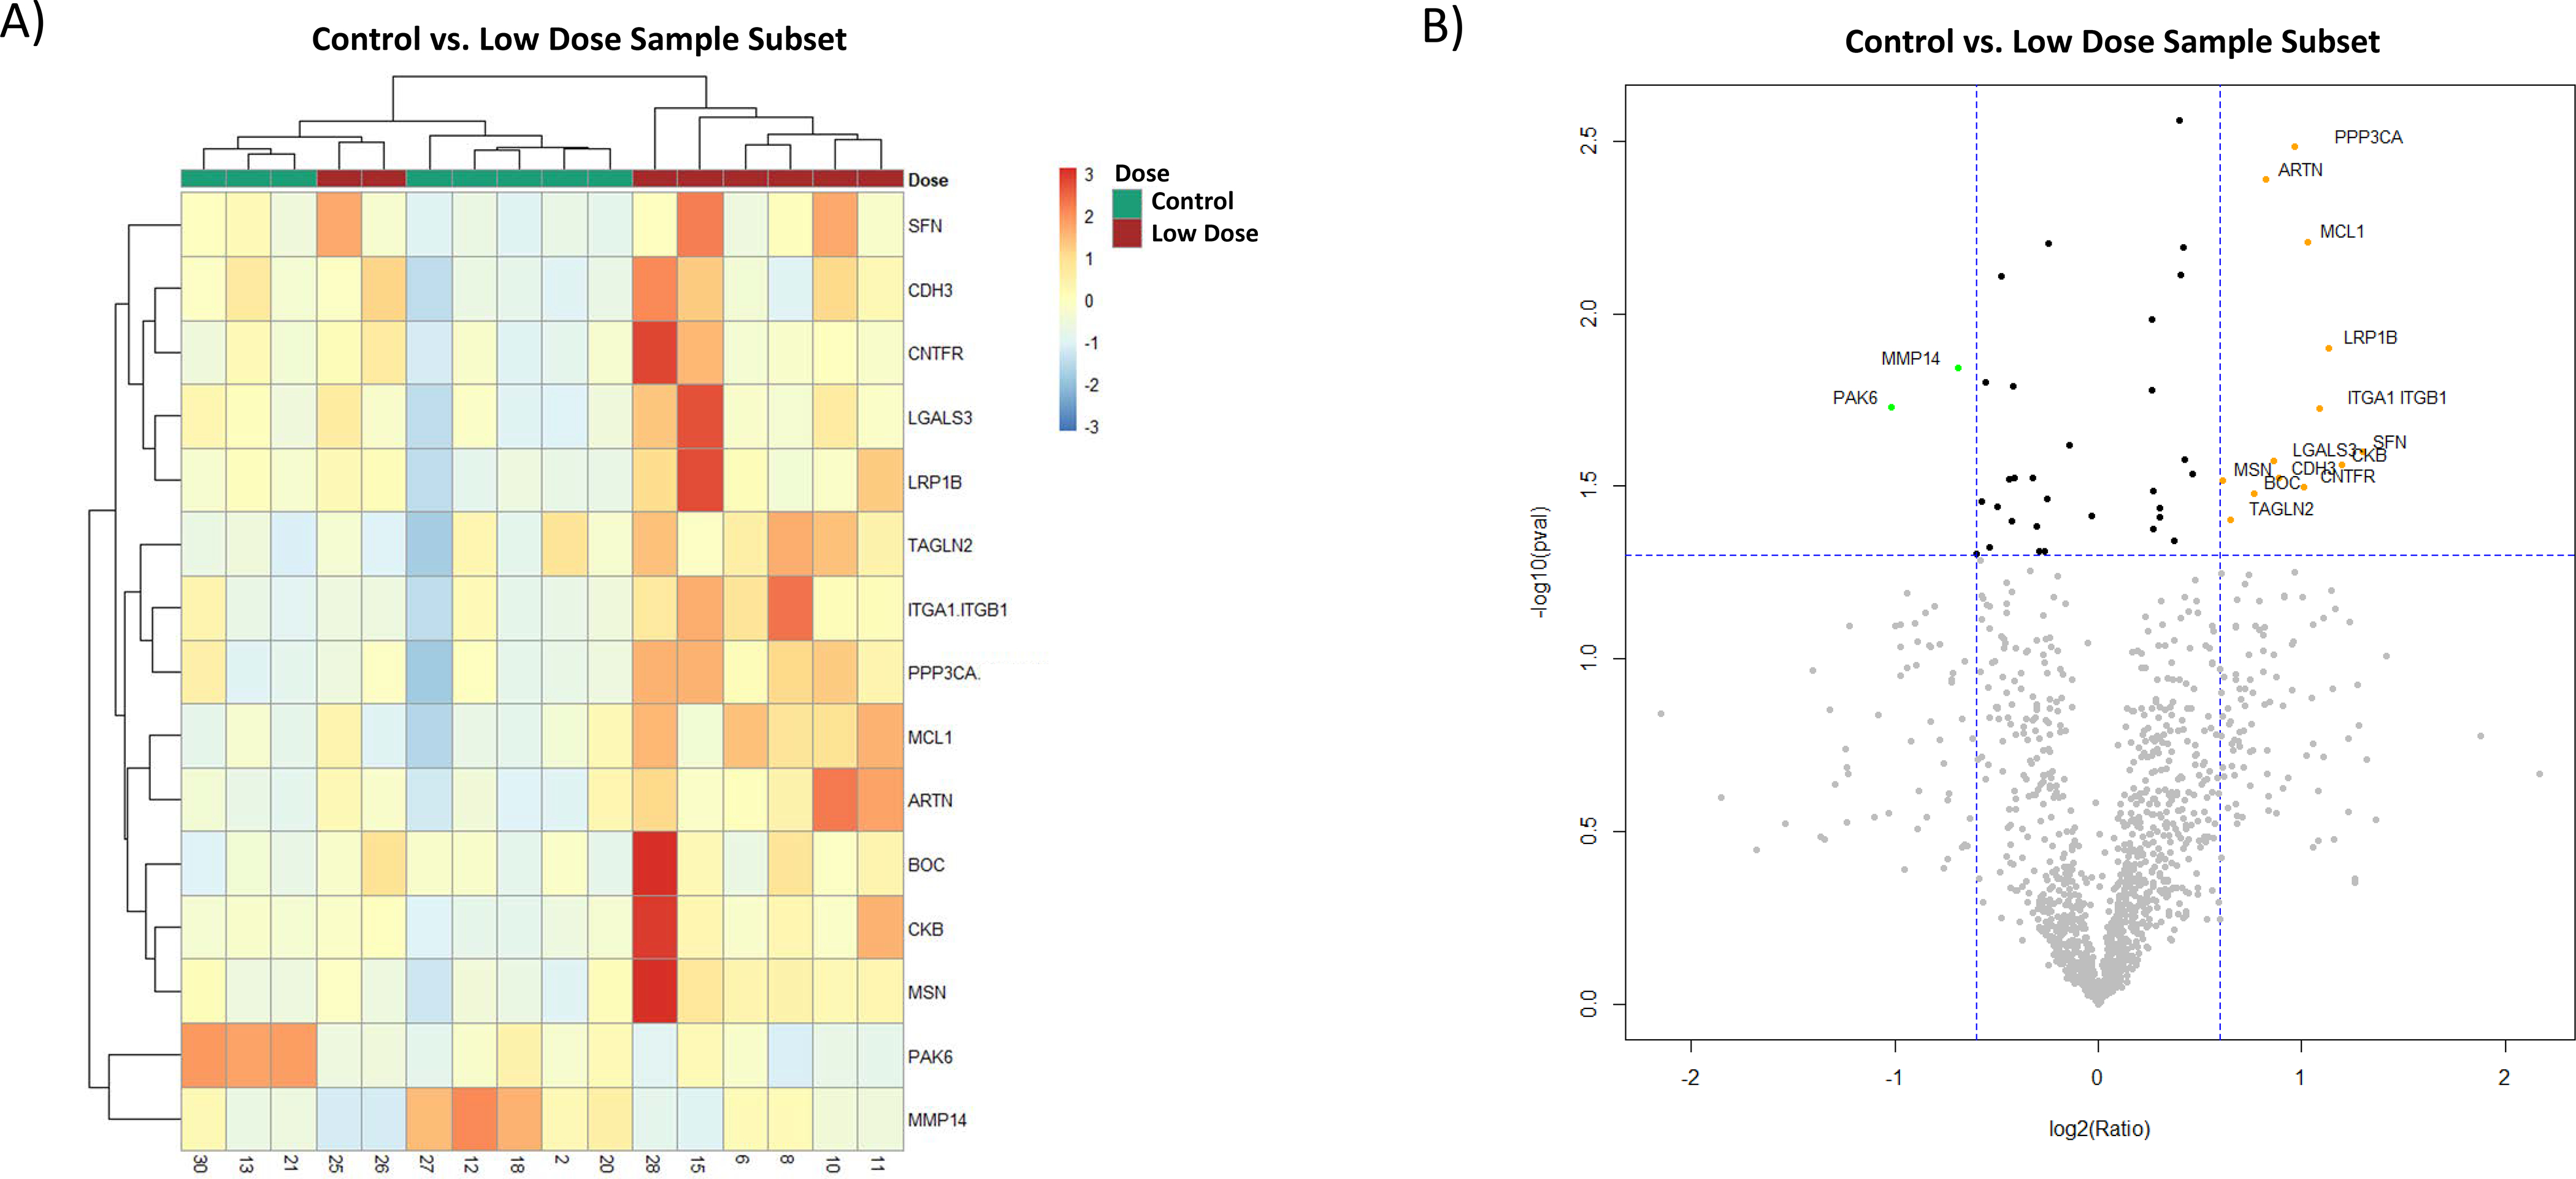
Analysis of proteomic expression within the Control vs. Low Dose sample subset cohorts. Findings are depicted by A) heatmap and B) Volcano plot. For the Volcano plot, the color green represents downregulation and orange upregulation of expression, the horizontal dotted line marks the p-value cutoff (p = 0.05), and vertical dotted lines are FC <1.5 and FC >1.5.
Though there was only a difference of the two “High” dose samples between the comparisons there were noticeable differences between the protein biomarker cohorts generated by each analysis. Figure 5 compares which proteins were held in common between the two analysis: Control vs. Exposed and Control vs. Low Dose sample subset. These findings are represented by Venn diagram (Figure 5A) and individual expression box plots depicting relative expression values for proteins exclusive to the Control vs. Low Dose subset (Figure 5B) and proteins exclusive to the Control vs. Exposed (Figure 5C). Only one protein was found to be exclusive to the Control vs. Low Dose analysis (Figure 5B), whereas 26 proteins were exclusive to the Control vs. Exposed analysis (Figure 5C) reflecting the significant effect of the addition of the (2) “High” dose samples to the cohort. 14 proteins were held in common between both analyses (Figure 5A).
Figure 5. Comparison of panels of differentially expressed proteins between all Exposed samples vs. Low Dose sample subset.
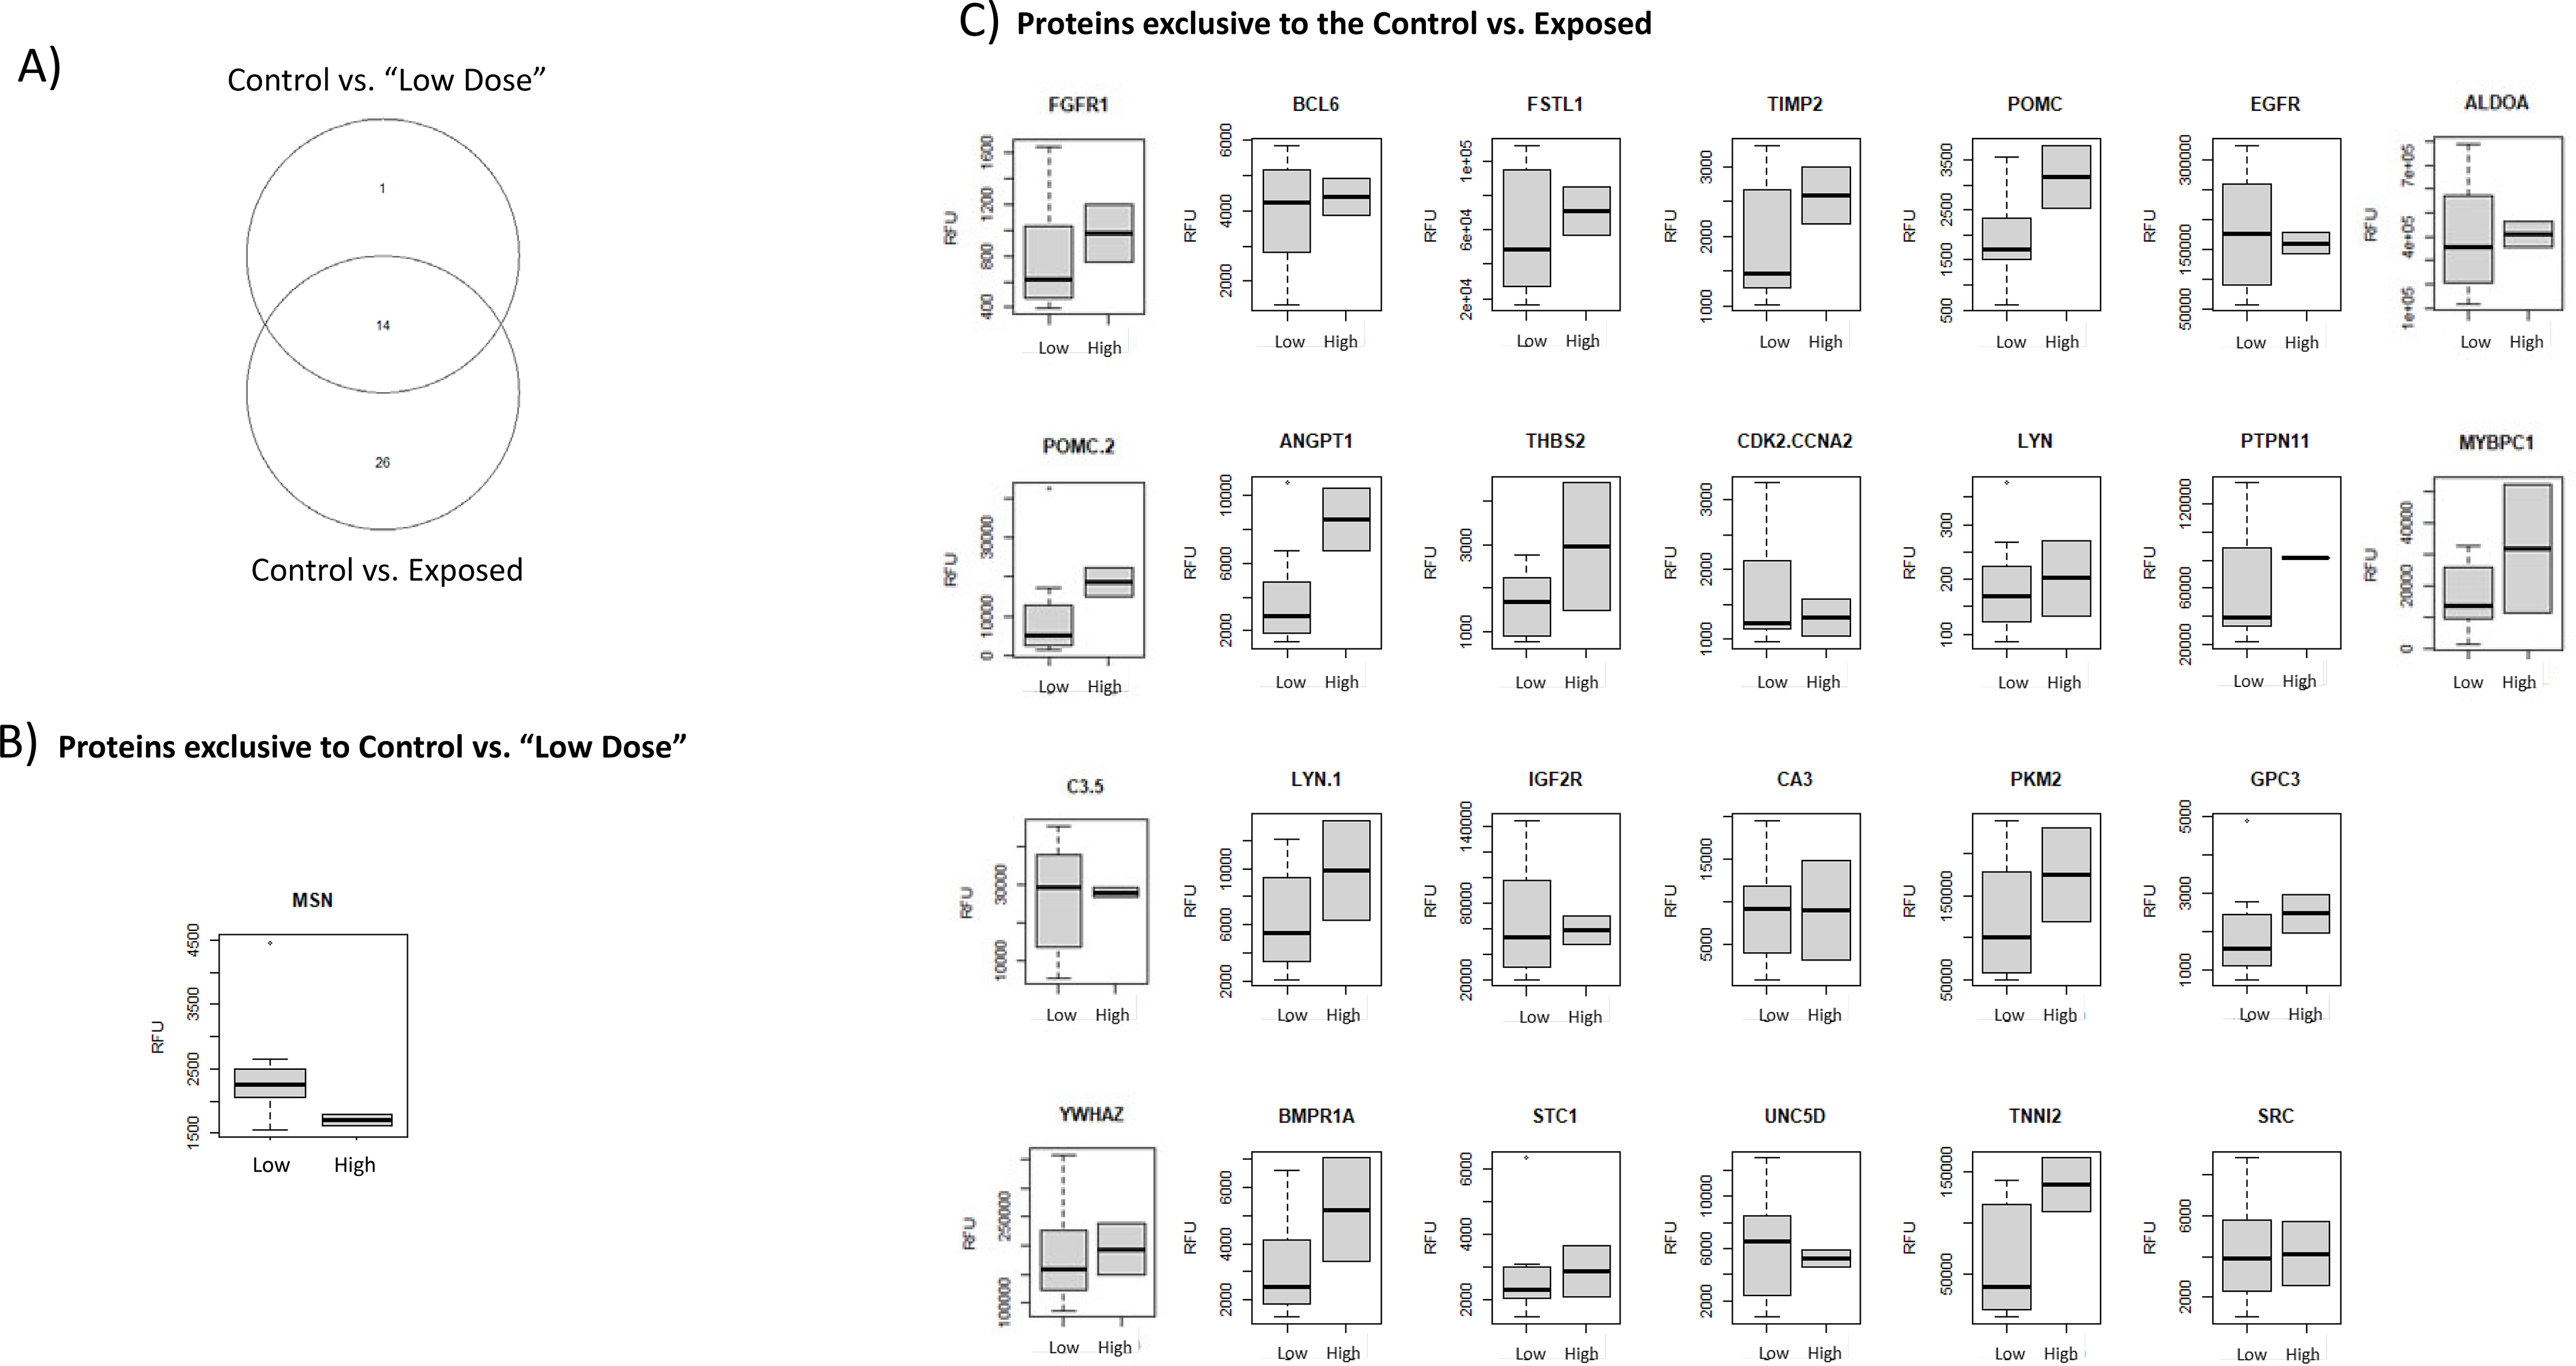
Depicts the differences between the biomarker panels for the Control vs. Exposed and Control vs. Low Dose sample subset. A) Venn diagram showing proteins held in common between the both analyses B) Depicts the single biomarker distinct to the Control vs. Low Dose sample subset C) Includes individual expression profiles for proteins exclusive to the Control vs. Exposed sample comparison. Box plots depict values in Relative Fluorescent Units (RFU) and compare the relative expression range of the low (Low Dose sample subset) to the “high” (High Dose samples) Both “low” and “high” dose samples were included in the “Exposed” sample cohort.
Finally, Ingenuity Pathway Analyses (IPA) was used to classify key pathways relevant to the significantly altered proteins identified in the Control vs. Exposed and Control vs. Low Dose sample subset analyses. Table 2 shows key pathways specific to the Control vs. Exposed analyses included developmental disorders, renal, urological and gastrointestinal disease. Pathways specific to the Control vs. Low Dose sample subset analysis included respiratory and dermatological disease and conditions. Common to both analyses were pathways related to cancer and organismal injury and abnormalities. These data collectively show significant changes in the mammalian blood proteome of large Japanese field mice receiving chronic environmental exposures to ionizing radiation within the Fukushima difficult to return zone.
Table 2. Ingenuity Pathway Analysis.
Summary of key pathways with altered expression in the Control vs. Exposed cohorts and the Control vs. Low Dose sample subset as determined by Ingenuity Pathway Analysis (IPA).
| Ingenuity Pathway Analysis | ||
|---|---|---|
| Top Diseases and BioFunctions: Diseases and Disorders | ||
| Control vs. Exposed | p value range | # Molecules |
| Cancer | 2.22E-02 – 5.80E-05 | 38 |
| Organismal Injury and Abnormalities | 2.22E-02 – 5.80E-05 | 38 |
| Developmental Disorder | 2.09E-02 – 2.10E-04 | 23 |
| Renal and Urological Disease | 2.07E-02 – 2.36E-04 | 20 |
| Gastrointestinal Disease | 2.22E-02 – 2.96E-04 | 34 |
| Control vs. Low Dose sample subset | ||
| Neurological Disease | 4.69E-02 – 7.87E-04 | 8 |
| Organismal Injury and Abnormalities | 4.78E-02 – 1.03E-03 | 15 |
| Respiratory Disease | 4.69E-02 – 1.94E-03 | 5 |
| Cancer | 4.71E-02 – 5.06E-03 | 15 |
| Dermatological Diseases and Conditions | 4.69E-02 –5.06E-03 | 7 |
Discussion:
Some of the most long lasting effects from the Great East Japan earthquake and resultant tsunami have been from the environmental consequences of radioactive contamination. Though the majority of the radionuclide plume resulting from the Fukushima Daiichi nuclear power plant disaster was deposited offshore within the Pacific ocean and effects of Fukushima derived nuclides have been detected within wildlife as far away as Alaska, the majority of wildlife affected by radionuclide uptake were endemic to Japan (Ruedig et al. 2016). 137Cs uptake has been detected in a variety of local mammalian species within the Fukushima difficult to return zone including Asian black bear, wild boars, Japanese macaques and numerous small mammals (Urushihara et al. 2018, Nemoto et al. 2018, Ishiniwa et al. 2019, Cui et al. 2020). Biological effects from this contamination have also been documented in the large Japanese field mouse and other small rodents. A significant increase in number of chromosomal aberrations correlative with accumulated received dose was found in both large Japanese field mice (Apodemus speciosus) and small Japanese field mice (Apodemus argenteus) collected within the difficult to return zone (Kubota et al. 2015, Kawagoshi et al. 2017). Other studies of the potential effects of radiation exposure on the large Japanese field mouse within the difficult to return zone found no significant increase in levels of DNA damage or inflammatory markers within the bone marrow but did find a decrease in colony forming potential in hematopoietic progenitor cells correlative with dose, and no effect from radiation exposure on spermatogenesis (Okano et al. 2016, Ariyoshi et al. 2020).
In our study, we sought to characterize changes in expression levels within the serum proteome of the large Japanese field mouse due to environmental radiation exposures. We identified a panel of significantly altered proteins in animals living within the difficult return zone and were also able to further differentiate this group of select proteins by dose. For this study we took advantage of the physiological pathway analysis platform, Ingenuity Pathway Analysis (Qiagen IPA), which utilizes a meta-analysis bioinformatics approach with a high level of computational power to characterize complex datasets. Using this form of analyses, identification of a panel of significantly altered genes or proteins can be used to characterize which major biological pathways are collectively represented by the panel. Our IPA findings, which highlighted changes in key injury pathways classically associated with radiation exposure including “organismal injury and abnormalities,” gastrointestinal disease,” and “cancer” validate our observed proteomic biomarker expression changes found within the blood of radiation exposed large Japanese field mice.
Detection of these changes in proteomic expression patterns illustrates the continuing effect of environmental radiation exposures on the endemic wildlife within the difficult to return zone and highlights potential impacts to the surrounding ecosystem. As other studies of the large Japanese field mice within the Fukushima difficult to return zone have demonstrated measurable biological changes due environmental exposure to radioactivity, our study complements these findings by illustrating changes within the blood proteome of other animals of the same species. This study also illustrates the feasibility of future similar studies leveraging highly multiplexed proteomics technologies to better characterize macro level changes in physiologic pathways in mammalian species due to environmental exposures to radiation. Finally, our findings supplement the growing body of literature documenting the biological effects of chronic environmental exposures to radioactivity in various mammalian species worldwide and betters our understanding of the environmental impact of contamination events involving radioactive materials.
Supplementary Material
Acknowledgments:
This research was supported in part by funding from the Radiation and Nuclear Countermeasures Program, #Y2-OD-0332-01 NIAID, the Intramural Research Program of the NIH, NCI, #ZIA SC 010373 and by the National Institute for Occupational Safety and Health (NIOSH) Mountain and Plains Education and Research Center, grant number 5T42OH009229. The content is the responsibility of the authors and does not necessarily represent the official views of the NIOSH. This research was also funded in part by a grant from the Japan Society for the Promotion of Science, grant number S18100. The authors would also like to thank the Center for Human Immunology at the Clinical Center at the National Institutes of Health and Brian Sellers for their invaluable scientific and technical assistance with the Somalogic SOMAscan platform.
References
- Amano Y The Fukushima Daiichi Accident. International Atomic Energy Agency. Vienna, Austria: 2015. [Google Scholar]
- Ariyoshi K, Miura T, Kasai K, Goh VST, Fujishima Y, Nakata A, et al. Environmental radiation on large Japanese field mice in Fukushima reduced colony forming potential in hematopoietic progenitor cells without inducing genomic instability. Int J Radiat Biol 1–12; 2020. [DOI] [PubMed] [Google Scholar]
- Boellner S, Becker K-F. Reverse Phase Protein Arrays-Quantitative Assessment of Multiple Biomarkers in Biopsies for Clinical Use. Microarrays (Basel) 4(2):98–114; 2015. [DOI] [PMC free article] [PubMed] [Google Scholar]
- Blakely WF, Bolduc DL, Debad J, Sigal G, Port M, Abend M, et al. Use of Proteomic and Hematology Biomarkers for Prediction of Hematopoietic Acute Radiation Syndrome Severity in Baboon Radiation Models. Health Phys 115(1); 2018. [DOI] [PubMed] [Google Scholar]
- Cui L, Orita M, Taira Y, Takamura N. Radiocesium concentrations in wild boars captured within 20 km of the Fukushima Daiichi Nuclear Power Plant. Sci Rep 10(1):9272; 2020. [DOI] [PMC free article] [PubMed] [Google Scholar]
- Fukushima Prefectural Government Japan. Transition of Evacuated Designation Zones 2019. URL http://www.pref.fukushima.lg.jp/site/portal-english/en03-08.html.
- Hikida T, Murakami O. Age determination of Japanese wood mouse, Apodemus speciosus. Japanese Journal of Ecology 30:109–16; 1980. [Google Scholar]
- Himburg HA, Sasine J, Yan X, Kan J, Dressman H, Chute JP. A Molecular Profile of the Endothelial Cell Response to Ionizing Radiation. Radiat Res 186(2):141–52; 2016. [DOI] [PMC free article] [PubMed] [Google Scholar]
- Holt M, Campbell RJ, Nikitin MB Fukushima Nuclear Disaster. Congressional Research Service. Report No. R41694; 2012. [Google Scholar]
- Ishiniwa H, Okano T, Yoshioka A, Tamaoki M, Yokohata Y, Shindo J, et al. Concentration of radioactive materials in small mammals collected from a restricted area in Fukushima, Japan since 2012. Ecol Res 34(1); 2019. DOI: 10.1111/1440-1703.1016. [DOI] [Google Scholar]
- Kawagoshi T, Shiomi N, Takahashi H, Watanabe Y, Fuma S, Doi K, et al. Chromosomal Aberrations in Large Japanese Field Mice (Apodemus speciosus) Captured near Fukushima Dai-ichi Nuclear Power Plant. Environ Sci Technol 51(8):4632–41; 2017. [DOI] [PubMed] [Google Scholar]
- Kuang Z, Huang R, Yang Z, Lv Z, Chen X, Xu F, et al. Quantitative screening of serum protein biomarkers by reverse phase protein arrays. Oncotarget 9(66):32624–41; 2018. [DOI] [PMC free article] [PubMed] [Google Scholar]
- Kubota Y, Tsuji H, Kawagoshi T, Shiomi N, Takahashi H, Watanabe Y, et al. Chromosomal Aberrations in Wild Mice Captured in Areas Differentially Contaminated by the Fukushima Dai-Ichi Nuclear Power Plant Accident. Environ Sci Technol 49(16):10074–83; 2015. [DOI] [PubMed] [Google Scholar]
- Mimura N, Yasuhara K, Kawagoe S, Yokoki H, Kazama S. Damage from the Great East Japan Earthquake and Tsunami - A quick report. Mitigation and Adaptation Strategies for Global Change 16(7):803–18; 2011. [Google Scholar]
- Nemoto Y, Saito R, Oomachi H. Seasonal variation of Cesium-137 concentration in Asian black bear (Ursus thibetanus) and wild boar (Sus scrofa) in Fukushima Prefecture, Japan. PLoS One 13(7); 2018. DOI: 10.1371/journal.pone.0200797. [DOI] [PMC free article] [PubMed] [Google Scholar]
- Norio O, Ye T, Kajitani Y, Shi P, Tatano H. The 2011 eastern Japan great earthquake disaster: Overview and comments. International Journal of Disaster Risk Science 2(1):34–42; 2011. [Google Scholar]
- Okano T, Ishiniwa H, Onuma M, Shindo J, Yokohata Y, Tamaoki M. Effects of environmental radiation on testes and spermatogenesis in wild large Japanese field mice (Apodemus speciosus) from Fukushima. Sci Rep 6(1):23601; 2016. [DOI] [PMC free article] [PubMed] [Google Scholar]
- Perri BJ, Johnson TE. Determination of Whole-Body and Lens Dose Conversion Factors for Japanese Field Mice, Apodemus Speciosus. Health Phys 116(5):577–81; 2019. [DOI] [PubMed] [Google Scholar]
- R Core Team. R: A language and environment for statistical computing. R Foundation for Statistical Computing, Vienna, Austria: 2018. URL https://www.R-project.org/. [Google Scholar]
- Rohloff JC, Gelinas AD, Jarvis TC, Ochsner UA, Schneider DJ, Gold L, et al. Nucleic Acid Ligands With Protein-like Side Chains: Modified Aptamers and Their Use as Diagnostic and Therapeutic Agents. Mol Ther Nucleic Acids. 3(10); 2014. DOI: 10.1038/mtna.2014.49. [DOI] [PMC free article] [PubMed] [Google Scholar]
- Ruedig E, Duncan C, Dickerson B, Williams M, Gelatt T, Bell J, et al. Fukushima derived radiocesium in subsistence-consumed northern fur seal and wild celery. J Environ Radioact 152:1–7; 2016. [DOI] [PubMed] [Google Scholar]
- Shioya K, Shiraishi S, Uchida T. Microhabitat Segregation between Apodemus argenteus and A. speciosus in Northern Kyushu. J Mammal Soc Jpn 14:105–18; 1990. [Google Scholar]
- SomaLogic SOMAscan Proteomic Assay: Technical White Paper DCN 15–310, SSM-002, Rev. 3. 2015. URL https://www.somalogic.com/wp-content/uploads/2016/08/SSM-002-Rev-3-SOMAscan-Technical-White-Paper.pdf
- Sproull M, Kramp T, Tandle A, Shankavaram U, Camphausen K. Multivariate Analysis of Radiation Responsive Proteins to Predict Radiation Exposure in Total-Body Irradiation and Partial-Body Irradiation Models. Radiat Res February;187(2):251–258; 2017. doi: 10.1667/RR14558.1 [DOI] [PMC free article] [PubMed] [Google Scholar]
- Steinhauser G, Brandl A, Johnson TE. Comparison of the Chernobyl and Fukushima nuclear accidents: A review of the environmental impacts. Sci Total Environ 470–471:800–17; 2014. [DOI] [PubMed] [Google Scholar]
- Urushihara Y, Suzuki T, Shimizu Y, Ohtaki M, Kuwahara Y, Suzuki M, et al. Haematological analysis of Japanese macaques (Macaca fuscata) in the area affected by the Fukushima Daiichi Nuclear Power Plant accident. Sci Rep 8(1):16748; 2018. [DOI] [PMC free article] [PubMed] [Google Scholar]
- US EPA Federal Guidance Report No. 15 (FGR 15), External Exposure to Radionuclides in Air, Water and Soil. Washington, D.C.; 2019. [Google Scholar]
- Yuta S, Mariko K, Masaharu M. Morphological Variation in External Traits of the Large Japanese Field Mouse, Apodemus speciosus. Mammal Study 37(2):113–26; 2012. [Google Scholar]
Associated Data
This section collects any data citations, data availability statements, or supplementary materials included in this article.