Abstract
The persistence of negative affect in pain leads to co-morbid symptoms such as anhedonia and depression — a major health issue in the US. The neuronal circuitry and contribution of specific cellular populations underlying these behavioral adaptations remains unknown. A common characteristic of negative affect is a decrease in motivation to initiate and complete goal-directed behavior, known as anhedonia. We report that in rodents, inflammatory pain decreased the activity of ventral tegmental area (VTA) dopamine (DA) neurons, which are critical mediators of motivational states. Pain increased RMTg inhibitory tone onto VTA DA neurons, making them less excitable. Furthermore, the decreased activity of DA neurons was associated with reduced motivation for natural rewards, consistent with anhedonia-like behavior. Selective activation of VTA DA neurons was sufficient to restore baseline motivation and hedonic responses to natural rewards. These findings reveal pain-induced adaptations within VTA DA neurons that underlie anhedonia-like behavior.
INTRODUCTION
Pain is a complex phenomenon composed of sensory and emotional-affective components.1,2 As pain persists, the presence of negative affective states can lead to the development of negative emotional states such as anhedonia, anxiety, and depression.3,4 While current pharmacological therapies provide high potency in alleviating sensory disturbances, the negative affective states accompanying pain remain undertreated.5 Emerging evidence from human and preclinical studies show deficits in emotional decision making, reward evaluation and reward seeking, or motivation in pain states.6–9 These deficits can lead to the development of anhedonia and depression.8–10 Uncovering the neuronal circuitry mediating these pain-induced negative affective states may provide opportunities to develop safer therapies for pain treatment and limit the development of co-morbid disorders.
The mesolimbic dopamine (DA) pathway, composed of DA input from the ventral tegmental area (VTA) projecting to the nucleus accumbens (NAc), has a prominent role in reward processing and motivated behavior.11–13 Neuroimaging studies have revealed that DA release and DA receptor activation are reduced in the NAc in patients experiencing pain.14–16 This is consistent with animal studies demonstrating a decrease in evoked DA release in the NAc in both inflammatory and neuropathic pain.17,18 Pain-induced negative affect is also associated with adaptations in the dynorphin neurons in the NAc, which are under potent control of DA release at the axon terminals.19 While these alterations in DA transmission may explain the impaired motivated responses to natural and drug rewards observed in rodents experiencing pain17,19,20, the exact mechanisms by which VTA DA neurons are mediating pain-induced adaptations in the mesolimbic pathway remain to be elucidated.
One of the main regulators of VTA DA neuron activity are inhibitory GABAergic inputs. These arise from the rostromedial tegmental nucleus (RMTg), NAc, ventral pallidum (VP), and bed nucleus of stria terminalis (BNST), among others, and they make up a majority of the synaptic input.21 RMTg GABAergic inputs are highly controlled by the opioid receptor system, which is downregulated in the presence of pain.17,21,22 Thus, the focus of this study was to assess the effects of pain on the VTA DA circuit dynamics and physiology, and investigate whether these changes lead to maladaptive decrease in motivation for natural rewards (a hallmark of anhedonia-like behavior) and the contribution of inhibitory RMTg GABAergic inputs in mediating these effects.
Using in vivo fiber photometry and ex vivo patch-clamp electrophysiology, we report that in rats the reduced motivation induced by pain is associated with decreased excitability and reduced activity of VTA DA neurons. This decreased excitability of VTA DA neurons is associated with increased inhibitory drive from GABAergic RMTg afferents. Furthermore, we report that chemogenetic activation of NAc-projecting DA neurons in the VTA is sufficient to overcome the pain-induced reduction in motivated behavior. We also demonstrate that pain is associated with decreased sucrose consumption that could be overcome by increasing the concentration of the sucrose reward, could be reversed by inhibition of RMTg GABAergic input onto VTA, and could be mimicked in naïve animals by chemogenetic stimulation of RMTg GABA neurons. Together, these results indicate that the experience of pain decreases activity and excitability of VTA DA neurons, which is partially driven by increased inhibitory drive from the RMTg; this blunted VTA DA activity then contributes to pain-induced negative affective states. Our findings represent a crucial step in understanding the neural mechanisms underlying the emotional component of pain and may provide novel targets for the treatment of pain-induced negative affect.
RESULTS
Pain suppresses VTA DA neuron activity and alters the dynamics of DA cell firing during motivated behavior.
To assess the effect of pain on the activity of VTA DA neurons during motivated behavior, we employed calcium imaging using in vivo fiber photometry during sucrose self-administration. A progressive ratio (PR) schedule of reinforcement for sucrose was used to assess rats’ motivation.23 During this test, the number of lever presses necessary to obtain the subsequent reward increases exponentially. Thus, the number of rewards obtained during the PR session provides a direct measure of animal’s motivational state.23,24
To selectively record DA neuron calcium transients during this task we injected a Cre-dependent calcium sensor (AAV-DJ-EF1a-DIO-GCaMP6s) and implanted an optic fiber in the VTA of rats expressing Cre recombinase in tyrosine hydroxylase positive (TH-Cre) neurons (Figure 1a, b and Extended figure 1a–c). Calcium transients from VTA infected cells were recorded during last day of each training session on fixed ratio (FR) schedules FR1, FR2, FR5 (1,2 and 5 lever presses respectively result in a reward delivery) and PR sessions (Figure 1 and Supplementary Figure 1). To assess the impact of pain on calcium transients of VTA DA neurons, animals received an intraplantar injection of either Complete Freund’s Adjuvant (CFA) as a model of inflammatory pain, or saline as a control following the baseline PR session (Figure 1a and Extended figure 2f, g).
Figure 1. CFA decreases frequency of VTA DA neuron calcium transients but amplifies phasic response to reward.
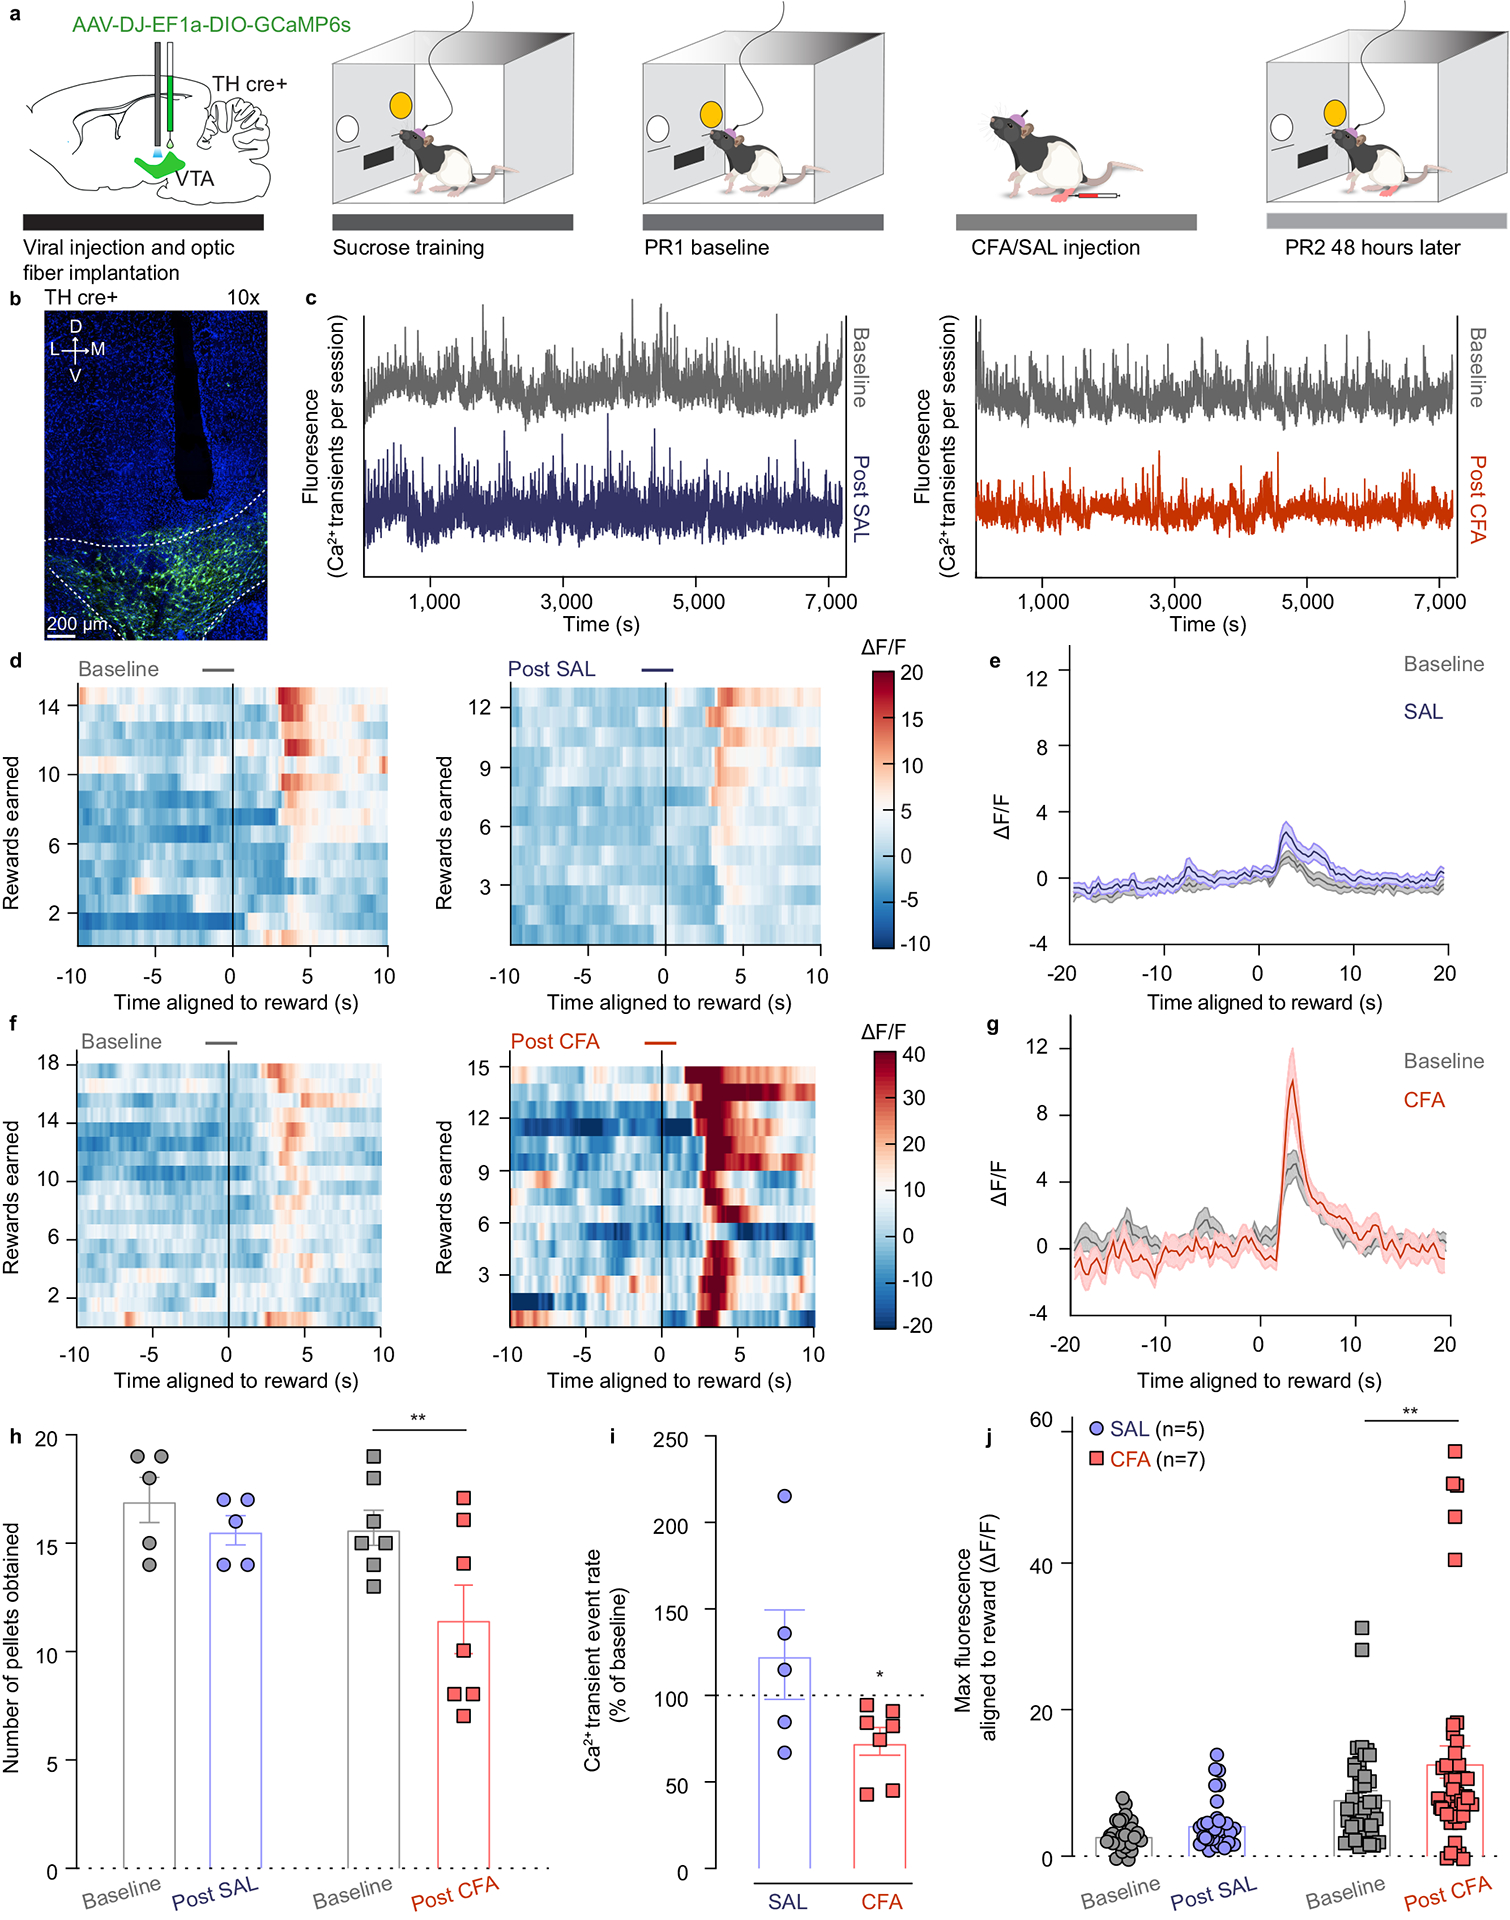
a. Schematic representation of viral injection and behavioral methodology. b. Representative image of optic fiber placement and GCaMP (green) expressing VTA DA neurons. c. Representative Ca2+ transients of the VTA DA neurons during the entire baseline (grey) and post-SAL (blue) / post-CFA (red) PR sessions of sucrose self-administration. d. Representative heat-maps of fluorescence aligned to the reward delivery (time point 0) for baseline and post-SAL PR sessions for same animal. e. Mean fluorescence aligned to reward delivery for baseline (grey) and post-SAL (blue) PR sessions (n = 5 rats; data presented as mean ± s.e.m.). f. Representative heat-maps of fluorescence aligned to the reward delivery (time point 0) for baseline and post-CFA PR sessions for same animal. g. Mean fluorescence aligned to reward delivery for baseline (grey) and post-CFA (red) PR sessions (n = 7 rats; data presented as mean ± s.e.m.). h. Pain decreases motivation for sucrose rewards (two-way ANOVA for repeated measures, time: F1, 10 = 16.08, p=0.0025; interaction (time × treatment): F1, 10 = 4.143, p=0.0692; Sidak’s post hoc between PR2 and PR21: CFA (n=7), ** p = 0.0017; n (CFA)= 7 rats; n (SAL) = 5 rats) i. Pain diminishes frequency of calcium transients of VTA DA neurons (two-tailed Wilcoxon test, * p = 0.0156; n (CFA) = 7 rats; n (SAL) = 5 rats). j. Maximum fluorescence following reward delivery (2–5 seconds after) is increased in the condition of pain (two-way ANOVA for repeated measures, time: F1, 10 = 8.520, p=0.0047; interaction (time × treatment): F1, 10 = 2.490, p=0.1191; Sidak’s post hoc between PR2 and PR1: CFA (n=7), ** p = 0.0017). The data are presented as the mean ± s.e.m.
The number of local maxima of DA calcium transients per minute (the frequency of DA transients) throughout an entire PR2 session was significantly decreased 48 hours after the CFA injection as compared to the baseline (Figure 1c, i and Extended figure 2j). These results indicate that pain diminishes overall frequency of calcium transients in VTA DA neurons during a motivational task, which coincides with decrease in motivation for natural rewards. Interestingly, the event rate in saline injected animals remained unchanged, suggesting that repeating the PR session does not alter overall frequency of VTA DA neurons transients (Figure 1c, i and Extended figure 2h).
As previously reported, CFA injection diminished motivation for sucrose rewards, which was measured as a decrease in the number of pellets obtained during the PR2 session (Figure 1h and Extended figure 2i, k). Importantly, DA activity during reward seeking behavior (VTA DA activity aligned to a correct lever press) was not significantly changed 48 hours after CFA nor saline injection as compared to the respective baseline session (Extended figure 2a–e). However, phasic DA activity associated with the reward delivery was significantly increased 48 hours after the administration of CFA relative to baseline (pre-CFA) recordings (Figure 1d–g, j). This finding suggests that pain enhances the phasic VTA DA neuron activity in response to a given reward.
To assess the persistence of pain effect on motivation and DA neuron activity, we tested the same parameters one week after the CFA injection. Interestingly, while CFA-induced hyperalgesia persisted at one week post the injection, animals’ motivation for sucrose rewards was restored (Supplementary Figure 2c, d, j). Consistent with this, overall VTA DA neuron calcium activity and phasic responses aligned to reward delivery were restored to baseline levels as well (Supplementary Figure 2a, b, e–i). This finding further supports the conclusion that reductions in spontaneous calcium activity in VTA DA neurons is tightly associated with the effects of pain on motivated behavior.
Pain decreases intrinsic excitability of VTA DA cells and increases inhibitory drive onto them.
To dissect the physiological mechanisms underlying the overall decrease in the frequency of VTA DA calcium transients during pain as described above, we used ex vivo patch-clamp recordings from CFA− and saline-injected rats (Figure 2a). VTA DA neurons were identified by a cellular capacitance > 30 pF, spontaneous firing below 5 Hz and the presence of a hyperpolarization-activated cation current, Ih (Figure 2a).25,26 We found that the resting membrane potential (RMP) of DA neurons was lower in slices from CFA as compared to saline injected controls, making VTA DA cells hyperpolarized in the CFA group (Figure 2b and Extended figure 3b). We assessed the contribution of inhibitory inputs to this decrease in excitability, by bath applying the GABAA receptor antagonist picrotoxin (PTX) onto the slice. While the application of PTX had negligible effect on the control saline group, it depolarized the VTA DA cells from the CFA group to levels comparable to saline animals (Figure 2b and Extended figure 3b). In addition, we found that the rheobase, calculated by injecting a ramp of current to determine the minimum amount of current required to generate an action potential, was significantly higher in CFA injected animals (Figure 2c and Extended figure 3c). This effect was also abolished upon the application of PTX (Figure 2c and Extended figure 3c). Given that there was no effect of either CFA or PTX on action potential threshold (Extended figure 3a), this suggests that VTA DA neurons from CFA injected rats receive higher GABAergic inhibition, resulting in hyperpolarization and greater current required to reach action potential threshold. We further characterized the intrinsic excitability of VTA DA neurons by examining the input-output curves from CFA and saline injected animals. Input-output curves were generated with 200 ms current steps injected in increments of 10 pA from 0 to 200 pA. Input resistance was not affected by CFA, and while PTX application slightly increased input resistance in CFA treated animals (Figure 2d and Extended figure3 d), the input-output curve was not impacted by CFA or the application of PTX, as no groups demonstrated significant difference at any current steps (Figure 2g, h). Moreover, the spontaneous firing rate of VTA DA neurons was not significantly lower in CFA− relative to saline-injected mice, and this was not affected by application of PTX (Figure 2e, f). Taken together, our results demonstrate that while lower intrinsic excitability of VTA DA neuron in pain is mediated through increased GABAergic drive, the lack of effect of PTX on the spontaneous activity of DA cells in pain suggests that additional, GABA-independent, presumably cell-autonomous adaptations also contribute to this decrease in spontaneous activity ex vivo.
Figure 2. VTA DA cells are hyperpolarized in CFA injected animals, exhibiting decreased intrinsic excitability, and increased inhibitory drive onto them.
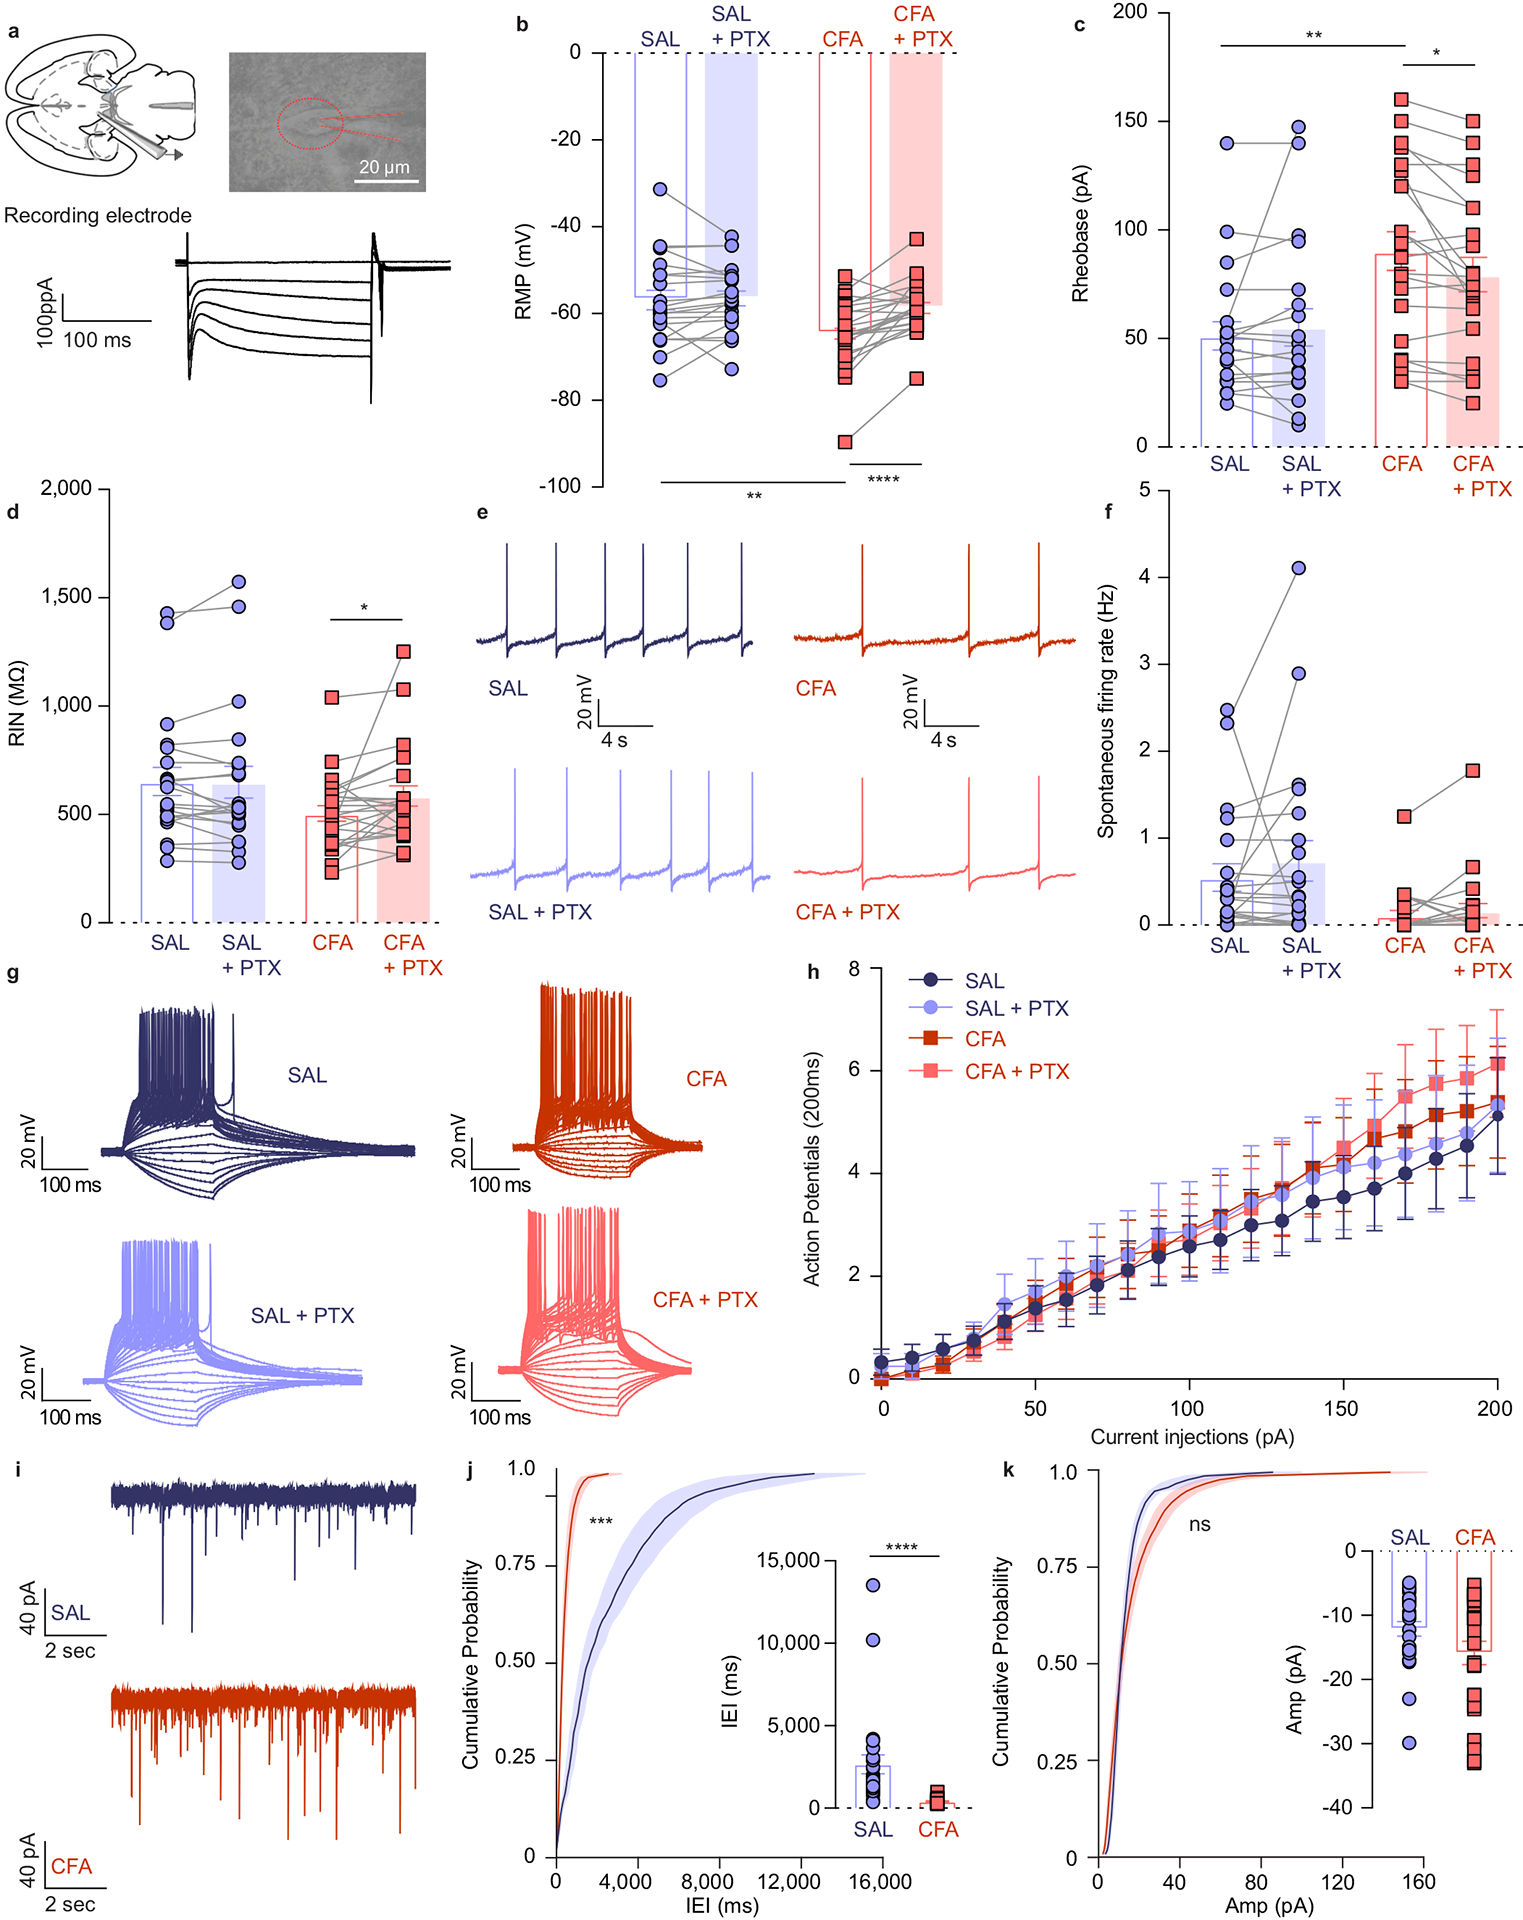
a. Representative picture of a patch pipette onto the soma of a VTA DA neuron. Identification of DA neurons by the presence of large hyperpolarization-activated inward current, Ih. b. Resting membrane potential (RMP) is lower in CFA group. Application of PTX restores RMP to the level of saline injected animals (two-way ANOVA for repeated measures, treatment (PTX): F1, 42 = 13.36, p=0.0007; interaction (treatment (PTX) × treatment (CFA/SAL)) : F1, 42 = 10.50, p=0.0023; Sidak’s post hoc between CFA and SAL: ** p = 0.0046 at baseline, Sidak’s post hoc between PTX and baseline: CFA,**** p < 0.0001, n (SAL) = 21 cells from 5 rats, n (CFA) = 23 cells from 4 rats). c. Amount of current necessary to evoke first action potential is higher in CFA treated rats. This effect is eliminated upon application of PTX (two-way ANOVA for repeated measures, treatment (PTX): F1, 40 = 1.327, p=0.2562; interaction (treatment (PTX) × treatment (CFA/SAL)): F1, 40 = 6.113, p=0.0178; Sidak’s post hoc between CFA and SAL: ** p = 0.0021 at baseline, Sidak’s post hoc between PTX and baseline: CFA, * p = 0.0242, n (SAL) = 20 cells from 5 rats, n (CFA) = 23 cells from 4 rats). d. CFA does not alter input resistance, while application of PTX increases input resistance in the CFA treated animals (two-way ANOVA for repeated measures, treatment (PTX): F1, 42 = 3.037, p=0.0887; interaction (treatment (PTX) × treatment (CFA/SAL)): F1, 42 = 3.520, p=0.0676; Sidak’s post hoc between PTX and baseline: CFA, * p = 0.0243, n (SAL) = 21 cells from 5 rats, n (CFA) = 23 cells from 4 rats). e. Representative traces of spontaneous activity. f. Spontaneous firing rate of VTA DA neurons is not significantly altered in pain (n (SAL) = 21 cells from 5 rats, n (CFA) = 23 cells from 4 rats). g. Representative input-output traces. h. The input-output curve of neuronal excitability is not altered by pain or PTX (n (SAL) = 12 cells from 5 rats, n (CFA) = 14 cells from 4 rats). i. Representative traces of spontaneous IPSCs. j. Frequency of sIPSCs is increased in condition of pain which as in indicative of increased inhibitory drive onto VTA DA neurons (distribution of cumulative probability for IEI represented as mean ± s.e.m.: Kolmorogov-Smirnov test = 4.925, *** p=0.001; mean IEI: **** p < 0.0001, two-tailed Mann Whitney test, n (SAL) = 27 from 5 rats, n (CFA) = 25 from 5 rats). k. Mean amplitude of sIPSCs is not altered by pain (distribution of cumulative probability for Amp represented as mean ± s.e.m.: Kolmorogov-Smirnov test = 1.196, p = 0.114 – not significant; mean Amp: p = 0.159 – not significant, two-tailed Mann Whitney test, (n (SAL) = 27 from 5 rats, n (CFA) = 25 from 5 rats). The data are presented as the mean ± s.e.m.
To directly test the hypothesis that inhibitory drive is increased onto VTA DA neurons following pain induction, we next measured the spontaneous inhibitory postsynaptic currents (sIPSC), which reflect spontaneous neurotransmitter release. We found that the distribution of interevent interval (IEI) of sIPSCs, but not the amplitude, was significantly decreased in slices from CFA treated rats (Figure 2i–k). This CFA-induced increase in the frequency of spontaneous inhibitory events suggests enhanced pre-synaptic release, further supporting the conclusion that inhibitory drive onto VTA DA neurons is increased in pain (Figure 2j).
The electrophysiological changes found at the soma regions of VTA DA neurons indicate decreased activity after the induction of inflammatory pain. These VTA DA neurons send long axonal projections that innervate the NAc shell regions and release DA. DA transmission in the NAc shell is known to be determined by the local synaptic properties, in addition to somatic activity of DA neurons.27 Thus, we next examined whether pain induces changes to the properties of DA release in NAcSh using fast-scanning cyclic voltammetry (FSCV) to record ex vivo evoked DA transients from mouse brain slices 48 hours after CFA or saline injection. DA transients were evoked using both electrical and optogenetic approach.
We found a small decrease in the amplitude of the evoked transients in the CFA-injected mice at submaximal stimulations (Supplementary figure 3c), indicative of a small impairment in the ability to electrically evoke DA release at the synaptic terminal following the induction of pain. However, other properties of DA release remain largely unaffected by pain (Supplementary figure 3a–b, d–j).
Taken together, these findings reveal that increased GABAergic inhibition following CFA-treatment contributes to decreased excitability of VTA DA neurons while the properties of the DA release in the NAcSh projection site are unaffected by CFA injection.
Chemogenetic activation of VTA-NAc projecting DA neurons is sufficient to reverse pain-induced decrease in motivation.
Our photometry data indicates that pain-induced impairment in VTA DA cell activity occurs in parallel with a decrease in motivation for sucrose rewards. Thus, we hypothesized that in vivo activation of VTA DA neurons would be sufficient to reverse pain-induced deficits in motivated behavior. To investigate this, we utilized chemogenetics in combination with PR sucrose self-administration. To selectively activate VTA DA neurons we bilaterally injected Cre-dependent excitatory Designer Receptors Exclusively Activated by Designer Drugs (DREADDs) (AAV5-hSyn-DIO-hM3D(Gq)-m-Cherry) or control virus (AAV5-Ef1a-DIO-m-Cherry) in the VTA of TH-Cre rats (Figure 3a, b, Extended figure 4c and Extended figure 5a).
Figure 3. Chemogenetic activation of VTA DA neurons, or VTA-NAc pathway, reverses CFA induced decrease in motivation.
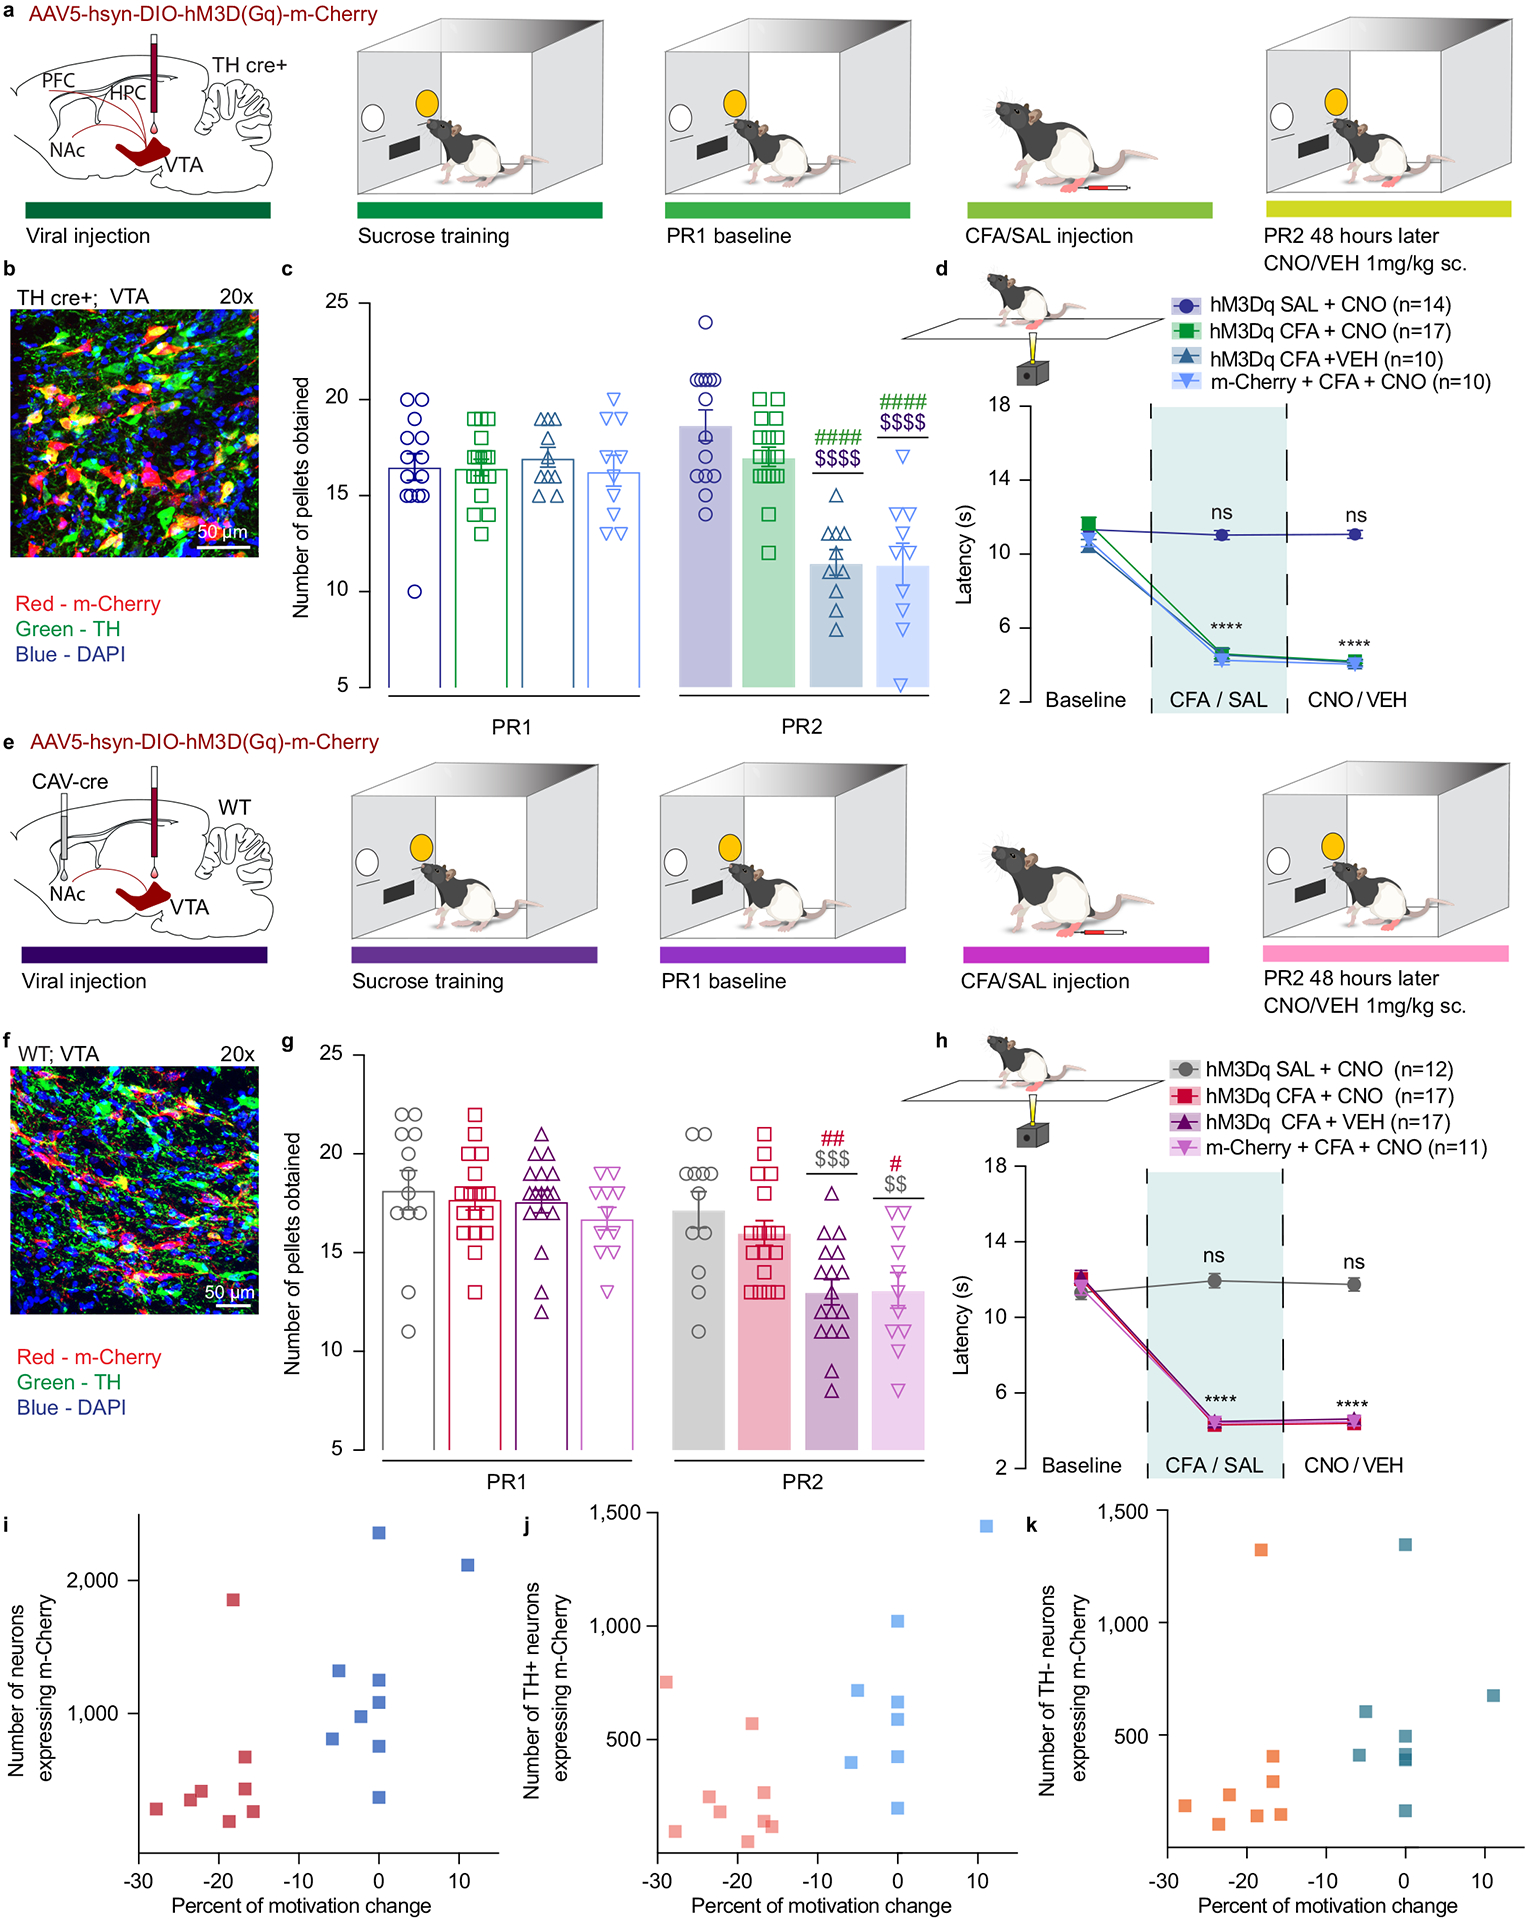
a. Schematic representation of viral injection and behavioral methodology. b. Representative coronal section of VTA Gq DREADD expressing neurons. Blue – DAPI; Red – m-Cherry (Gq DREADD); Green – TH (DA neurons). c. Activation of DA containing neurons in the VTA reverses CFA induced decrease in motivation for sucrose pellets. Animals injected with control virus and CNO alone showed decrease in motivation after the CFA injection (two-way ANOVA for repeated measures, time: F1, 47 = 46.35, p<0.0001; interaction (time × treatment): F3, 47 = 45.18, p<0.0001; Sidak’s post hoc between groups during PR2: hM3Dq + CFA + VEH (n=10) versus hM3Dq + SAL+ CNO (n=14), $$$$ p<0.0001, hM3Dq + CFA + VEH versus hM3Dq + CFA+ CNO (n=17), #### p<0.0001; m-Cherry + CFA + CNO (n=10) versus hM3Dq + SAL+ CNO, $$$$ p<0.0001, m-Cherry + CFA + CNO versus hM3Dq + CFA+ CNO, #### p<0.0001). d. CFA induced hyperalgesia is not altered by activation of DA containing neurons in the VTA (two-way ANOVA for repeated measures, time: F2, 94 = 507.2, p<0.0001; interaction (time × treatment): F6, 94 = 59.72, p<0.0001; Sidak’s post hoc for each group as compared to the group’s baseline session: **** p<0.0001). e. Schematic representation of viral injection and behavioral methodology. f. Representative coronal section of VTA Gq DREADD expressing neurons. Blue – DAPI; Red – m-Cherry (Gq DREADD); Green – TH (DA neurons). g. Activation of NAcSh projecting VTA neurons restores motivation in CFA treated aniamls. Control CFA animals injected with either CNO or virus alone show decrease in motivation (two-way ANOVA for repeated measures, time: F1, 53 = 148.4, p<0.0001; interaction (time × treatment): F3, 53 = 14.66, p<0.0001; Sidak’s post hoc during PR2 between the groups: hM3Dq + CFA + VEH (n=17) versus hM3Dq + SAL+ CNO (n=12), $$$ p=0.0004, hM3Dq + CFA + VEH versus hM3Dq + CFA + CNO (n=17), ## p=0.0085; m-Cherry + CFA + CNO (n=11) versus hM3Dq + SAL+ CNO, $$ p=0.0024, m-Cherry + CFA + CNO versus hM3Dq + CFA + CNO, # p=0.0344). h. CFA-induced hyperalgesia is not altered by activation of VTA-NAc pathway. (two-way ANOVA for repeated measures, time: F2, 106 = 597.4, p<0.0001; interaction (time × treatment): F6, 106 = 74.90, p<0.0001; Sidak’s post hoc for each group as compared to the group’s baseline session: **** p<0.0001). i–k. Bimodal distribution of the animal’s performance during second PR session is observed in hM3Dq + CFA + CNO test group (p=0.0312, Hartigan dip test, number of shuffles 20 000). The percent of motivation change is corelated with the infection rate of the virus. (total number of VTA-NAc m-Cherry expressing neurons r=0.6292, p=0.0068, n=17 rats, Spearman correlation test; the number VTA-NAc m-Cherry expressing neurons positive for TH r=0.7446, p=0.0006, n=17 rats, Spearman correlation test; number of m-Cherry expressing TH negative neurons r=0.539, p=0.0256, n=17 rats, Spearman correlation test). The data are presented as the mean ± s.e.m.
First, we assessed whether CNO application led to an increase in DREADD expressing DA neurons activation using cFos expression as a proxy for neuronal activation. We demonstrated that both control and DREADD viral expression were highly restricted to TH positive (DA) neurons in the VTA (Supplementary figure 4a, b). Moreover, we observed that around 70% of TH positive neurons expressing DREADDs were co-labeled with cFos, while control groups showed a significantly lower co-labeling and overall expression of cFos (Supplementary figure 4c). This result further substantiates the high selectivity for DREADD expressing neuronal activation upon CNO administration.
Utilizing this approach, we found that activation of DREADD-expressing DA neurons, via subcutaneous (s.c.) injection of CNO (1mg.kg−1) during PR2 session, was sufficient to reverse CFA-induced decrease in motivation for the self-administration of sucrose pellets as shown by no difference between CFA or SAL injected animal upon chemogenetic activation of VTA DA cells (Figure 3c). Importantly, CFA control groups injected with DREADD virus or CNO alone, demonstrated a decrease in motivation for sucrose pellets on the second PR test as measured by decreases in the number of pellets obtained, confirming that the observed restoration of motivation is tightly associated with VTA DA neuron activation (Figure 3c and Extended figure 4a). Additionally, chemogenetic activation of VTA DA neurons increased the motivation for sucrose pellets in saline injected animals as shown by the increase in number of the rewards obtained during PR2 task as compared to the baseline sessions which has been previously reported.28 Moreover, the restoration of motivation in CFA injected animals does not appear to be mediated through an overall increase in locomotor activity, as locomotion was only increased in saline animals upon DREADDs activation, but not in CFA treated animals (Supplementary figure 5a–c).
The VTA to NAc mesolimbic pathway is a key circuit encoding motivational processes11,12,29, with NAc shell (NAcSh) mediating both aversive stimuli such as pain as well as motivational salience.19,27,30 Thus we next investigated whether activation of VTA neurons projecting to NAcSh would be sufficient to reverse the pain-induced decrease in motivation for sucrose. Wild type rats were injected with a retrograde canine adenovirus carrying Cre recombinase (CAV2-Cre)31 in the NAcSh and a Cre-dependent excitatory DREADDs (AAV5-hSyn-DIO-hM3D(Gq)-m-Cherry), or a control virus (AAV5-Ef1a-DIO-m-Cherry) in the VTA (Figure 3e, f, Extended figure 4d and Extended figure 5b). Chemogenetic activation of VTA to NAcSh projection neurons was sufficient to reverse CFA-induced decrease in rewards obtained during the PR2 task, whereas it had no effect in control (saline) animals (Figure 3g and Extended figure 4b). Furthermore, we observed a significant bimodal distribution of the animal performance during the PR2 session in CFA group, with a cluster of animals whose motivation was decreased and a cluster of animals with minimal change in motivation (Figure 3i–k and Extended figure 4 e). Importantly, the percent of motivation change was correlated with the infection rate of the virus (Figure 3i–k).
Since previous work has demonstrated that pain relief induced by local anesthetic enhances DA transmission in the VTA to NAcSh pathway32, we next assessed whether our chemogenetic approaches produced analgesia and could thereby have restored motivation for sucrose seeking. Thus, we measured thermal hyperalgesia using the Hargreaves test. Neither general enhancement of the VTA DA neurons, or selective activation of VTA-NAcSh pathway reversed CFA-induced hyperalgesia (Figure 3d, h). Together, these results indicate that selective activation of mesolimbic VTA-NAc pathway or VTA DA neurons is sufficient to reverse the observed pain-induced decrease in motivated behavior without impacting the sensory component of inflammatory pain.
Lastly, to assess whether increasing activity of DA neurons within VTA-NAcSh pathway specifically restores motivation in condition of pain we bilaterally injected Cre-dependent excitatory DREADDs (AAV5-hSyn-DIO-hM3D(Gq)-m-Cherry) or control virus (AAV5-Ef1a-DIO-m-Cherry) in the VTA of TH-Cre rats and implanted intra – NAcSh cannula for the microinjection of 1mM of CNO or aCSF (Figure 4a, b and Extended figure 6b,c). Chemogenetic enhancement of NAcSh projecting VTA DA terminals reversed CFA-induced decrease in motivation for sucrose rewards without altering CFA-induced hyperalgesia (Figure 4c, d and Extended figure 6a), whereas it had no effect in control (saline) rats. This finding further strengthens the hypothesis that restoring DA neurotransmission selectively within the NAcSh is necessary to restore motivation for sucrose following CFA treatment.
Figure 4. Chemogenetic activation of NAcSh projecting VTA DA neurons mitigates the effect of CFA on motivated behavior.
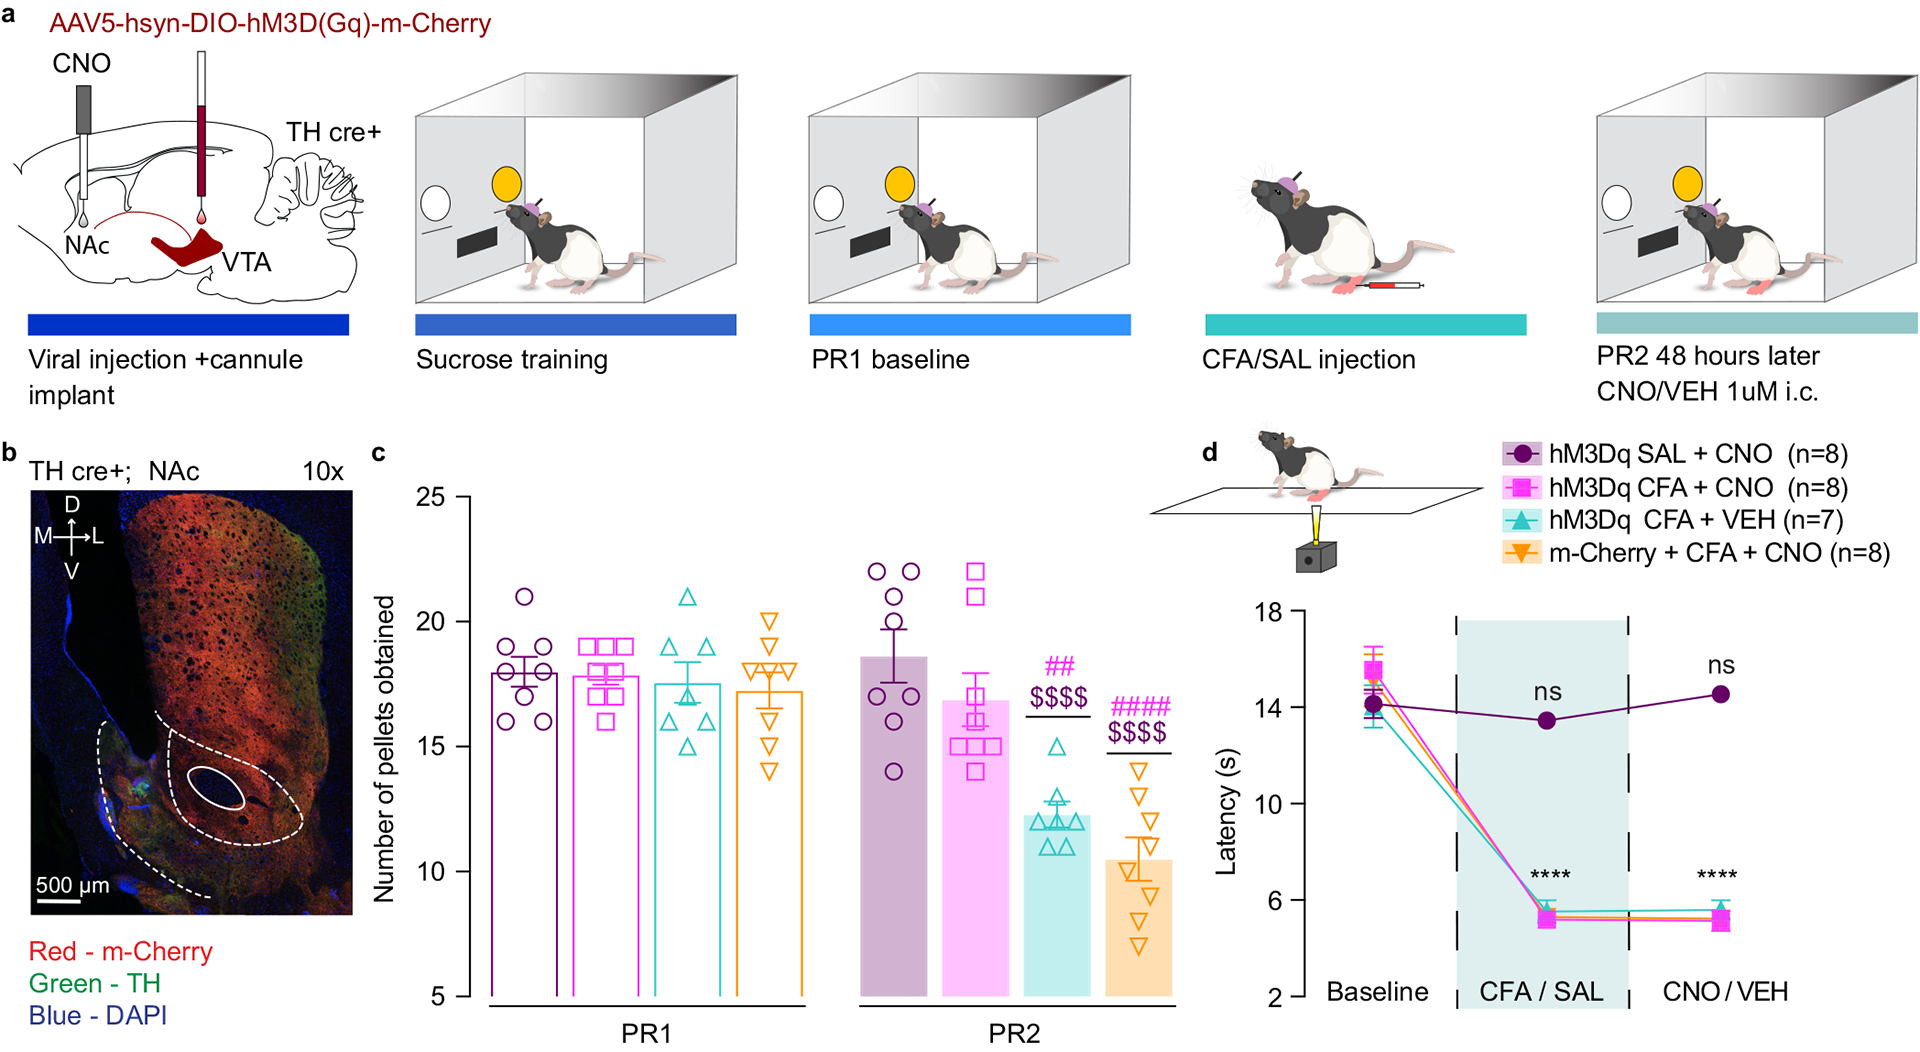
a. Schematic representation of viral injection and behavioral methodology. b. Representative coronal section of NAcSh cannula placement and terminal expression of DREADDs injected in the VTA of TH-cre rats. Blue – DAPI; Red – m-Cherry (Gq DREADD); Green – TH (DA neuron terminals). c. Chemogenetic enhancement of VTA-NAcSh projecting DA neurons reverses CFA induced decrease in motivation (two-way ANOVA for repeated measures, time: F1, 27 = 53.97, p<0.0001; interaction (time × treatment): F3, 27 = 17.31, p<0.0001; Sidak’s post hoc during PR2 between the groups: hM3Dq + CFA + VEH (n=7) versus hM3Dq + SAL+ CNO (n=8), $$$$ p<0.0001, hM3Dq + CFA + VEH versus hM3Dq + CFA+ CNO (n=8), ## p = 0.0012; m-Cherry + CFA + CNO (n=8) versus hM3Dq + SAL+ CNO, $$$$ p<0.0001, m-Cherry + CFA + CNO versus hM3Dq + CFA+ CNO, #### p<0.0001). d. Chemogenetic enhancement of VTA-NAcSh projecting DA neurons does not alter CFA induced hyperalgesia (two-way ANOVA for repeated measures, time: F2, 54 = 233.9, p<0.0001; interaction (time × treatment): F6, 54 = 26.38, p<0.0001; Sidak’s post hoc for each group as compared to the group’s baseline session: **** p<0.0001). The data are presented as the mean ± s.e.m.
Increasing the hedonic value of natural reward overcomes the effects of pain on sucrose consumption.
We previously demonstrated that pain induces a rightward shift in the opioid dose response, suggesting an impairment in rewarding properties of opioid drugs.17 Therefore, we next examined whether pain also alters rewarding properties for natural (in this case, sucrose) rewards. We employed a two-bottle choice paradigm in which an animal can freely choose between water or a sucrose solution for one hour.33 This paradigm enabled us to investigate the effect of pain on reward consumption, where we could alter the hedonic value of the reward by using escalating concentrations of sucrose in separate testing sessions. To assure that sucrose concentrations used in the two-bottle choice were not perceived as aversive, we measured orofacial reactivity such as consummatory protrusions and hedonic licks for 5%, 30% and 60% sucrose in naïve animals (Extended figure 7a and Supplementary Video 1,2). We found that 5% and 30% sucrose significantly increased consummatory protrusions as compared to water, whereas this was not significant for the 60% sucrose solution (Extended figure 7a). In addition, 60% sucrose elicited exaggerated swallowing, possibly due to the increased viscosity of the solution. This behavior is easily distinguishable from aversive gapes induced by quinine as presented in the supplementary videos (Supplementary Video 1,2,3). This data demonstrates that the concentrations used in two-bottle choice experiments are not aversive and produce similar orofacial responses.
CFA and saline injected animals underwent four days of habituation during which they were simultaneously exposed to a 5% sucrose solution and a water bottle (Figure 5a). Then, a baseline test was performed in which sucrose (5%, 30% or 60%) and water volume consumed were recorded. Subsequently, CFA or saline was injected into rat’s hindpaw and a second two-bottle choice test was performed 48 hours later (Figure 5a). We found that animals in the CFA group decreased their voluntary consumption of 5% and 30% sucrose solution relative to the baseline test, whereas control saline-injected animals did not (Figure 5b, c, e). The amount of water consumed was unchanged between the experimental groups, indicating that the observed changes in drinking behavior are specific to the sucrose consumption and reflect an impairment in perceived hedonic value of sucrose reward in pain (Extended figure 7b, c, d). Furthermore, there was no significant difference in sucrose consumption between CFA and saline injected animals when the concentration was increased to 60% (Figure5 d, e). These data indicate that pain alters rewarding properties only for lower reward values but does not impact reward consumption when the sucrose value is increased, indicating a rightward shift in the hedonic value of sucrose.
Figure 5. Increasing the concentration of sucrose reward overcomes the effects of CFA on sucrose consumption.
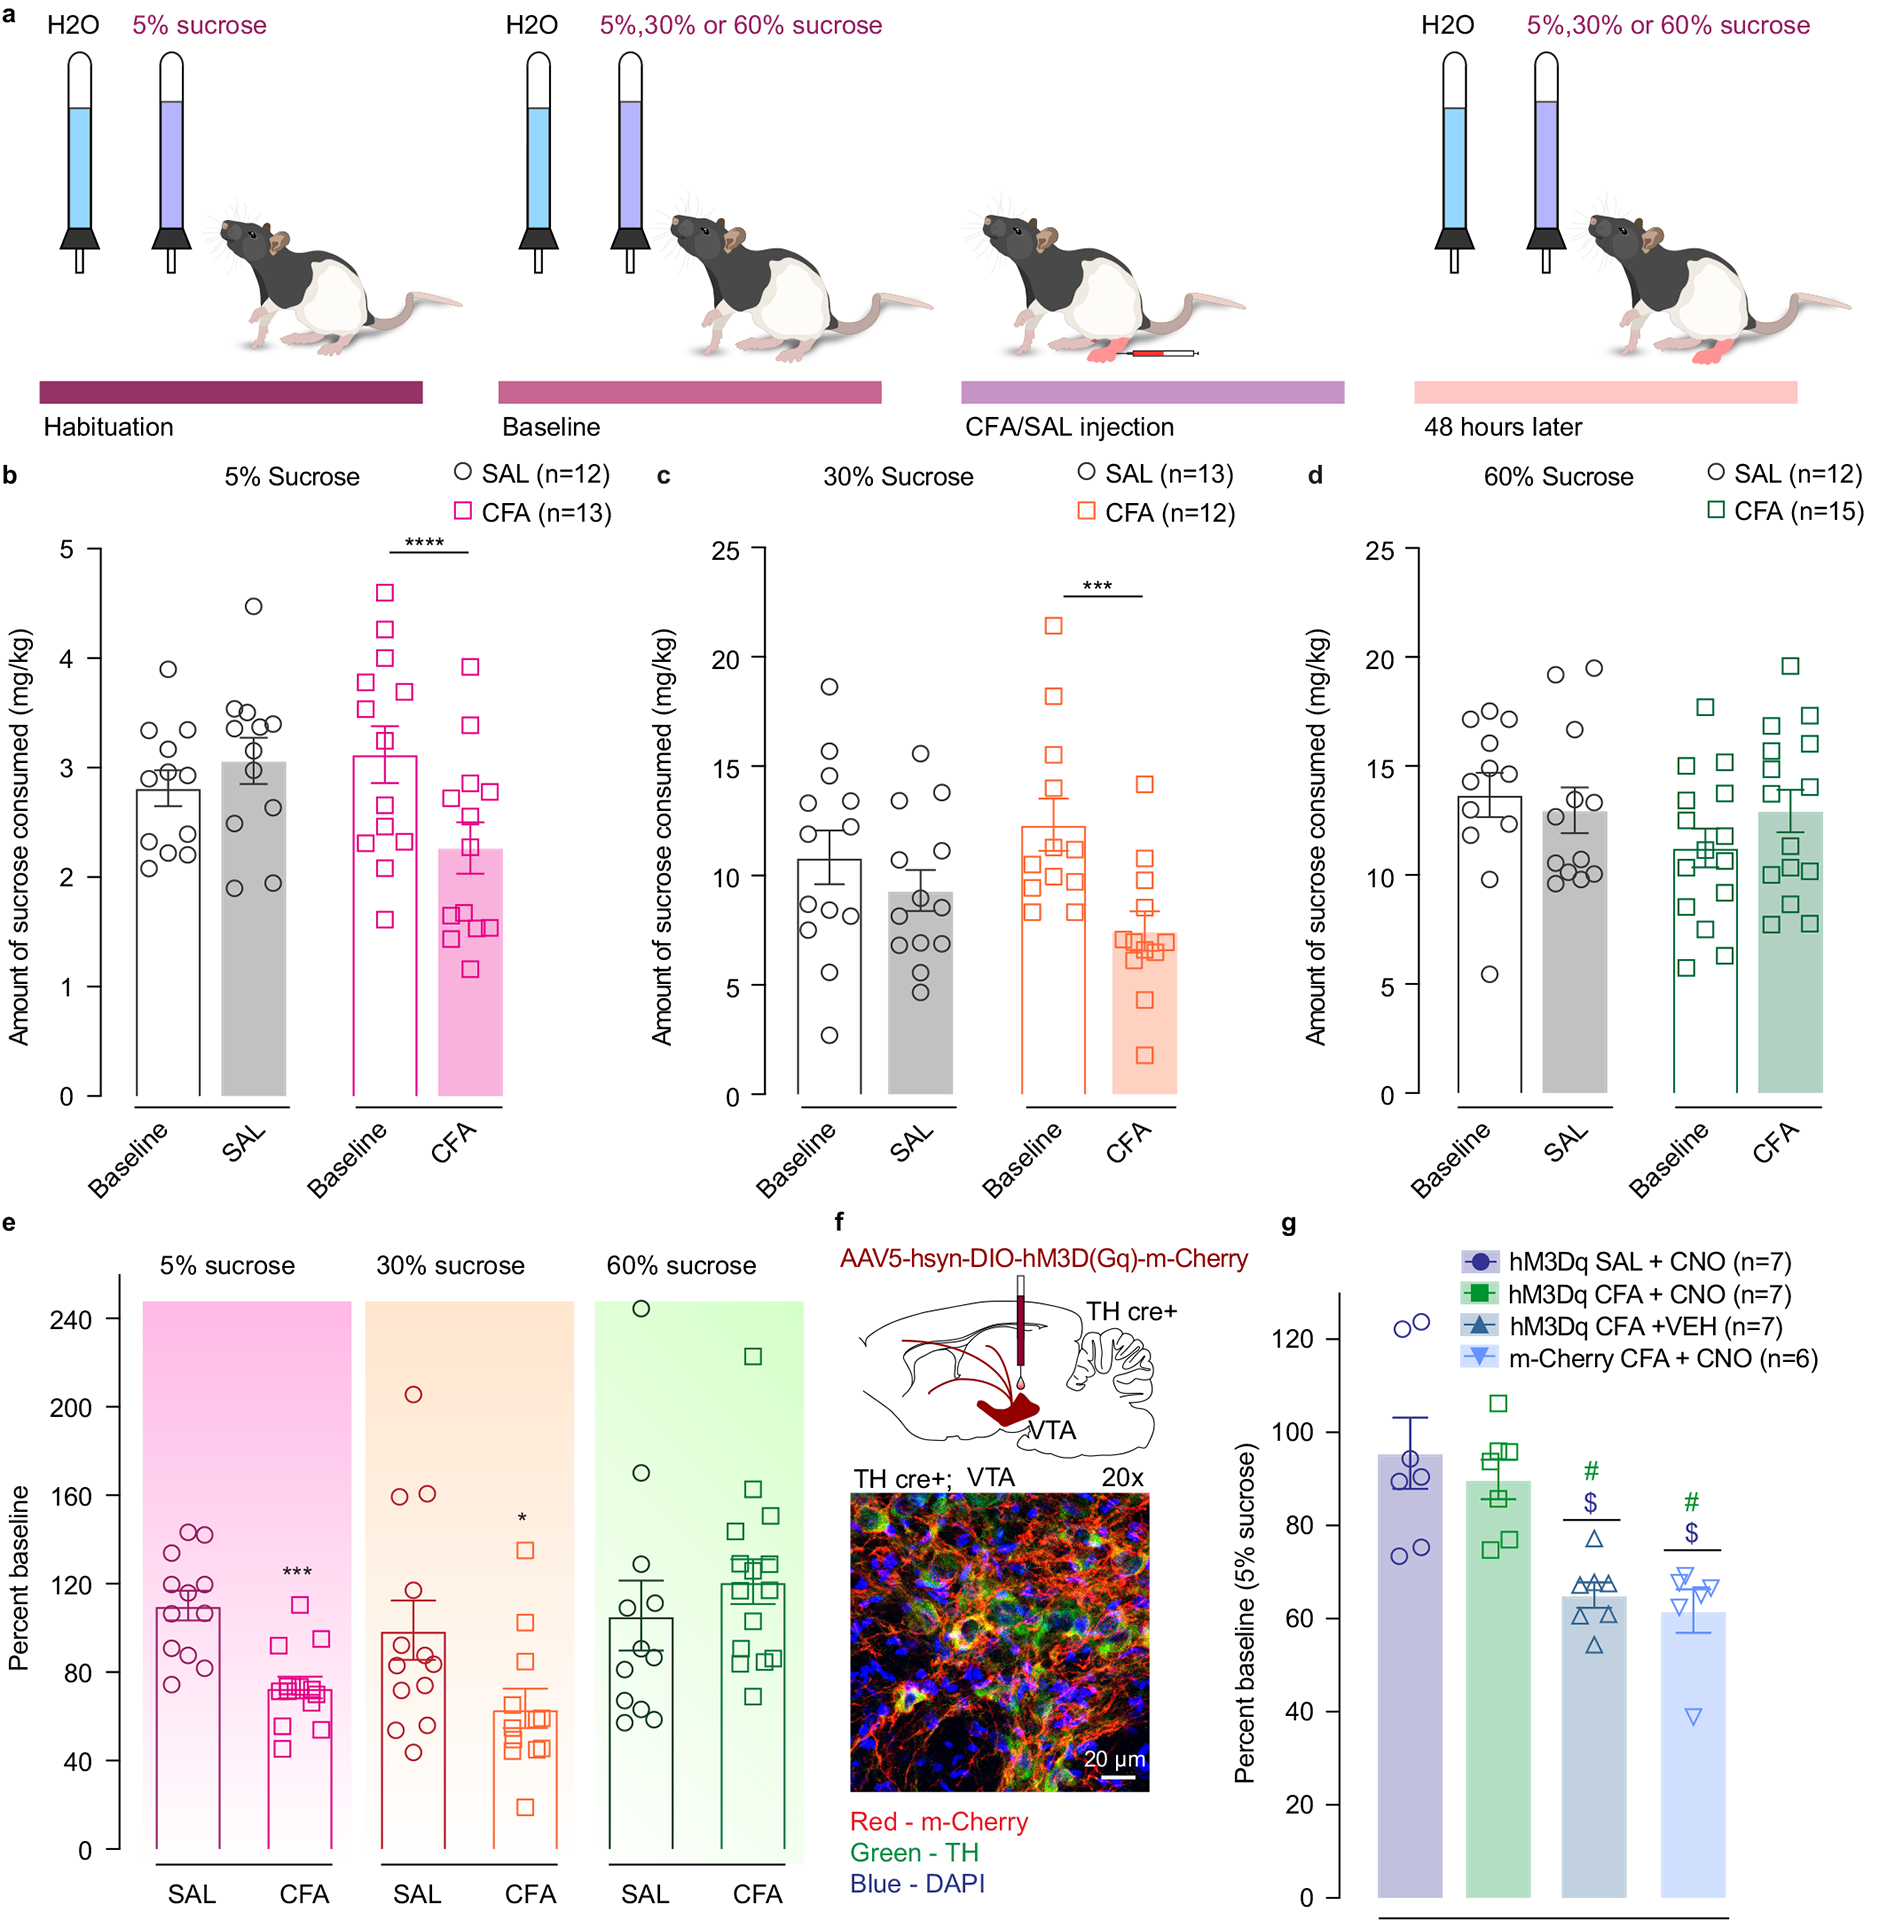
a. Schematic representation of behavioral methodology. b–d. CFA induces significant decrease in the amount of 5% and 30% sucrose consumed (open bars-baseline, filled bars – 48 hours post CFA/SAL. 5% sucrose two-way ANOVA for repeated measures, time: F1, 23 = 6.387, p=0.0188; interaction (time × treatment): F1, 23 = 21.31, p=0.0001; Sidak’s post hoc within group: CFA (n=13) baseline versus 48 hours post CFA, **** p<0.0001; 30% sucrose two-way ANOVA for repeated measures, time: F1, 23=14.86, p=0.0008; interaction (time × treatment): F1, 23=4.105, p=0.0545; Sidak’s post hoc within group: CFA (n=12) baseline versus 48 hours post CFA, *** p=0.0009). Increasing the concentration of sucrose solution to 60% (CFA (n = 15 rats), SAL (n = 12 rats)) prevents pain-induced decrease in sucrose consumption. e. Sucrose consumption presented as percent change of baseline (5% sucrose two-tailed unpaired t test between CFA (n = 13 rats) and SAL (n=12 rats), *** p=0. 0002: 30% sucrose two-tailed unpaired t test between CFA (n=12 rats) and SAL (n=13 rats), * p=0.0409; 60% sucrose (CFA (n = 15 rats), SAL (n = 12 rats)). f. Schematic of viral injection and representative coronal section of VTA Gq DREADD expressing neurons. Blue – DAPI; Red – m-Cherry (Gq DREADD); Green – TH (DA neurons). g. Chemogenetic activation of DA containing neurons in the VTA restores consumption of 5% sucrose in pain (Kruskal-Wallis test, ***P=0.0005; two-tailed Dunn’s multiple comparisons between groups: hM3Dq CFA + VEH (n=7) versus hM3Dq SAL + CNO (n=7), $ p=0.0183, hM3Dq CFA + VEH versus hM3Dq CFA + CNO (n=7), # p=0.0204; m-cherry CFA + CNO (n=6) versus hM3Dq SAL + CNO, $ p=0.0139, m-cherry CFA + CNO versus hM3Dq CFA + CNO, # p=0.0155). The data are presented as the mean ± s.e.m.
Lastly, using a chemogenetic approach we found that selective activation of VTA DA neurons is sufficient to reverse CFA induced decrease in motivated behavior (Figure 3). Thus, we assessed whether selective activation of VTA DA neurons could also reverse the CFA induced decrease in 5% sucrose solution consumption. We bilaterally injected Cre-dependent excitatory DREADDs (AAV5-hSyn-DIO-hM3D(Gq)-m-Cherry) or control virus (AAV5-Ef1a-DIO-m-Cherry) in the VTA of TH-Cre rats (Figure 5f and Extended figure 8d, e). We show that selective activation of VTA DA neurons reversed decrease in 5% sucrose solution consumption in CFA-treated animals while it had no effect in control (saline-treated) animals (Figure 5g and Extended figure 8a–c). Importantly, in these conditions a decrease in the amount of sucrose consumed was still observed in our CFA control groups injected with either DREADD virus or CNO alone (Figure 5g). These results indicate that the activation of VTA DA system is sufficient to restore normal hedonic responses to natural rewards.
RMTg GABAergic neuronal projections onto VTA DA neurons exhibit higher release probability in pain.
We showed above that in VTA slices from CFA injected rats DA cells were less excitable in part due to increased GABAergic inhibition. Inhibition of VTA DA neurons is known to disrupt reward consumption.34 Furthermore, the activity of VTA DA neurons is highly controlled by the intrinsic excitability of DA cells and their synaptic inputs.11,21 The rostromedial tegmental nucleus (RMTg) is one of the main sources of inhibitory drive onto the VTA DA neurons21,35 and is the major opioid-sensitive GABA input onto VTA DA neurons.21 We previously demonstrated that mu opioid receptor (MOR)-mediated inhibition of GABA release in the VTA is diminished in pain.17 Thus, we hypothesized that the RMTg GABA input onto VTA DA neurons is enhanced in the presence of pain.
To test this, we measured release properties of RMTg GABA neurons using paired-pulse ratio (PPR). GAD-cre rats were injected with cre-dependent channel rhodopsin (AAV5-EF1a-DIO-ChR2-eYFP) virus in the RMTg. After 2 recovery weeks to allow for appropriate viral expression, animals received either CFA or saline injection in the hindpaw (Figure 6a). RMTg evoked IPSCs onto VTA DA neurons were recorded ex vivo by activation of ChR2 expressing RMTg terminals (Figure 6b). Light power was adjusted to the lowest intensity at which we could consistently evoke a post-synaptic response. We found that PPR was significantly depressed in CFA treated animals as compared to saline-injected controls (Figure 6c), demonstrating increased release probability of RMTg GABA terminals onto VTA DA neurons. Further, PPR was not correlated with the evoked amplitude of initial response at any inter-pulse interval, indicating that the observed effect is not an artifact arising from potential vesicle depletion scaling with the efficiency of channelrhodopsin (Extended figure 9h–j).
Figure 6. RMTg GABAergic neuronal projections have higher release probability in CFA treated animals.
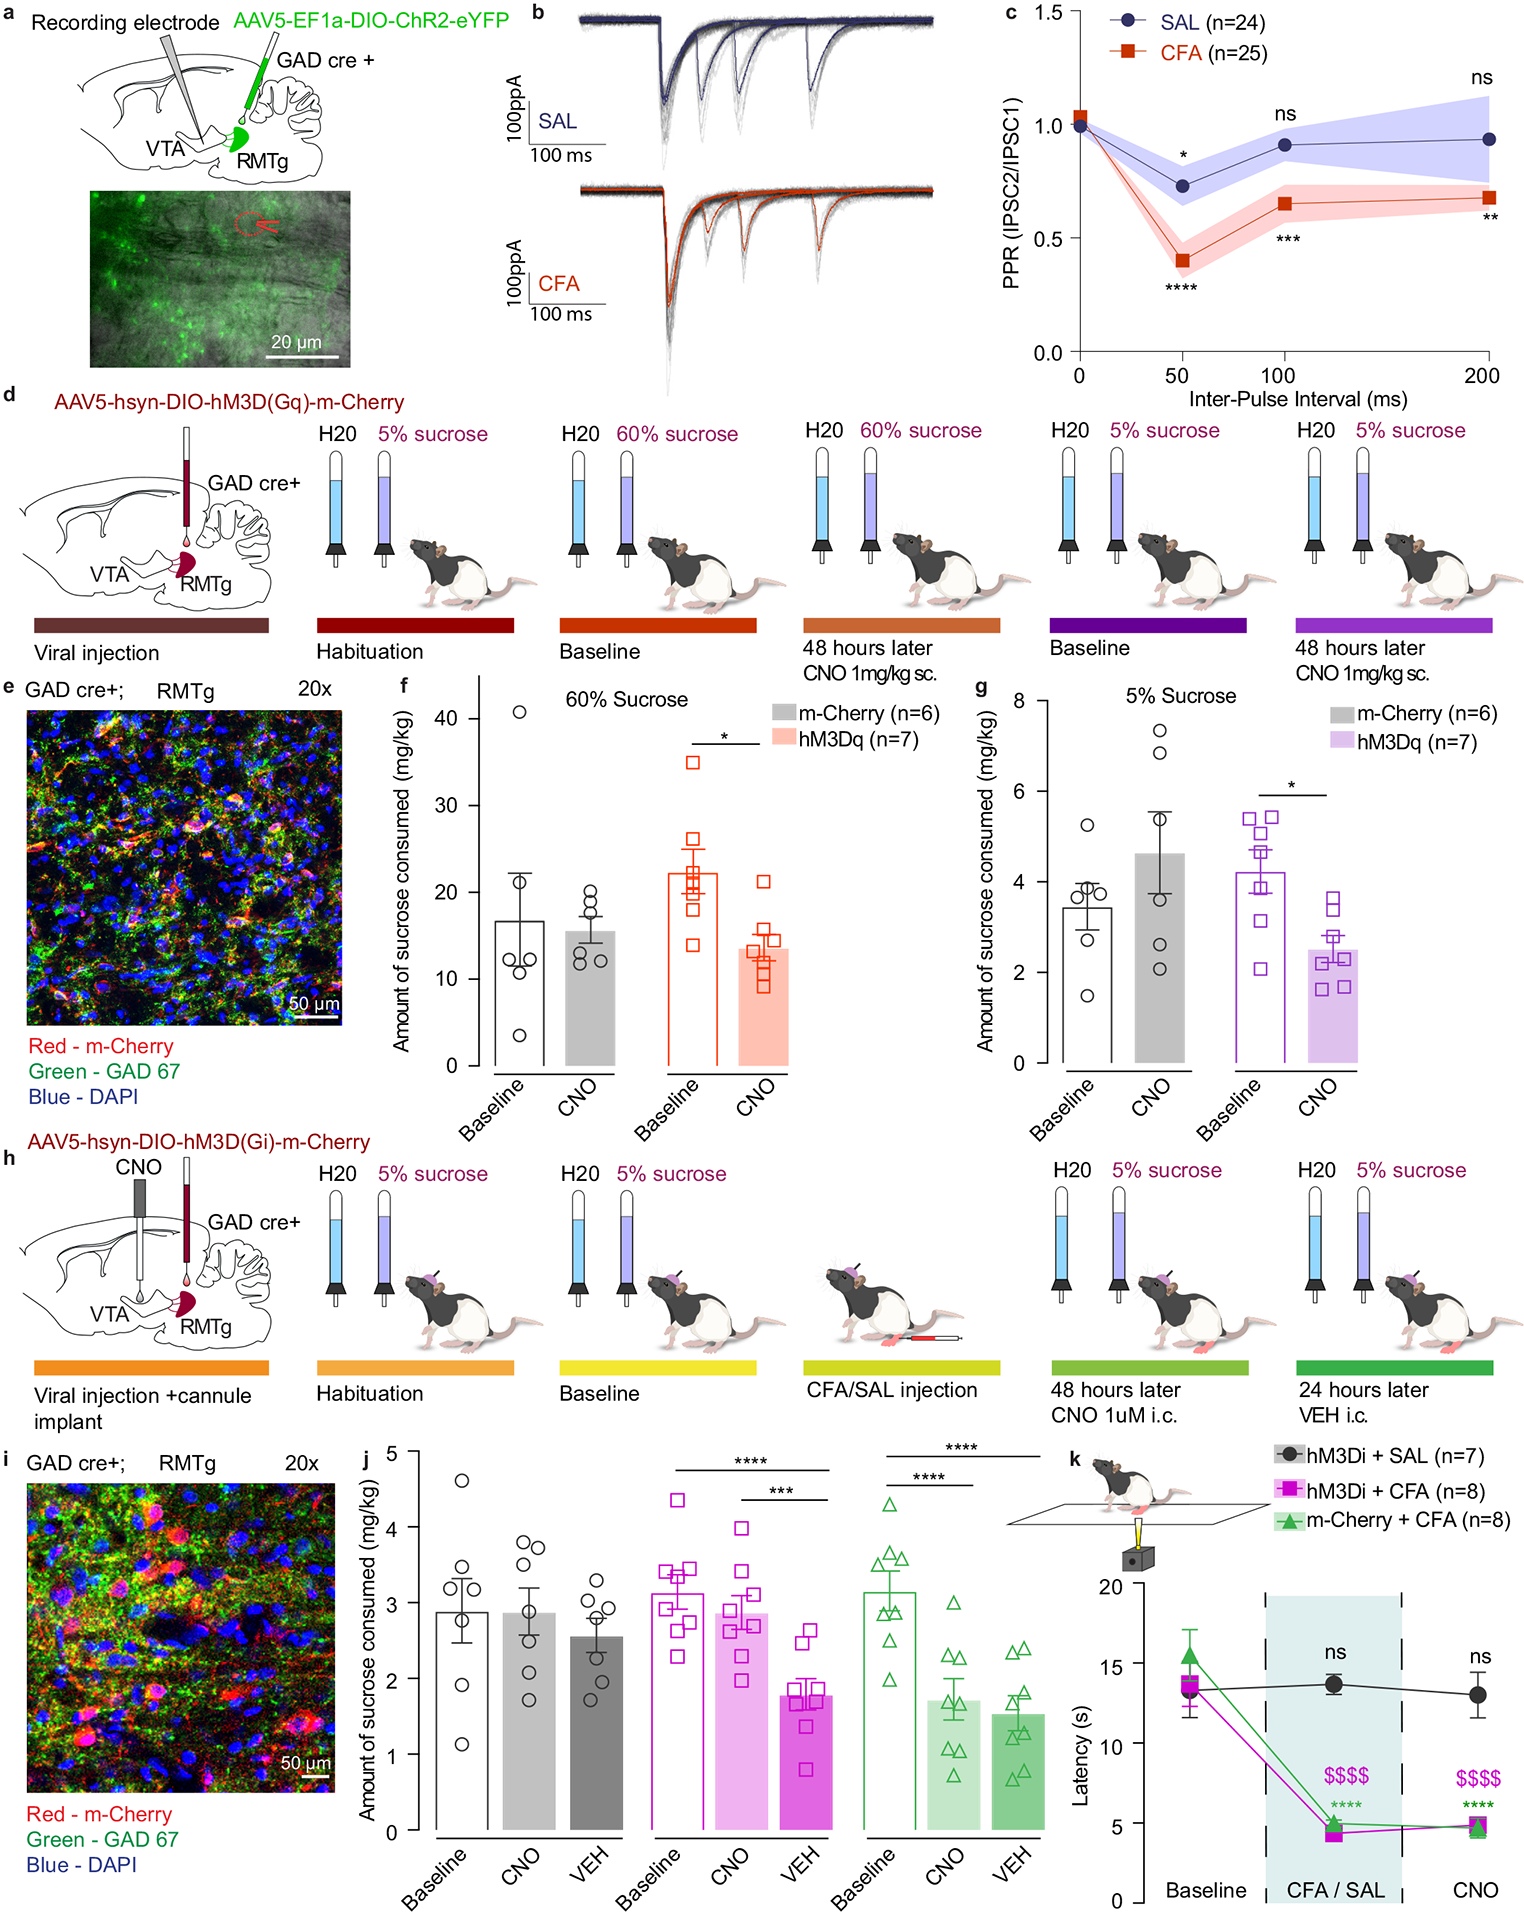
a. Representative image of viral injection in the RMTg and recording electrode in the VTA of GAD-cre animals. b. Representative traces of evoked IPSCs in control (saline) and pain (CFA) condition represented as mean ± s.e.m.. c. PPR is persistently depressed in the condition of pain which is consistent with a higher release probability. (2way ANOVA for repeated measures; inter-pulse interval: F3, 141 = 12.32, p<0.0001; interaction (inter-pulse interval × treatment): F3,141 = 2.479, p=0.0637; Dunnett’s multiple comparisons post hoc test comparing PPR at each inter-pulse interval to the baseline: SAL, *p=0.0363; CFA, **p = 0.0022; ***p=0.0009; **** p<0.0001, n (SAL) = 24 cells from 4 rats, n (CFA) = 25 cells from 3 rats, data represented as mean ± s.e.m.) d. Schematic representation of behavioral methodology. e. Representative coronal section of RMTg Gq DREADD expressing neurons. Blue – DAPI; Red – m-Cherry (Gq DREADD); Green – GAD 67 (GABA neurons). f. Activation of GABA containing neurons in the RMTg induces decrease in the amount of 60% sucrose consumed (open bars-baseline, filled bars – 48 hours post CNO. 60% two-way ANOVA for repeated measures, time: F1, 11=4.816, p=0.0506; interaction (time × treatment): F1, 11=2.786, p=0.1233; Sidak’s post hoc within group: hM3Dq (n=7) baseline versus 48 hours post CNO, * p=0.0317). g. Activation of GABA containing neurons in the RMTg induces decrease in the amount of 5% sucrose consumed (open bars-baseline, filled bars – 48 hours post CNO. 5% two-way ANOVA for repeated measures, time: F1, 11=0.3548, p=0.5635; interaction (time × treatment): F1, 11=10.96, p=0.0069; Sidak’s post hoc within group: hM3Dq (n=7) baseline versus 48 hours post CNO, * p=0.03). h. Schematic representation of behavioral methodology. i. Representative coronal section of RMTg Gi DREADD expressing neurons. Blue – DAPI; Red – m-Cherry (Gi DREADD); Green – GAD 67 (GABA neurons). j. Inhibition of RMTg-VTA GABAergic pathway restores sucrose consumption in CFA treated animals. (open bars-baseline, filled bars – 48 hours (CNO) and 72 hours (VEH) post CFA). two-way ANOVA for repeated measures, time: F2, 40=28.60, p<0.0001; interaction (time × treatment): F4,40=6.707, p=0.0003; Sidak’s post hoc within group: hM3Di + CFA baseline(n=8) versus hM3Di + CFA + VEH (n=8), **** p<0.0001; hM3Di + CFA + CNO(n=8) versus hM3Di + CFA + VEH (n=8), *** p=0.0002; m-Cherry + CFA baseline(n=8) versus m-Cherry + CFA + CNO(n=8) ), **** p<0.0001; m-Cherry + CFA baseline(n=8) versus m-Cherry + CFA + VEH(n=8) ), **** p<0.0001). k. Inhibition of RMTg-VTA GABAergic pathway does not alter CFA induced hyperalgesia. (two-way ANOVA for repeated measures, time: F2, 40 = 53.58, p<0.0001; interaction (time × treatment): F4, 40 = 13.19, p<0.0001; Sidak’s post hoc for each group as compared to the group’s baseline session: **** p<0.0001). The data are presented as the mean ± s.e.m.
Next, we assessed whether RMTg-mediated inhibition of VTA would mimic the effects of pain on voluntary sucrose consumption. We activated RMTg GABA neurons using a chemogenetic approach during a two-bottle choice experiment. Cre-dependent excitatory DREADDs (AAV5-hSyn-DIO-hM3D(Gq)-m-Cherry) or control virus (AAV5-Ef1a-DIO-m-Cherry) were bilaterally injected in the RMTg of GAD-Cre rats (Figure 6d, e and Extended figure 9f, g).
After habituation sessions of two-bottle choice, a baseline test was performed during which both 60% sucrose and water volume consumed were recorded. To maintain consistency with the pain two-bottle choice experiments animals were tested again 48 hours later, when they received subcutaneous administration of CNO (1mg.kg−1). A week later animals underwent another set of baseline and post-CNO sessions using a 5% sucrose concentration in two-bottle choice test (Figure 6d).
In this experiment, activation of RMTg GABA neurons was sufficient to induce a decrease in consumption of both 60% and 5% sucrose solution (Figure 6f, g and Extended figure 9e) without altering the volume of water consumed or the preference for sucrose solution over water (Extended figure 9a–d). This finding shows that enhancing inhibitory drive onto VTA DA neurons induces a decrease in consumption of 5% sucrose solution, similar to pain-induced anhedonia-like states. The decreased consumption of 60% sucrose in this experiment further demonstrates a role of RMTg GABA neurons in reward processing.
RMTg GABA cell activity is necessary for pain-induced anhedonia.
Finally, to assess the necessity of enhanced RMTg GABAergic inputs onto VTA in driving anhedonia like behaviors we inhibited this pathway in CFA and saline injected animals using chemogenetics during 5% sucrose two-bottle choice paradigm (Figure 6h). Here, we bilaterally injected Cre-dependent inhibitory DREADDs (AAV5-hSyn-DIO-hM3D(Gi)-m-Cherry) or control virus (AAV5-Ef1a-DIO-m-Cherry) in the RMTg of GAD-Cre rats and implanted intra –VTA cannula for the local delivery of 1mM of CNO or aCSF (Figure 6i and Extended figure 10d–g). We show that inhibition of RMTg GABAergic input onto VTA via intracranial CNO injection restores consumption of 5% sucrose in two-bottle choice in CFA treated animals, while it does not alter sucrose intake in saline injected group (Figure 6j and Extended figure 10 a, b). In addition, animals injected with inhibitory DREADDs and receiving intra-VTA aCSF, or animals injected with control virus and intra-VTA CNO show persistent pain induced decrease in sucrose intake as expected (Figure 6j and Extended figure 10c). Interestingly, while inhibition of RMTg-VTA GABAregic input restores hedonic state of animal in pain, it does not alter CFA induced hyperalgesia (Figure 6k) demonstrating the role of this pathway in mediating the affective component of pain.
Taken together, these findings show that pain induces increased inhibitory drive from RMTg GABA neurons onto VTA DA neurons, and that this increase in inhibition is necessary and sufficient to drive anhedonia-like behavior.
DISCUSSION
Pain triggers maladaptive changes within the mesolimbic reward pathway, leading to the development of negative affective states.17–19 Within this pathway, pain impairs mu opioid receptor (MOR)-mediated inhibition of GABA release in the VTA.17 Moreover, inflammatory and neuropathic pain strongly alter opioid-evoked DA release in the NAc,17,18 and alterations in the subpopulations of VTA DA neuron firing properties in a neuropathic pain model have also been reported.36 However, direct evidence for an effect of pain on VTA DA cell activity and excitability, and its role in mediating changes seen in motivated behavior, has been lacking.
Here we report that the resting membrane potential of VTA DA neurons is decreased and the rheobase is increased by pain, revealing that DA neurons are less responsive during pain. We demonstrate that the decrease in intrinsic excitability of VTA DA cells is at least in part mediated via GABAergic inputs providing higher inhibitory drive onto VTA DA neurons. Together with our previous studies, these findings suggest that pain downregulates the MOR system at GABA terminals in the VTA, leading to increased inhibitory drive and, consequently, decreased excitability of VTA DA neurons.17 We also found a non-significant trend towards reduced spontaneous firing rate and input resistance in pain. The lack of significant effect of pain on spontaneous firing rate could be explained by an increased variability in the data sets, suggestive of potentially divergent effects of pain on subpopulations of VTA DA neurons as previously reported in a different pain model.36 There is also long range GABAergic modulation of reward seeking in the NAc, suggesting that local VTA GABA and DA signaling may interact with downstream accumbal modulation of other transmitter systems like acetylcholine, which may be altered by pain.37 Additionally, altered excitatory glutamatergic inputs from ventrolateral periaqueductal gray (vlPAG) could play a role in reducing VTA DA neuron activity in conditions of pain.38 Thus, pain likely dysregulates not only the DA system, but rather multiple neurotransmitter systems within the mesolimbic reward pathway to drive negative affective states.
We showed that pain-induced reductions in DA neuron firing are associated with decreased frequency of VTA DA calcium transients during sucrose self-administration. Interestingly, animals experiencing inflammatory pain had no significant changes in VTA DA calcium activity during lever presses while seeking for the reward, but their phasic DA calcium activity upon reward delivery was higher. While this increase in phasic response to reward delivery in pain may be surprising at first, it could be associated with changes in the hedonic state of the animal in pain. Namely, rewards of larger-than-expected value induce a higher phasic response (known as positive reward prediction error).39,40 Thus, animals with inflammatory pain experiencing anhedonia may have lower reward expectation, and therefore a greater phasic VTA DA response when a reward is received. Our electrophysiology and chemogenetic studies show that the decreased VTA DA neuron activity is in part due to increased inhibitory tone from the RMTg. The RMTg plays a critical role in shaping reward prediction error and is inhibited by sucrose or sucrose-predictive cues.35,41 Thus, it is conceivable that relief from inhibition by RMTg neurons, and the subsequent lower baseline activity of VTA DA neurons, would lead to accentuated phasic changes of VTA DA neuron activity in response to reward delivery.
Chemogenetic activation of VTA DA neurons has been used to demonstrate the role of DA in mediating an increase in motivation for sucrose rewards.28 Our findings demonstrate that enhancing VTA DA neuron activity or the VTA-NAcSH pathway is sufficient to reverse pain-induced decrease in motivation. While our chemogenetic approach enabled manipulation of a specific pathway, it does not allow for cell-specific activation within that pathway; additional neuronal groups such as GABA- or glutamate-containing neurons may also contribute to this reversal.31,42 Nevertheless, the number of DREADD-infected DA neurons in the VTA correlated with the percent motivation change in pain, suggesting that this DA population plays a role in the restoration of motivation for sucrose.
The relief of the nociceptive component of ongoing pain is sufficient to produce negative reinforcement through activation of the mesolimbic DA reward pathway.32,43,44 Our data suggest that activating DA pathway reverses anhedonia-like behavior but is not sufficient to relieve CFA-induced hyperalgesia. Together, these results suggest that removing the afferent nociceptive information produces negative reinforcement through DA neurotransmission, while activating DA pathways helps to resolve the negative emotional components of inflammatory pain.
DA release can be locally modulated at the levels of terminals in the NAc, independently from the DA cell firing, and thus DA cell firing rate and accumbal dopamine release may mediate dissociable aspects of DA-related behaviors.45 While the excitability of DA cells is attenuated in pain, we found that the ex vivo probability of local DA release at the axon terminals in the NAcSh remained unchanged. The lack of a difference in the probability of evoked DA release may also suggest that pain-induced decrease in motivated behaviors is driven by adaptations at the level of the VTA DA neuron cell body. Although we show that pain does not affect the properties of DA release at the terminals in NAc, DA release from NAc terminals is important for motivational deficits in pain states. Specifically, DA release in the NAc induces galanin receptor 1–triggered depression of excitatory synaptic transmission in the NAc20 as well as additional adaptations in the dynorphin and enkephalin NAc microcircuitry.19,20,46 In vivo, chemogenetic stimulation of VTA DA terminals in the NAcSh reversed the pain-induced decrease in motivation without reducing hyperalgesia, indicating that enhancing the activity of mesolimbic DA neurons can mitigate effects of pain on motivation.
Intake of drugs such as opioids is altered by the presence of pain.17 Specifically, pain induces a rightward shift in dose-response curve for opioid self-administration and attenuates opioid-evoked DA release in NAc.17 The current findings further contribute to this line of evidence and show that pain decreases consumption of natural rewards such as sucrose. This effect can be overcome if the concentration of sucrose is increased, suggesting that pain induces a dose-dependent shift in the rewarding properties of natural rewards. Importantly, water consumption remained unchanged, suggesting that pain affected the perceived value of the sucrose solution. It has been postulated that the hedonic aspects of both drugs and natural rewards are mediated through opioid systems in the brain.47,48 In fact, food consumption itself releases endogenous opioids within mesolimbic pathway.47 Additionally, pain induces dysfunction of MORs within VTA, thus leading to decreased motivation to obtain sucrose rewards.17,49 Our study demonstrates that increasing the concentration of sucrose rewards is sufficient to overcome this effect, possibly by a mechanism that includes enhanced mesolimbic endogenous opioid release.47
RMTg provides the main opioid-sensitive inhibitory input onto VTA DA neurons21,35 and a potential mechanism by which VTA DA neurons are less responsive in pain. We show that RMTg GABA inputs underlie the reduced excitability of VTA DA neurons in pain. Indeed, enhancing inhibitory drive by chemogenetic activation of RMTg GABA neurons mimicked the effect of pain on sucrose consumption. Interestingly, while pain affected intake of low- but not high-concentration sucrose rewards, chemogenetic activation of RMTg GABA neurons decreased consumption of high-concentration sucrose as well. One explanation for this finding could be that the chemogenetic approach we employed leads to global activation of RMTg GABA neurons, whereas pain only impacts a subset of RMTg GABA neurons, such as those containing MOR.17,22 Conversely, inhibition of RMTg GABAergic projections to the VTA was sufficient to prevent pain-induced decrease in sucrose consumption, without altering sucrose consumption in saline treated animals. This result demonstrates that the RMTg GABAergic inputs onto VTA are necessary mediators of pain-induced anhedonia-like behavior.
In conclusion, our results provide insight into the regulation of the mesolimbic DA pathway by pain, and its consequences on anhedonia-like behaviors. It is important to note that the observed decrease in motivation arises at the initial stages of inflammatory pain and is one of the first symptoms of pain-induced negative affect. As such, further adaptations in the VTA DA circuits could additionally contribute to the development of pain-induced depressive-like behaviors that may arise at later time points in persistent pain.50 We propose that changes in the VTA DA pathways serve as a potential driver for alterations in circuits mediating those behaviors. The present study uncovers adaptations in a mesolimbic system necessary for the affective component of pain. Our findings increase our understanding of the neural circuitry underlying pain-induced negative affect and provide important mechanistic insight that may contribute to treatments for patients suffering from pain conditions.
MATERIAL AND METHODS
Animals:
All procedures were approved by Washington University and the National Institute on Alcohol Abuse and Alcoholism (NIAAA) Animal Care and Use Committee in accordance with the National Institutes of Health Guidelines for the Care and Use of Laboratory Animals.
Adult male and female Long Evans Wild Type, TH-cre and GAD-cre rats (250–350g), and adult male and female DATIRES-cre mice crossed with Cre driven expression of ChR2 mice (AiCop4) were used for this study. All animals for behavioral experiments were 8 to 10 weeks old at the beginning of the experiments. Animals used for patch-clamp electrophysiology were between 3.5 and 6 (for optogenetic studies) weeks old. Rats were group housed with two to three animals per cage on a 12/12 hours dark/light cycle (lights on at 7:00 AM) and acclimated to the animal facility holding rooms for at least 7 days before any manipulation. Mice were housed up to 4 animals per cage. The temperature for the holding rooms of all animals ranged from 69–75°F while the humidity was between 30–70%.
All experiments were performed during the light cycle. Rats received food and water ad libitum until 2 days prior to starting the behavioral studies, when food restriction (16 g of rat chow per day) started and continued until the end of the experiments. Mice received food and water ad libitum throughout the entire experimental procedure.
Surgeries:
All surgeries were performed under isoflurane (2.5/3 MAC) anesthesia using appropriate sterile aseptic techniques.
Intra cerebral injections:
For chemogenetic activation of VTA DA neurons and fiber photometry recordings of VTA DA neuron activity, TH-cre rats were bilaterally injected with either AAV5-hSyn-DIO-hM3D(Gq)-m-Cherry, AAV5-Ef1a-DIO-m-Cherry, AAV-DJ-EF1a-DIO-GcaMP6s (all viruses injected at 1.5–2.5×10¹² transducing units per ml − 0.5μl per side, Addgene), and/or implanted with fiber optic (Doric lenses) in the VTA (stereotaxic coordinates for viral injections from Bregma: A/P = −5.3mm, M/L = ± 0.7mm, D/V = − 8mm; stereotaxic coordinates for optic fiber from Bregma: A/P = −5.3mm, M/L = ± 0.7mm, D/V = −7.8mm from the skull surface, World Precision Instruments). The optic fiber implant was secured to the skull using three sterile bone screws and a dental cement head-cap (Lang Dental).
For chemogenetic activation of NAc projecting VTA DA terminals in addition to DREADD injections animals received bilateral intra-NAc cannula implants (stereotaxic coordinates for cannula implant from Bregma: A/P = +1.2mm, M/L = −0.8MM, D/V = −6.0mm from the skull surface with injectors extending 1mm past the tip of the cannula) for the local delivery of either aCSF or CNO.
For chemogenetic activation of rostromedial tegmental nucleus (RMTg) GABA neurons GAD-cre rats were bilaterally injected with either AAV5-hSyn-DIO-hM3D(Gq)-m-Cherry or AAV5-Ef1a-DIO-m-Cherry (1.5–2.5×10¹² transducing units per ml − 0.5μl per side, Addgene) in the RMTg (stereotaxic coordinates from Bregma: A/P = −6.8mm, M/L = ± 1.6mm, D/V = −8.4mm from skull surface under 10° angle).
For chemogenetic inhibition of RMTg-VTA GABA neurons GAD-cre rats were bilaterally injected with either AAV5-hSyn-DIO-hM3D(Gi)-m-Cherry or AAV5-Ef1a-DIO-m-Cherry (2.5–2.9 × 10¹² transducing units per ml − 0.5μl per side, Addgene) in the RMTg (stereotaxic coordinates from Bregma: A/P = −6.8mm, M/L = ± 1.6mm, D/V = −8.4mm from skull surface under 10° angle). At the same time, animals were bilaterally implanted with intra-VTA cannula implants (stereotaxic coordinates for cannula implant from Bregma: A/P = −5.3mm, M/L = ± 0.7mm, D/V = − 7mm from the skull surface with injectors extending 1mm past the tip of the cannula) for the local delivery of either aCSF or CNO.
For combined chemogenetics experiments wild type (WT) rats were bilaterally injected with retrograde Canine AdenoVirus CAV2-cre (2.14×10¹² transducing units per ml − 0.5μl per side, The Institute of Molecular Genetics of Montpellier) in the NAc (stereotaxic coordinates for viral injections from Bregma: A/P = +1.2mm, M/L = −0.8MM, D/V = −7.0mm from the skull surface) and either AAV5-hSyn-DIO-hM3D(Gq)-m-Cherry or AAV5-Ef1a-DIO-m-Cherry in the VTA. Following viral injections, the incision was closed using sterile stainless steel wound clips (Autoclip, Braintree Scientific, Inc).
For optogenetic electrophysiology recordings 4-week old GAD-cre rats were injected bilaterally with AAV5-EF1a-DIO-ChR2-eYFP in the RMTg (stereotaxic coordinates for viral injections from Bregma: A/P = −6.3mm, M/L = ± 1.4mm, D/V = −7.4mm from skull surface under 10° angle).
To avoid post-surgical complications and minimize pain, animals received a daily subcutaneous (s.c.) injection of 8mg/kg enrofloxacin and 5mg/kg carprofen solution for 2 consecutive days together with complementary carprofen chewable tablets. Behavioral experiments were started either 3 or 5 weeks after intracerebral injections to allow for maximal viral expression at the time of testing.
Complete Freund’s Adjuvant (CFA) injections:
Animals were sedated using isoflurane anesthesia. Once appropriate sedation was achieved, as determined by lack of reflex during toe-pinch, rats and mice were injected in the right hindpaw with 200 μl or 50 μl of CFA solution (Thermo Fisher), respectively. Saline injected animals served as controls. Animals’ general behavior (feeding, drinking, locomotion) was monitored throughout the duration of experiments.
Ex vivo fast-scan cyclic voltammetry (FSCV):
Mice were anesthetized with isoflurane and euthanized by decapitation. Brains were sliced in sagittal orientation at 240 μm thickness with a vibratome (VT-1200S Leica) in an ice-cold cutting solution containing (in mM) 225 sucrose, 13.9 NaCl, 26.2 NaHCO3, 1 NaH2PO4, 1.25 glucose, 2.5 KCl, 0.1 CaCl2, 4.9 MgCl2, and 3 kynurenic acid. Slices were incubated for 20 min at 33 °C in artificial cerebrospinal fluid (ACSF) containing (in mM) 124 NaCl, 1 NaH2PO4, 2.5 KCl, 1.3 MgCl2, 2.5 CaCl2, 20 glucose, 26.2 NaHCO3, 0.4 ascorbic acid, and maintained at room temperature prior to recordings. Slices were placed in a submerged chamber perfused at 2 ml/min with ACSF at 32 °C using an in-line heater (Harvard Apparatus). Cylindrical carbon-fiber electrodes (CFEs) were prepared with T650 fibers (6 μm diameter, ~150 μm of exposed fiber) inserted into a glass pipette. Before use, the CFEs were conditioned with a 8 ms long triangular voltage ramp (−0.4 to +1.2 and back to −0.4 V versus Ag/AgCl reference at 4 V/s) delivered every 15 ms. CFEs showing current above 1.8 μA or below 1.0 μA in response to the voltage ramp around 0.6 V were discarded.
DA transients were recorded using the same triangular voltage ramp delivered every 100 ms in the NAcSh area (A/P: + 1.30mm, M/L: ± 0.5mm, D/V: −4.75mm), and evoked by either monopolar electrical stimulation through an ACSF filled glass pipette placed by passing rectangular pulse of 100–250 μA at 0.2 ms duration (Cygnus Technology Inc.) or brief light pulse (1 or 2 ms) through using an optical fiber (200 μm/0.22 NA) connected to a 470 nm LED (2 mW; ThorLabs) delivered every 2 min. Data were collected with a modified electrochemical headstage (CB-7B/EC retrofit with 5 MΩ resistor) using a Multiclamp 700B amplifier (Molecular Devices) after being low-pass filtered at 10 kHz and digitized at 100 kHz using custom-written software in Igor Pro 7 (version 7.0.6.1, Wavemetrics) running mafPC 2019 software (courtesy of M.A. Xu-Friedman). Custom-written analysis software in Igor Pro was used for analysis. Decay time constants were obtained with a single exponential fit of the derivative of the falling phase of DA transient curve.
Patch-clamp electrophysiology:
Patch-clamp electrophysiology data acquisition was completed using Clampex 11.4 software (Molecular Devices). Visualized whole-cell recording techniques were used to measure holding and synaptic responses of DA neurons in the VTA. Currents were amplified, low-pass filtered at 4 kHz, and digitized at 10 kHz. Recordings were performed in whole cell configuration with the patch pipette internal solution containing (in mM): 130 potassium gluconate, 10 phosphocreatine disodium salt, 4 MgCl2, 3,4 Na2ATP, 0,1 Na3GTP, 1,1 EGTA, 5 HEPES. All recordings were performed in dopamine neurons identified by 1) a cellular capacitance > 30 pF, 2) spontaneous firing below 5 Hz, and 3) the presence of large hyperpolarization-activated inward current, /h. To ascertain the presence of /h currents, neurons were voltage clamped at −60 mV, and the response to five hyperpolarizing voltage steps (250 ms, −25 to −125 mV in increments of −25 pA) were measured. The spontaneous activity and the responses to current injections were made in current-clamp configuration. Spontaneous firing rate and resting membrane potential was recorded for 5 minutes, in 5 trials of 60 seconds. To generate an input-output curve of neuronal excitability, 200 ms current steps were injected in increments of 10 pA from −50 to 200 pA and the numbers of spikes were quantified for each step. Rheobase was determined by injecting 100 ms ramps of increasing current (0 — 180 pA) and measuring the current where the first action potential was observed. To assess the impact of inhibition on DA neuron excitability, experiments were first conducted in the presence of glutamate receptor antagonist kynurenic acid (2 mM), and again after artificial cerebrospinal fluid (aCSF) containing GABAA receptor antagonist picrotoxin (100 μM) was washed on. Spontaneous inhibitory postsynaptic currents (sIPSCs) were recorded in the presence of kynurenic acid (2 mM). VTA DA neurons were voltage clamped at −60 mV with the patch pipette internal solution containing (in mM): 100 KCl, 30 potassium gluconate, 4 MgCl2, 10 phosphocreatine disodium salt, 3.4 Na2ATP, 0.1 Na3GTP, 1.1 EGTA, and 5 HEPES. Recordings were excluded if the series resistance or noise level varied by more than 25% over the course of recordings.
To record RMTg evoked inhibitory post-synaptic currents (IPSCs) onto VTA DA neurons, VTA slices were prepared two weeks following viral injection of channelrhodopsin (ChR2) into RMTg of GAD-cre rats. VTA DA neurons were voltage clamped at −60 mV with the patch pipette internal solution containing (in mM): 100 KCl, 30 potassium gluconate, 4 MgCl2, 10 phosphocreatine disodium salt, 3.4 Na2ATP, 0.1 Na3GTP, 1.1 EGTA, and 5 HEPES. Activation of ChR2-expressing RMTg terminals was accomplished by an LED mounted in the epifluorescence light path. Light power was modulated to the lowest intensity at which we could consistently evoke a post-synaptic response, up to a maximum of 15 mW. IPSCs were isolated by the addition of the glutamate receptor antagonist kynurenic acid (2mM) to the aCSF. Responses to paired stimuli were assessed at interleaved inter-stimulus intervals of 50, 100, and 200 ms. Paired-pulse ratio (PPR) was calculated as the amplitude ratio IPSC2/IPSC1.
Recordings from saline- and CFA-treated pairs of rats were interleaved within each day.
Operant conditioning:
Rat sucrose self-administration was conducted using operant-conditioning chambers (Med Associates, MED – PC 5 software) equipped with two retractable levers positioned on the right-hand wall and a food magazine connected to a food pellet dispenser between them. Two cue lights were positioned above the levers, and one house light was positioned on the top left-hand wall. During self-administration sessions both levers (active and inactive) were extended out with white cue light turned on only above active lever. Presses on the active lever resulted in sucrose pellet delivery and a 20 s time-out period during which active and inactive lever were retracted, and cue light above active lever was turned off. Presses on the inactive lever did not result in any changes in the environment.
Three to five weeks after the surgical procedure (chemogenetic activation of VTA DA neurons, chemogenetic activation of VTA-NAc pathway and photometry, respectively), animals were trained to self-administer sucrose pellets as follows. First, animals were placed in operant boxes under fixed ratio (FR) 1 schedule of reinforcement for sucrose self-administration for 2 hours or until the rat reached a maximum of 60 rewards. Once the animals completed 3 consecutive daily sessions obtaining 60 rewards, they were then exposed to 3 FR2 sessions followed by 3 FR5 sessions. On the following day, animals were gently placed back in the self-administration enclosures and were given access to sucrose during a two-hour session on a progressive ratio (PR) schedule of reinforcement, during which the number of correct lever presses to receive the following reward increases exponentially (5 × e(0.2 × infusion number) − 5 rounded to the nearest integer resulting in the following PR steps: 1, 2, 6, 9, 12, 15, 20, 25, 32, 40, 50, 62, 77, 95…). Following the baseline PR session, animals received an injection of either saline or a CFA in the right hindpaw. Forty-eight hours after inflammatory pain induction, rats underwent a second two-hour PR session. For chemogenetic activation of VTA DA neurons, or the VTA-NAc pathway, clozapine-N-oxide (CNO 1mg.kg−1 s.c, Sigma) was administered 20 mins prior to starting the second PR session. For chemogenetic activation of VTA-NAcSh projecting DA terminals 250ul/side intra-NAcSh microinjections aCSF (on PR1) and aCSF or 1mM CNO (on PR2) were delivered over 5 minutes using Harvard Pump 11 Elite Series. Injectors were left in place for additional 2.5 minutes to allow for diffusion of the injected solution. Fifteen minutes after the start of intra-NAcSh injection, animals were placed in the boxes and PR sessions were started.
Open field test for locomotor activity:
Open field test was performed in square enclosures (60 × 60 cm) within sound attenuated room at 23° C room temperature. Animals underwent three 5 minutes habituation sessions followed by 30 minutes baseline session. Following baseline session animals received either CFA or saline injections in the paw. Forty-eight hours after the intraplanar injections s.c injections of either CNO 1mg.kg−1 or saline were administered. Second 30 minutes testing session in open field started 20 minutes after the s.c. injections. At the beginning of each session animals were placed in the center of the open field and total distance traveled was recorded and analyzed using AnyMaze 6.06 (64-bit) behavioral tracking software (Stoelting Co.).
Hargreaves plantar test for thermal sensitivity:
To assess thermal hyperalgesia induced by CFA injection we used the Hargreaves Plantar Test (IITC Life Science). Animals were placed in Plexiglas boxes on top of a glass surface. After 15 minutes of habituation, a heat source was applied on the plantar surface of the right hindpaw, and the latency of paw withdrawal from the heat stimulus was recorded. Animals underwent 3 habituation sessions prior to testing. Testing sessions consisted of four measurements with at least a 5 min interval between trials. Latency was determined by averaging all four trials per each testing session.
For chemogenetic experiments, thermal hyperalgesia was assessed 1 hour prior to PR1 (baseline) and PR2 (CFA/saline) sessions. To investigate the sufficiency of chemogenetic activation/silencing of neuronal pathway in hyperalgesic states during PR tests, an additional Hargreaves session was performed on the day following PR2 session 20 minutes after saline or CNO s.c. injection, or 15 minutes after aCSF or CNO intra-NAcSh microinjections.
For locomotor experiments thermal hyperalgesia was assessed 1 hour prior to baseline and testing (CFA/saline) sessions. An additional Hargreaves session was performed on the day following locomotor testing session 20 minutes after saline or CNO s.c. injection to assure that chemogenetic activation of VTA DA neurons does not alter CFA induced hyperalgesia in these animals.
For photometry studies, thermal hyperalgesia was tested 1 hour prior to any PR sessions.
Lastly, for the two-bottle choice experiments (see below) thermal hyperalgesia was assessed 1 hour prior to baseline and post-CFA/saline and post-CNO testing sessions.
Orofacial reactivity:
Animals were water restricted as in the two-bottle choice experiment. Rats were individually placed in a cage with no bedding and free access to a solution (water, 5%, 30%, or 60% sucrose) placed in a petri dish on the floor. Rats were filmed at 100 frames/s during drinking bouts. Consummatory and hedonic tongue protrusions from the three first bouts were scored offline. Hedonic protrusions were defined as any event where the tongue was extended out of the mouth but did not contact sucrose solution, in contrast to consummatory protrusions. For each rat, only one solution was tested per day and the order of solutions was counterbalanced within rats. In a separate session, rats were given free access to 0.05% quinine and aversive gapes were scored.
Two-bottle choice:
For the two-bottle choice studies, animals were water-restricted to four hours of water access following the experimental session. For testing sessions, rats were individually placed in a cage with no bedding and free access to either water or sucrose solutions placed on top of the wire rack covering the cage. Water and sucrose solution bottle placement (right or left) was counterbalanced. After 4 daily 1-hour habituation sessions during which animals were exposed to water and a 5% sucrose solution, a baseline measurement of water and sucrose (5%, 30% or 60%) consumption was obtained. Immediately after the baseline session, CFA was injected in animal’s hindpaw as described above. Saline injection was used as a control. Forty-eight hours after intraplantar injection, another test was conducted to determine the impact of pain on water and sucrose solution consumption.
For chemogenetic studies, CNO (1mg.kg−1 s.c.) was injected 20 minutes, or 5 minutes for intracranial CNO 1mM injection, prior to starting a two-bottle choice testing session. All measurements for water and sucrose consumption were recorded as volume (ml) and amount (g) of liquid consumed using weighing scale.
Immunohistochemistry:
Following each behavioral experiment, rats were trans-cardially perfused with phosphate buffered saline (PBS) followed by 4% paraformaldehyde (PFA). For cFos experiments rats were perfused 90 minutes following the s.c. injection of either 1mg.kg-1 CNO or saline to allow for maximal neuronal activation. Brains were collected and kept at 4°C for 24h in 4% PFA for post-fixation, followed by 72h incubation in 30% sucrose solution. Isopentane was used to flash freeze brain tissue which was consequently cut in 40 μm coronal slices using a cryostat (Leica CM 1950). Free-floating sections containing VTA were washed in PBS and blocked with Normal Donkey Serum (Millipore, S30) and 0.3% Triton-0.01 M PBS (PBS-T) and incubated overnight in 3% normal donkey serum and 0.3% PBS-T containing TH (1:2,000, mouse anti-TH, MAB318, Millipore), m-Cherry (1:500; rabbit anti-m-Cherry, ab167453, Abcam; or chicken anti-m-Cherry for cFos experiments and VTA cannula verification, ab205402 Abcam), and/or cFos (1:2,000, rabbit anti-cFos, ab190289, Abcam). The following day, sections were again rinsed with PBS and then incubated (2 hr) with the appropriate secondary antibodies diluted in 3% normal donkey serum and 0.3% PBS-T (for TH donkey anti-Mouse A488; for m-Cherry in cFos experiments and cannula verification donkey anti-chicken Cy3 or donkey anti-rabbit Cy3 for all other experiments; for cFos donkey anti-rabbit DyLight405. All secondary antibodies are diluted 1:200 and come from Jackson ImmunoResearch).
In GAD-Cre rats, brain sections containing the RMTg were processed for GAD67 immunoreactivity. Briefly, sections were washed and blocked as described above, and incubated overnight in GAD67 (mouse anti-GAD67, 1:5,000; MAB5406, EMDMillipore, Billerica). The following day, sections underwent a series of steps for Tyramide Signal Amplification (1 hr streptavidin-horseradish peroxidase, 15 min TSA-biotin using a TSA kit (Perkin Elmer). Sections were rinsed and then incubated with Streptavidin AF488 (1:200, Jackson ImmunoResearch).
A Leica DMR microscope was used to process images (5x,10x and/or 20x magnification) of viral expression. Image J 1.53a software was used to manually quantify the number of labeled cells for combined chemogenetics experiments and cFos activation. For combined chemogenetic quantification VTA images were taken at 10x magnification and neuronal counts were performed in all VTA slices expressing m-Cherry from −4.80 AP to −6.12 AP. For cFos quantification VTA images were taken at 20x magnification and 3 VTA slices of equivalent distance from bregma between −4.80 AP to −6.12 AP were quantified per animal. Cell counts were done by two independent researchers that were blinded to experimental results and treatments.
Photometry Acquisition:
For fiber photometry studies, rats were food restricted and trained in operant conditioning (Med Associates Inc.) as described in behavioral paradigm above. Fiber photometry recordings were made throughout the entirety of 2-hour progressive ratio operant conditioning sessions. Prior to recording during operant behavior sessions, an optic fiber was attached to the implanted fiber using a ferrule sleeve (Doric, ZR_2.5). Two LEDs were used to excite GCaMP6s. A 531-Hz sinusoidal LED light (Thorlabs, LED light: M470F3; LED driver: DC4104) was bandpass filtered (470 ± 20 nm, Doric, FMC4) to excite GCaMP6s and evoke Ca2+-dependent emission. A 211-Hz sinusoidal LED light (Thorlabs, LED light: M405FP1; LED driver: DC4104) was bandpass filtered (405 ± 10 nm, Doric, FMC4) to excite GCaMP6s and evoke Ca2+-independent isosbestic control emission. Laser intensity for the 470 nm and 405 nm wavelength bands were measured at the tip of the optic fiber and adjusted to 50 uW before each day of recording. GCaMP6s fluorescence traveled through the same optic fiber before being bandpass filtered (525 ± 25 nm, Doric, FMC4), transduced by a femtowatt silicon photoreceiver (Newport, 2151) and recorded by a real-time processor (TDT, RZ5P). The envelopes of the 531-Hz and 211-Hz signals were extracted in real-time by the TDT program Synapse version 95 at a sampling rate of 1017.25 Hz.
Experimental design and statistics:
All the experiments were successfully replicated at least twice, including each treatment condition to prevent an unspecific day/condition effect. Treatment groups were randomly assigned to animals prior to testing. No statistical methods were used to pre-determine sample sizes, but our sample sizes are similar to those reported in previous publications.17,19 After assessing the normality of sample data using D’Agostino & Pearson test and Shapiro-Wilk test, statistical significance was taken as *p < 0.05, **p < 0.01, ***p < 0.001, and ****p < 0.0001, as determined by two - way repeated-measures ANOVA followed by two tailed Sidak post hoc test, Friedman’s test, two tailed unpaired t test, two tailed paired t test, Kruskal-Wallis, two-tailed Dunn’s multiple comparisons test, two tailed Wilcoxon test, two-tailed uncorrected Dunn’s test, Dunnett’s multiple comparisons test, Kolmogorov-Smirnov test, one sample t test, two tailed Mann-Whitney for unpaired values as appropriate. For correlation analysis between neuronal counts and percent motivation change (Figure 3i–k) Hartigan dip test was used to test for non-unimodality (permutation number = 20 000), followed by comparison of medians in non-parametric way using Wilcoxon Rank Sum test. Correlation within the bimodally distributed groups, or all data combined was performed using Spearman test. No outliers were excluded from the any of the studies presented in this manuscript.
All data are expressed as mean ± SEM. Sample sizes (N number) always refers to value obtained form an individual animal in all behavioral experiments (Figures 1, 3, 4, 5 and 6), individual cell recordings (Figure 2, 6) or slice analysis (Supplementary figure 3). Statistical analyses were performed in GraphPad Prism 8.1.0 and MatLab. Data collection and analysis were performed blinded to the conditions of the experiments.
Custom MatLab scripts were developed for analyzing fiber photometry data in context of rat behavior. The isosbestic 405 nm excitation control signal was subtracted from the 470 nm excitation signal to remove movement artifacts from intracellular Ca2+-dependent GCaMP6s fluorescence. Baseline drift was evident in the signal due to slow photobleaching artifacts, particularly during the first several minutes of each 2-hour recording session. A double exponential curve was fit to the raw trace and subtracted to correct for baseline drift. After baseline correction, the photometry trace was normalized to units of “ΔF/F”, using the median fluorescence of the entire session for subtraction and division. The post-processed fiber photometry signal was analyzed in the context of progressive ratio task performance. For equivalent comparison between baseline and post-CFA PR sessions, analysis of mean fluorescence relative to lever press times and reward attainment times was restricted to the minimum number of lever presses (first 34 lever presses per session) and rewards (first 6 rewards per session) obtained by an animal within a given session. “Transient event rate” for individual sessions was determined by identifying local maxima in ΔF/F photometry signal that resemble the waveform and temporal dynamics of GCaMP6s calcium transients. Built-in MatLab function “findpeaks” was used to identify local maxima that were at least 1.2% ΔF/F in prominence and at least 150 ms in width at half prominence (Supplementary figure 1). For quantification of fluorescence during lever pressing, mean ΔF/F was calculated −3 to 0 seconds relative to each lever press. For quantification of fluorescence during reward delivery, max ΔF/F was calculated 2–5 seconds relative to reward delivery to account for latency in pellet consumption.
Extended Data
Extended Data Fig. 1. Spread of viral expression and fiber optic placement in the VTA.
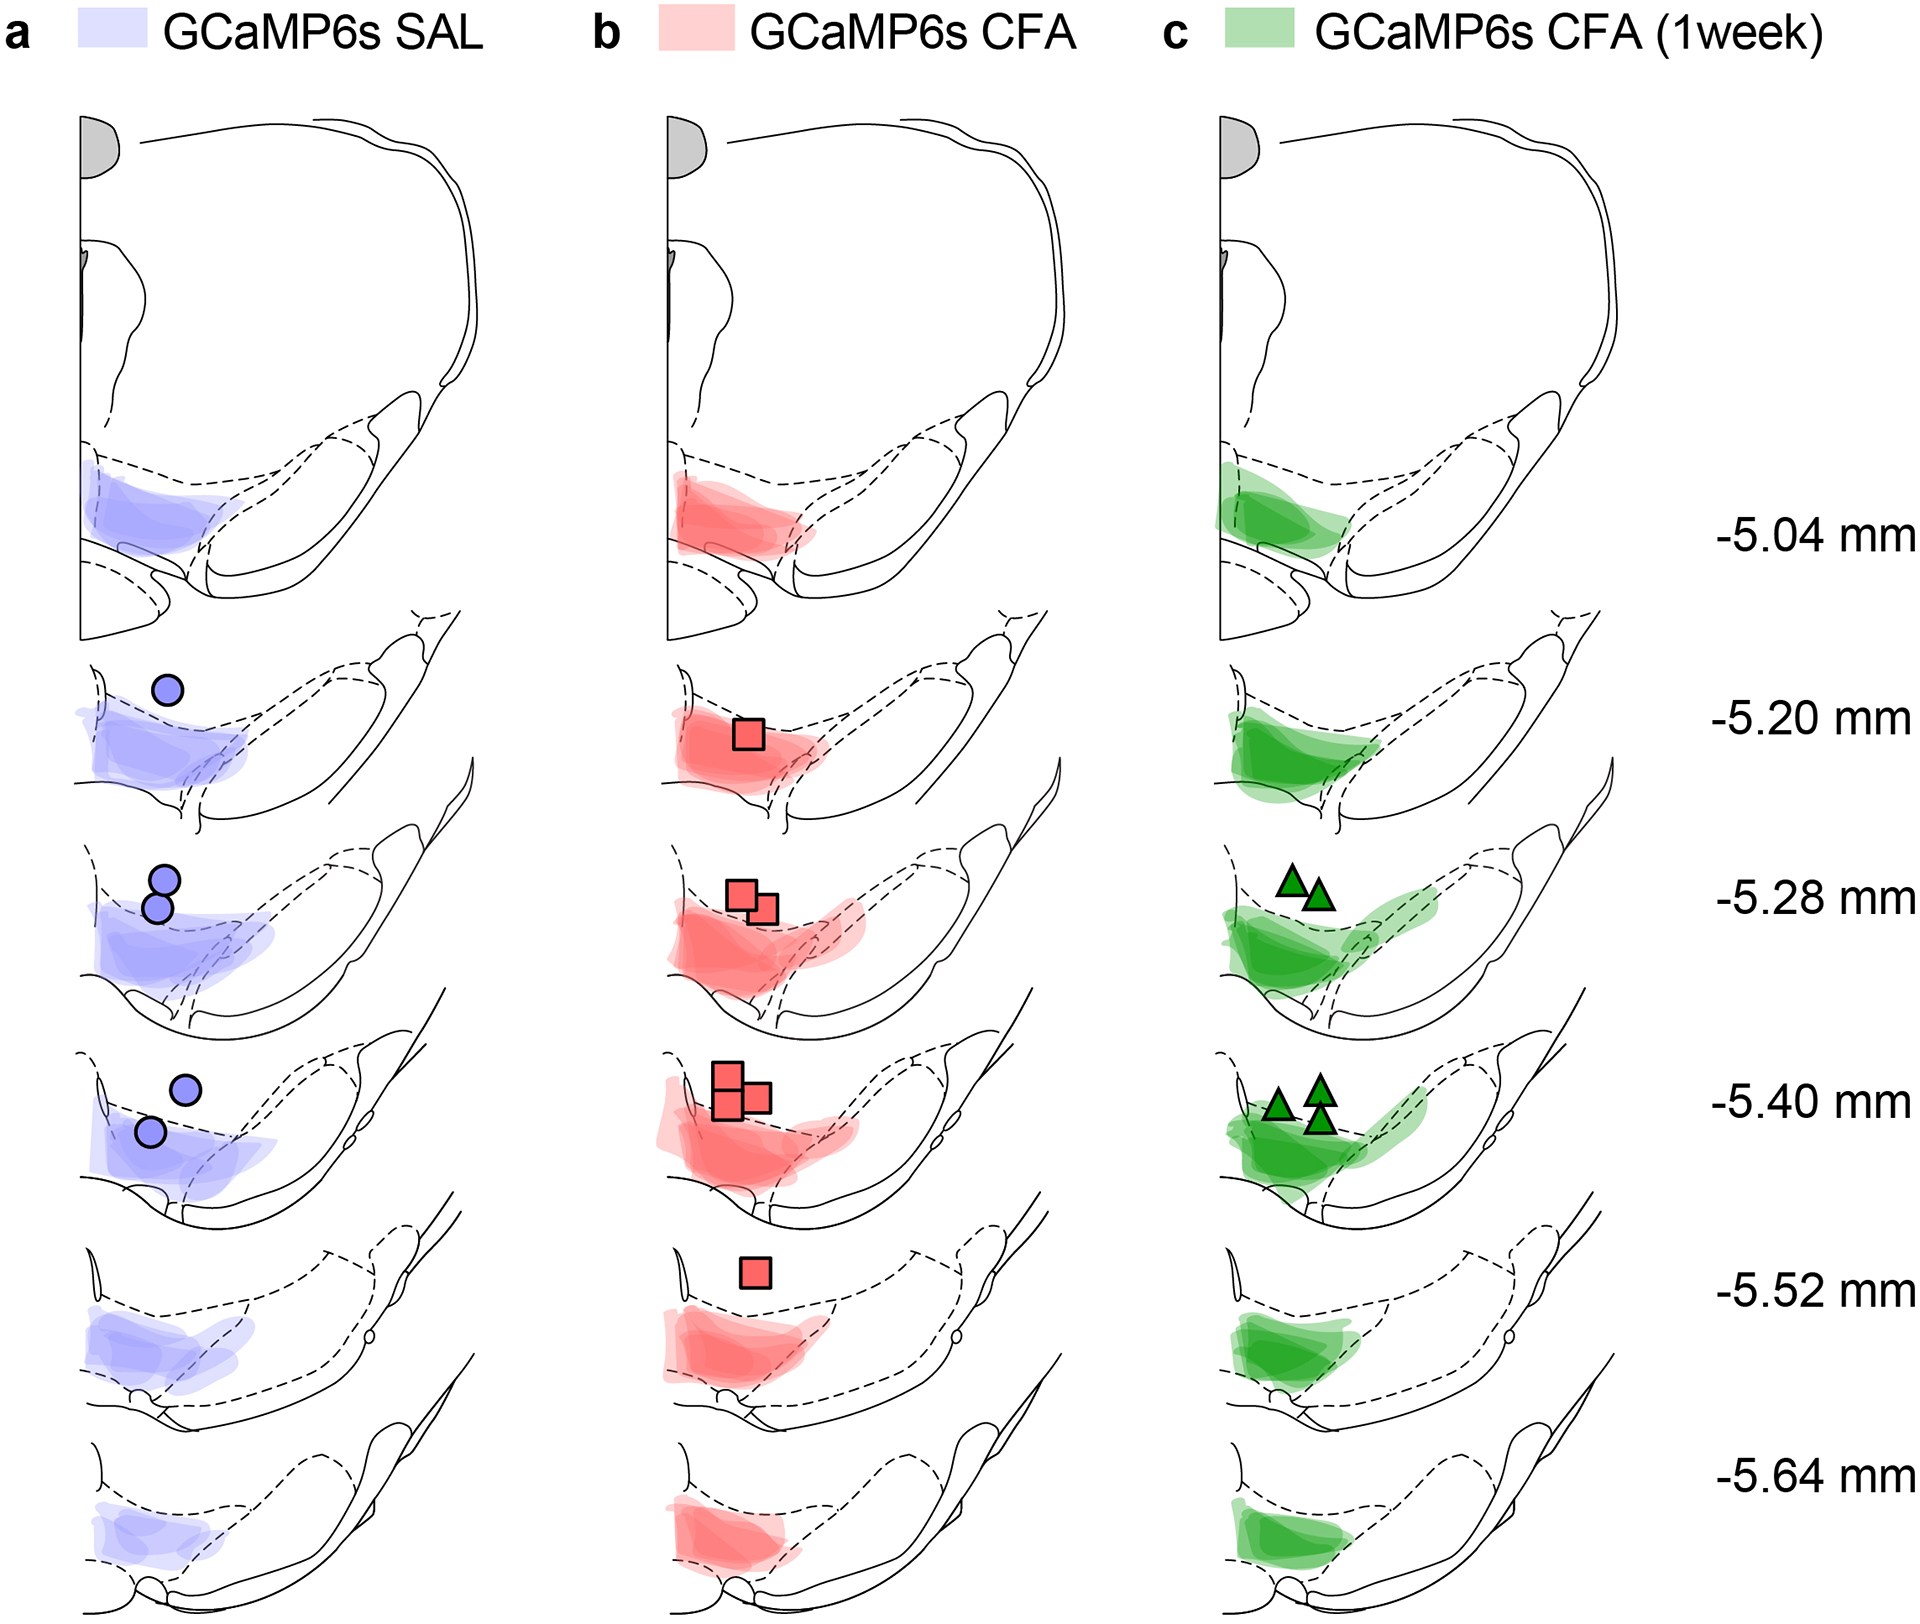
a–c Spread of overlay of individual animal viral expression and fiber optic placement across the VTA in GCaMP6s injected TH-cre animals.
Extended Data Fig. 2. VTA DA neuron aligned to reward seeking.
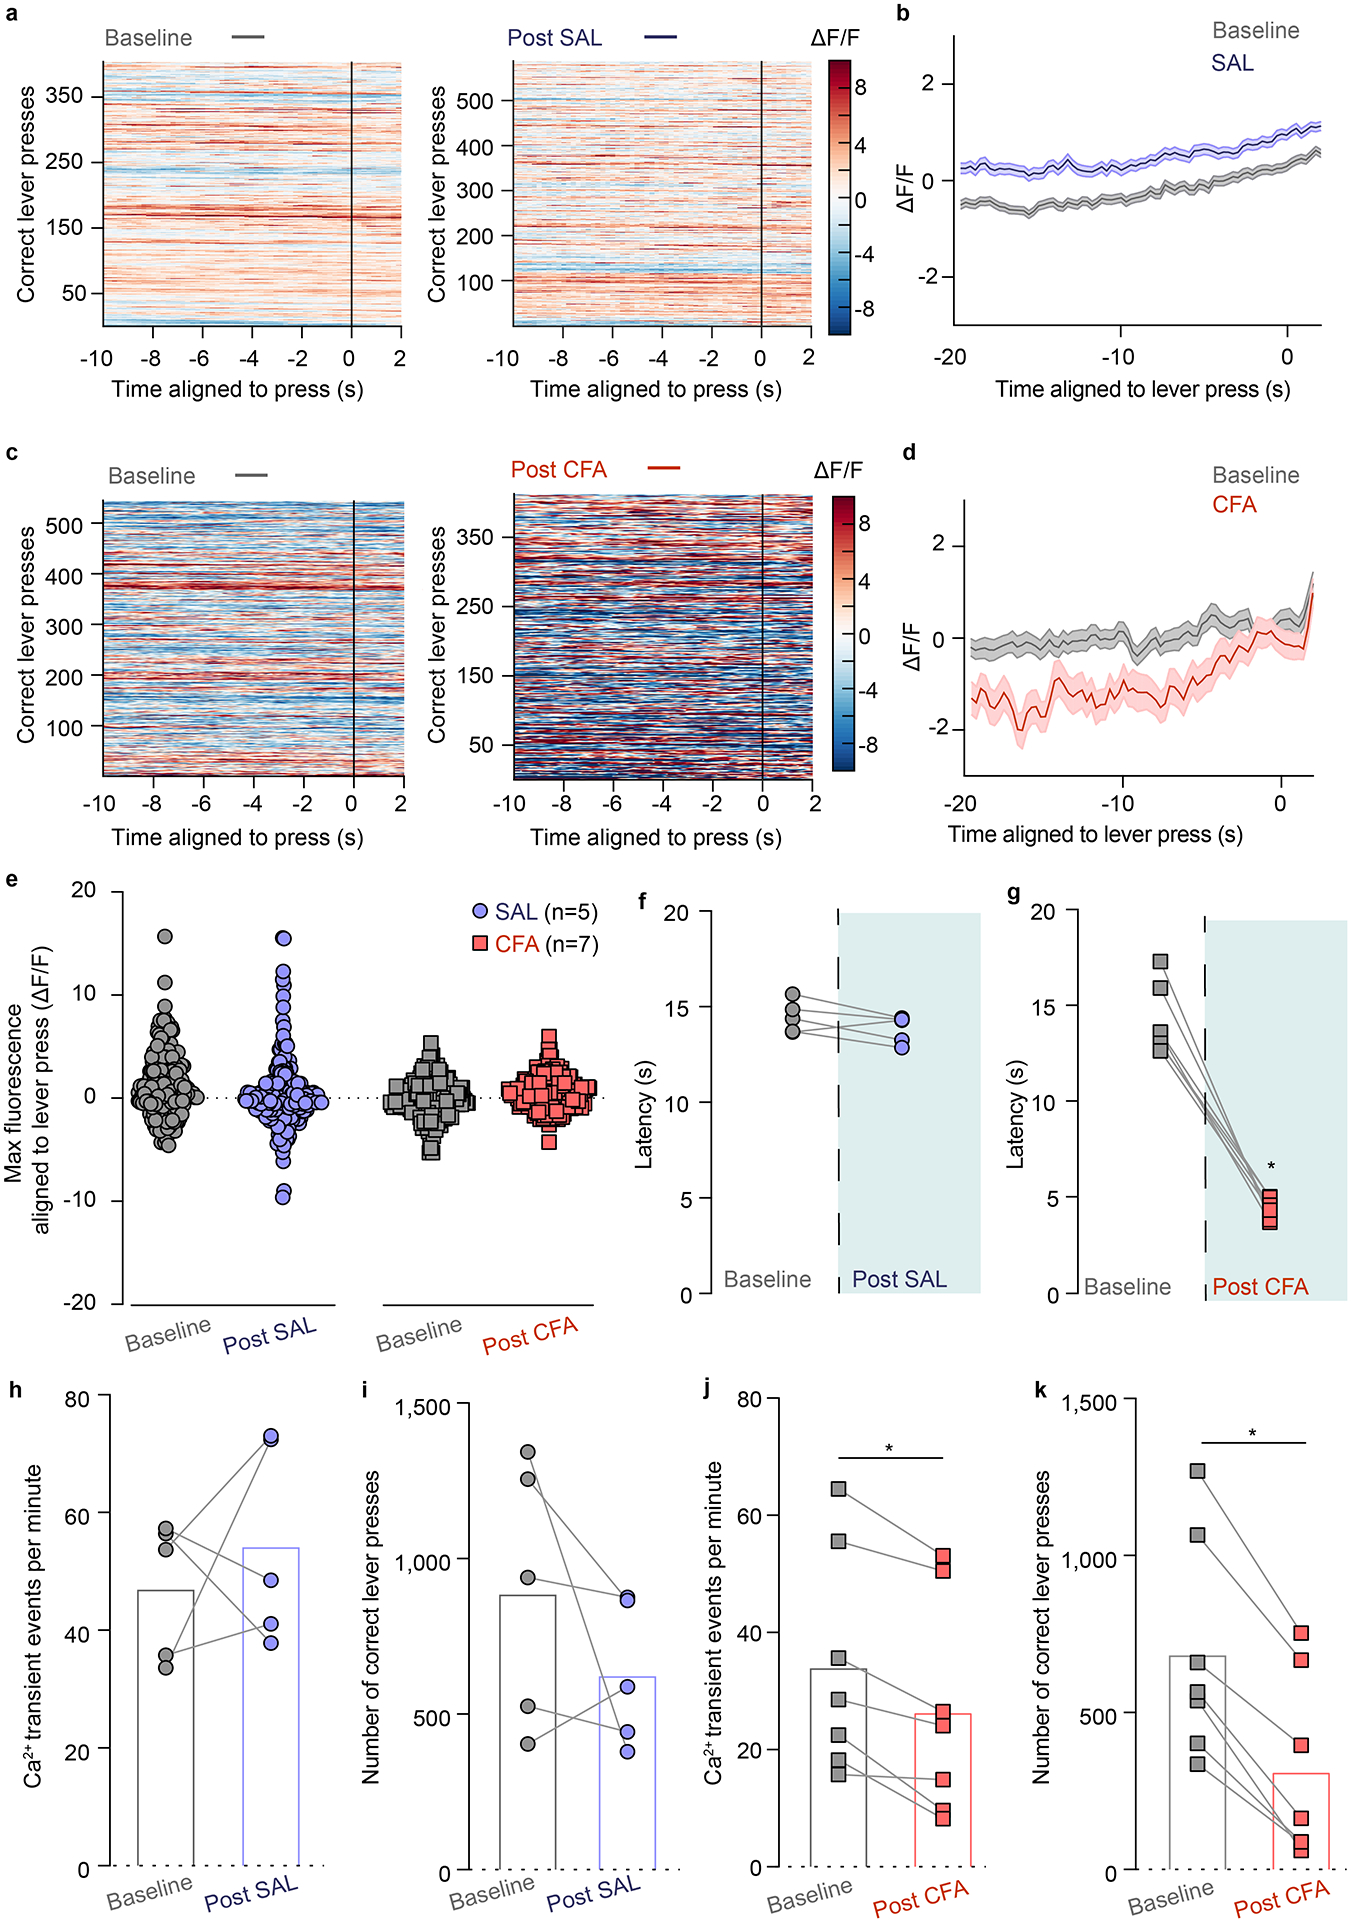
a. Representative heat-maps of fluorescence aligned to the lever press (time point 0) for baseline (grey) and post-SAL (blue) PR sessions for same animal. b. Mean fluorescence aligned to lever press for baseline (grey) and post-SAL (blue) PR sessions (n = 5 rats; data presented as mean ± s.e.m) c. Representative heat-maps of fluorescence aligned to the lever press (time point 0) for baseline (grey) and post-CFA (red) PR sessions for same animal. d. Mean fluorescence aligned to lever press for baseline (grey) and post-CFA (red) PR sessions (n = 7 rats; data presented as mean ± s.e.). e. Maximum fluorescence aligned to lever press is not altered in either CFA or saline injected animals as compared to their respective baseline. f. Saline injection does not alter latency of paw withdrawal to noxious stimulus using Hargraves test. g. Latency to withdraw a paw from a noxious stimulus is decreased in CFA, resulting in hyperalgesia (two tailed Wilcoxon test, * p = 0.0156, n = 7 rats). h. Transient events per minute of VTA DA neurons throughout the PR sessions are not altered after the injection of saline. i. Saline doesn’t affect the numbers of correct lever presses during PR session. j. CFA decreases overall frequency of VTA DA neurons calcium transients during PR session (two tailed Wilcoxon test, * p = 0.0156, n = 7 rats). k. CFA decreases the number of correct lever presses during PR session (two-tailed Wilcoxon test, * p = 0.0156, n=7 rats).
Extended Data Fig. 3. Intrinsic excitability of VTA DA neurons is decreased in CFA injected animals.
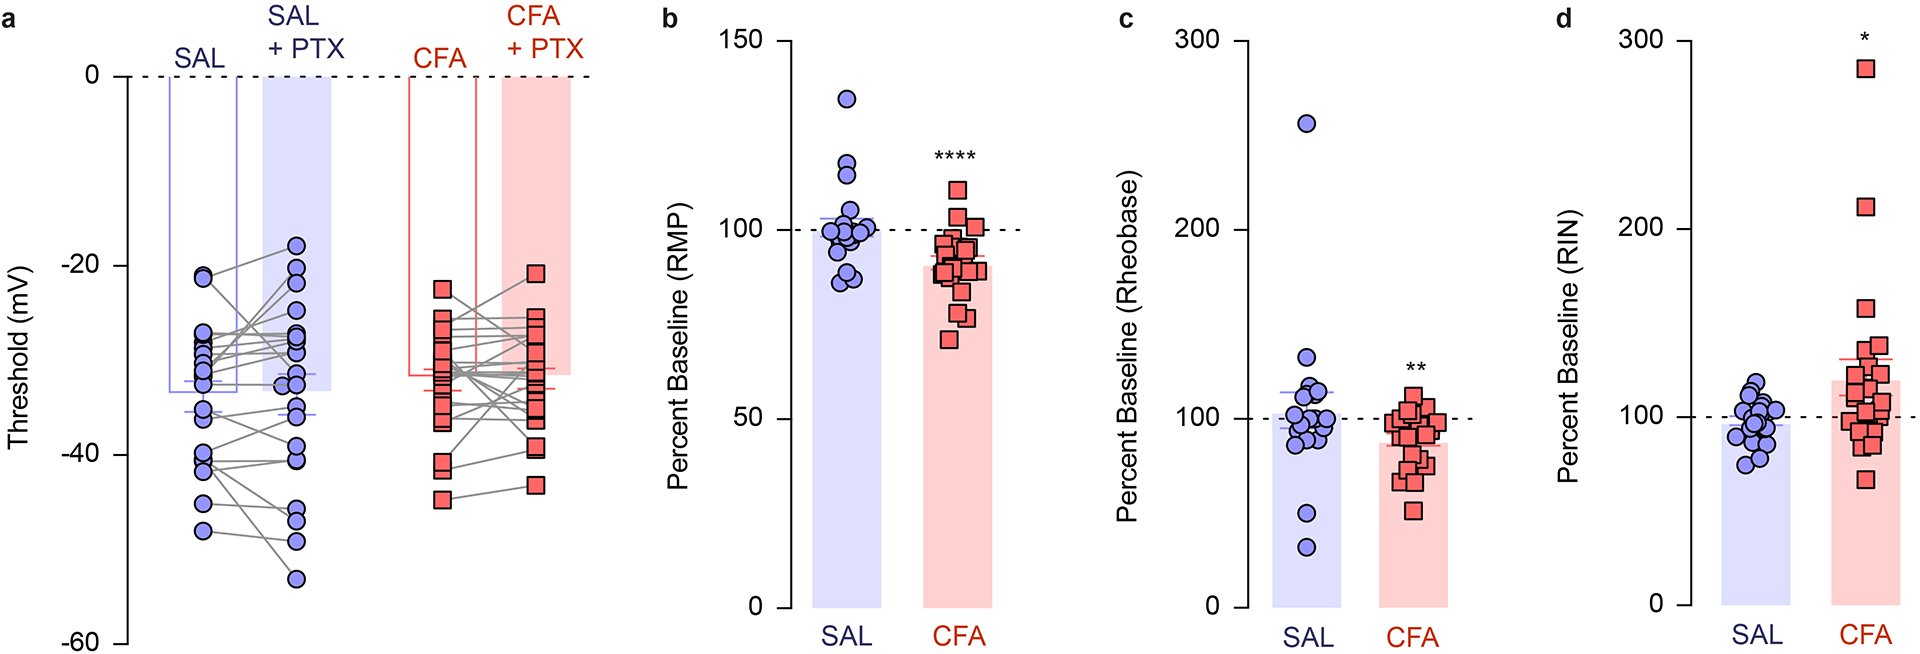
a. Action potential threshold is not altered in either by CFA or upon application of PTX (n (SAL) = 21 cells from 5 rats, n (CFA) = 23 cells from 4 rats). b. Application of picrotoxin (PTX) further depolarized cells from the CFA group while it has no effect on the cells from saline injected animals (one sample t test compared to 100 percent, CFA, **** p < 0.0001, n (SAL) = 21 cells from 5 rats, n (CFA) = 23 cells from 4 rats). c. Application of picrotoxin (PTX) decreases the amount of current required to depolarize cells to fire an action potential in CFA treated animals (one sample t test compared to 100 percent, CFA, ** p = 0.0031, n (SAL) = 20 cells from 5 rats, n (CFA) = 22 cells from 4 rats). d. PTX increased input resistance in CFA but not saline treated animals (one sample t test compared to 100 percent, CFA, * p = 0.0373, n (SAL) = 21 cells from 5 rats, n (CFA) = 23 cells from 4 rats). The data are presented as the mean ± s.e.m.
Extended Data Fig. 4. Chemogenetic activation of VTA DA neurons, or VTA-NAcSh pathway reverses CFA induced decrease in number of correct lever presses for sucrose rewards in PR task.
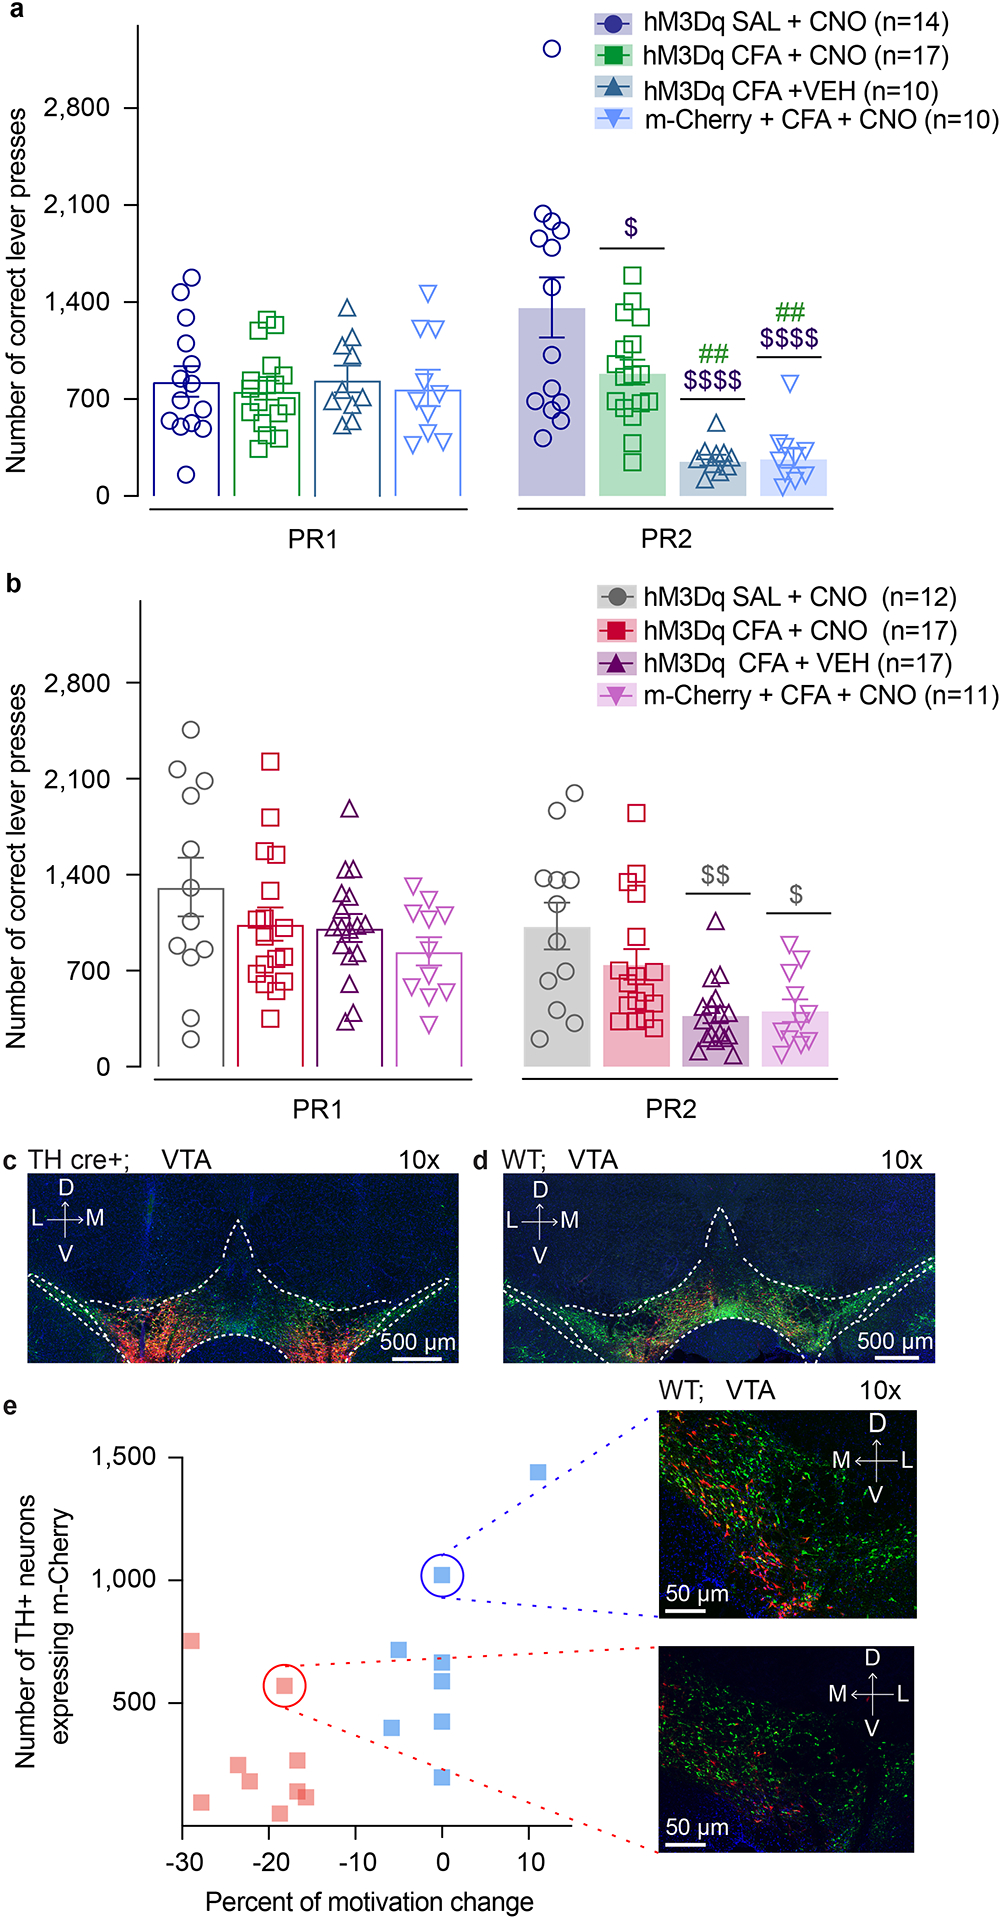
a. Activation of DA containing neurons in the VTA reverses CFA induced decrease in number of correct lever presses in sucrose PR. Animals injected with control virus and CNO alone showed decrease in the number of correct lever presses after the CFA injection (two-way ANOVA for repeated measures, time: F1, 47 = 3.361, p=0.0731; interaction (time × treatment): F3, 47 = 21.02, p<0.0001; Sidak’s post hoc between groups during PR2: hM3Dq + CFA + VEH (n=10) versus hM3Dq + SAL+ CNO (n=14) , $$$$ p<0.001, hM3Dq + CFA + VEH versus hM3Dq + CFA+ CNO (n=17), ## p=0.002; m-Cherry + CFA + CNO (n=10) versus hM3Dq + SAL+ CNO, $$$$ p<0.0001, m-Cherry + CFA + CNO versus hM3Dq + CFA+ CNO, ## p=0.0028), hM3Dq + CFA+ CNO versus hM3Dq + SAL+ CNO, $ p=0.0188). b. Activation of NAcSh projecting VTA neurons reverses CFA induced decrease in number of correct lever presses in sucrose PR. Control CFA animals injected with either CNO or virus alone show decrease in number of correct lever presses in sucrose PR (two-way ANOVA for repeated measures, time: F1, 53 = 87.59, p<0.0001; interaction (time × treatment): F3, 53 = 4.036, p=0.0117; Sidak’s post hoc during PR2 between the groups: hM3Dq + CFA + VEH (n=17) versus hM3Dq + SAL + CNO (n=12), $$ p=0.0021, m-Cherry + CFA + CNO (n=11) versus hM3Dq + SAL+ CNO, $ p=0.0116). The data are presented as the mean ± s.e.m. c. Representative coronal section of VTA DREADD expressing neurons. Blue – DAPI; Red – m-Cherry (Gq DREADD); Green – TH (DA neurons). Schematic representation of viral injections for Gq DREADD injected TH cre+ rats used for chemogenetic experiments in Figure 3 a–d. d. Representative coronal section of VTA Gq DREADD expressing neurons. Blue – DAPI; Red – m-Cherry (Gq DREADD); Green – TH (DA neurons). Schematic representation of viral injections for Gq DREADD injected wild type rats used in chemogenetics experiment in Figure 3 e–k. e. Representative images of low viral infection rate (red dotted line) correlated with decrease in motivation (red circle) and high viral infection rate (blue dotted line) correlated with no change in motivation (blue circle) during PR test using intersectional chemogenetics in CFA treated animals.
Extended Data Fig. 5. Spread of viral expression in the VTA.
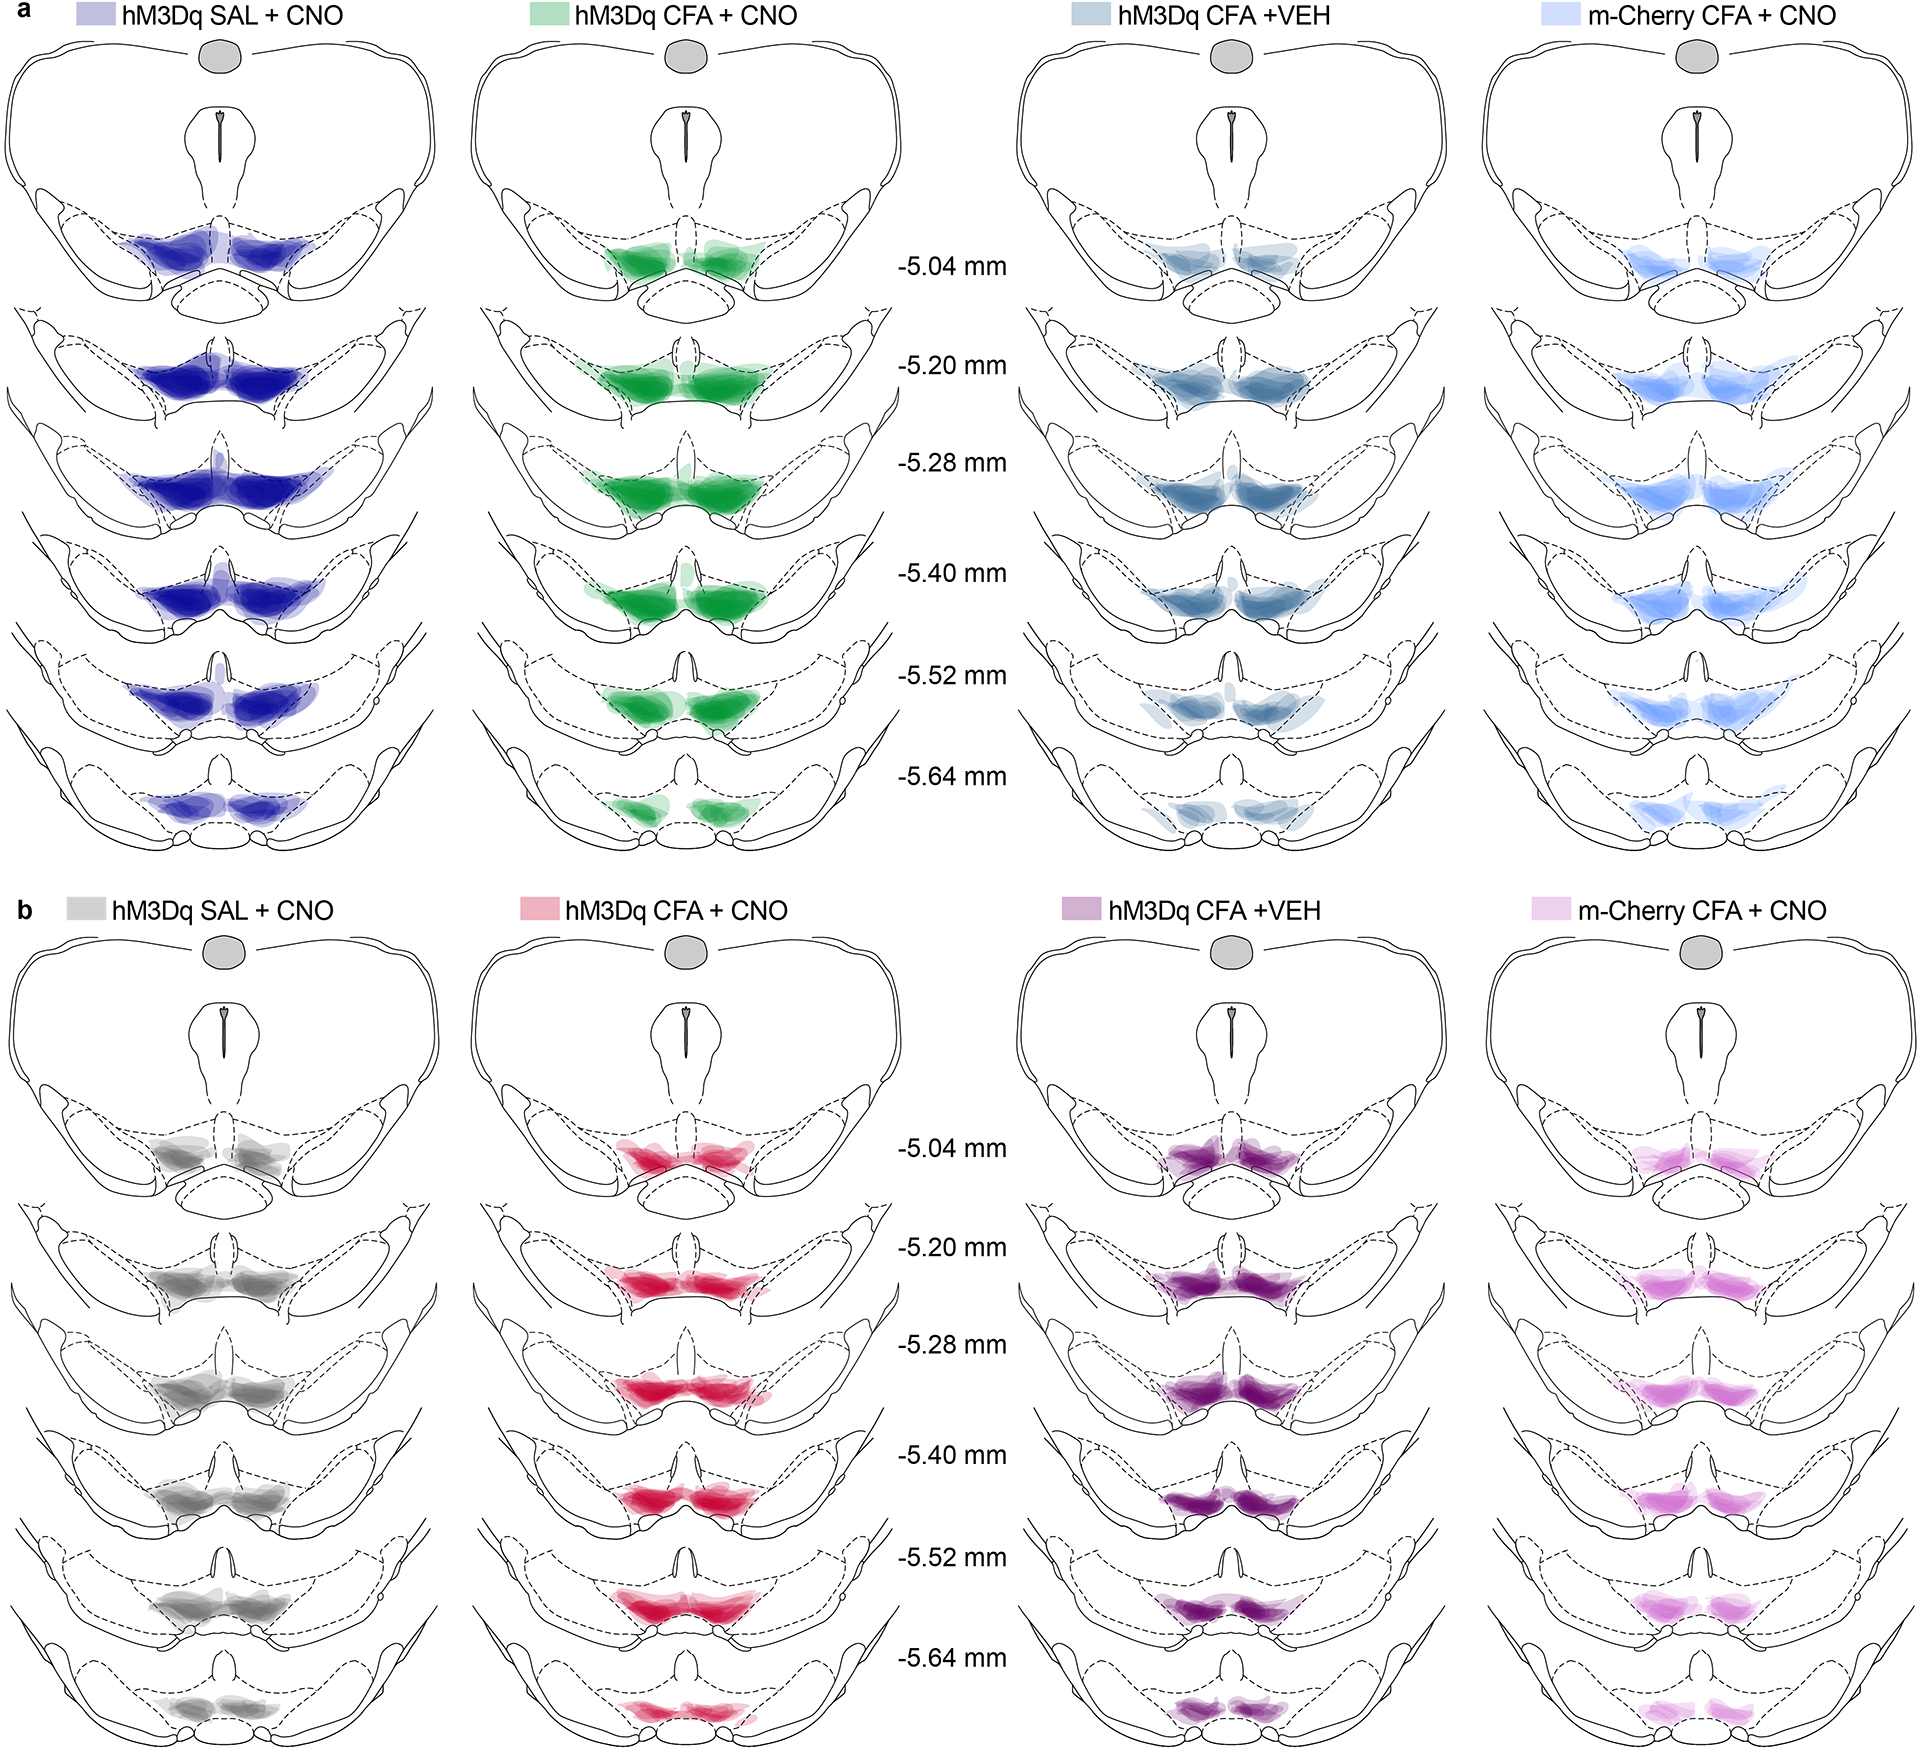
a. Spread of overlay of individual animal viral expression across VTA in DREADD and control m-Cherry injected TH-cre animals used in Figure 3 b–d. b. Spread of overlay of individual animal viral expression across VTA in DREADD and control m-Cherry injected WT animals used in Figure 3 f–k.
Extended Data Fig. 6. Chemogenetic activation of NAcSH projecting VTA DA neurons, prevents CFA induced decrease in number of correct lever presses for sucrose rewards in PR task.
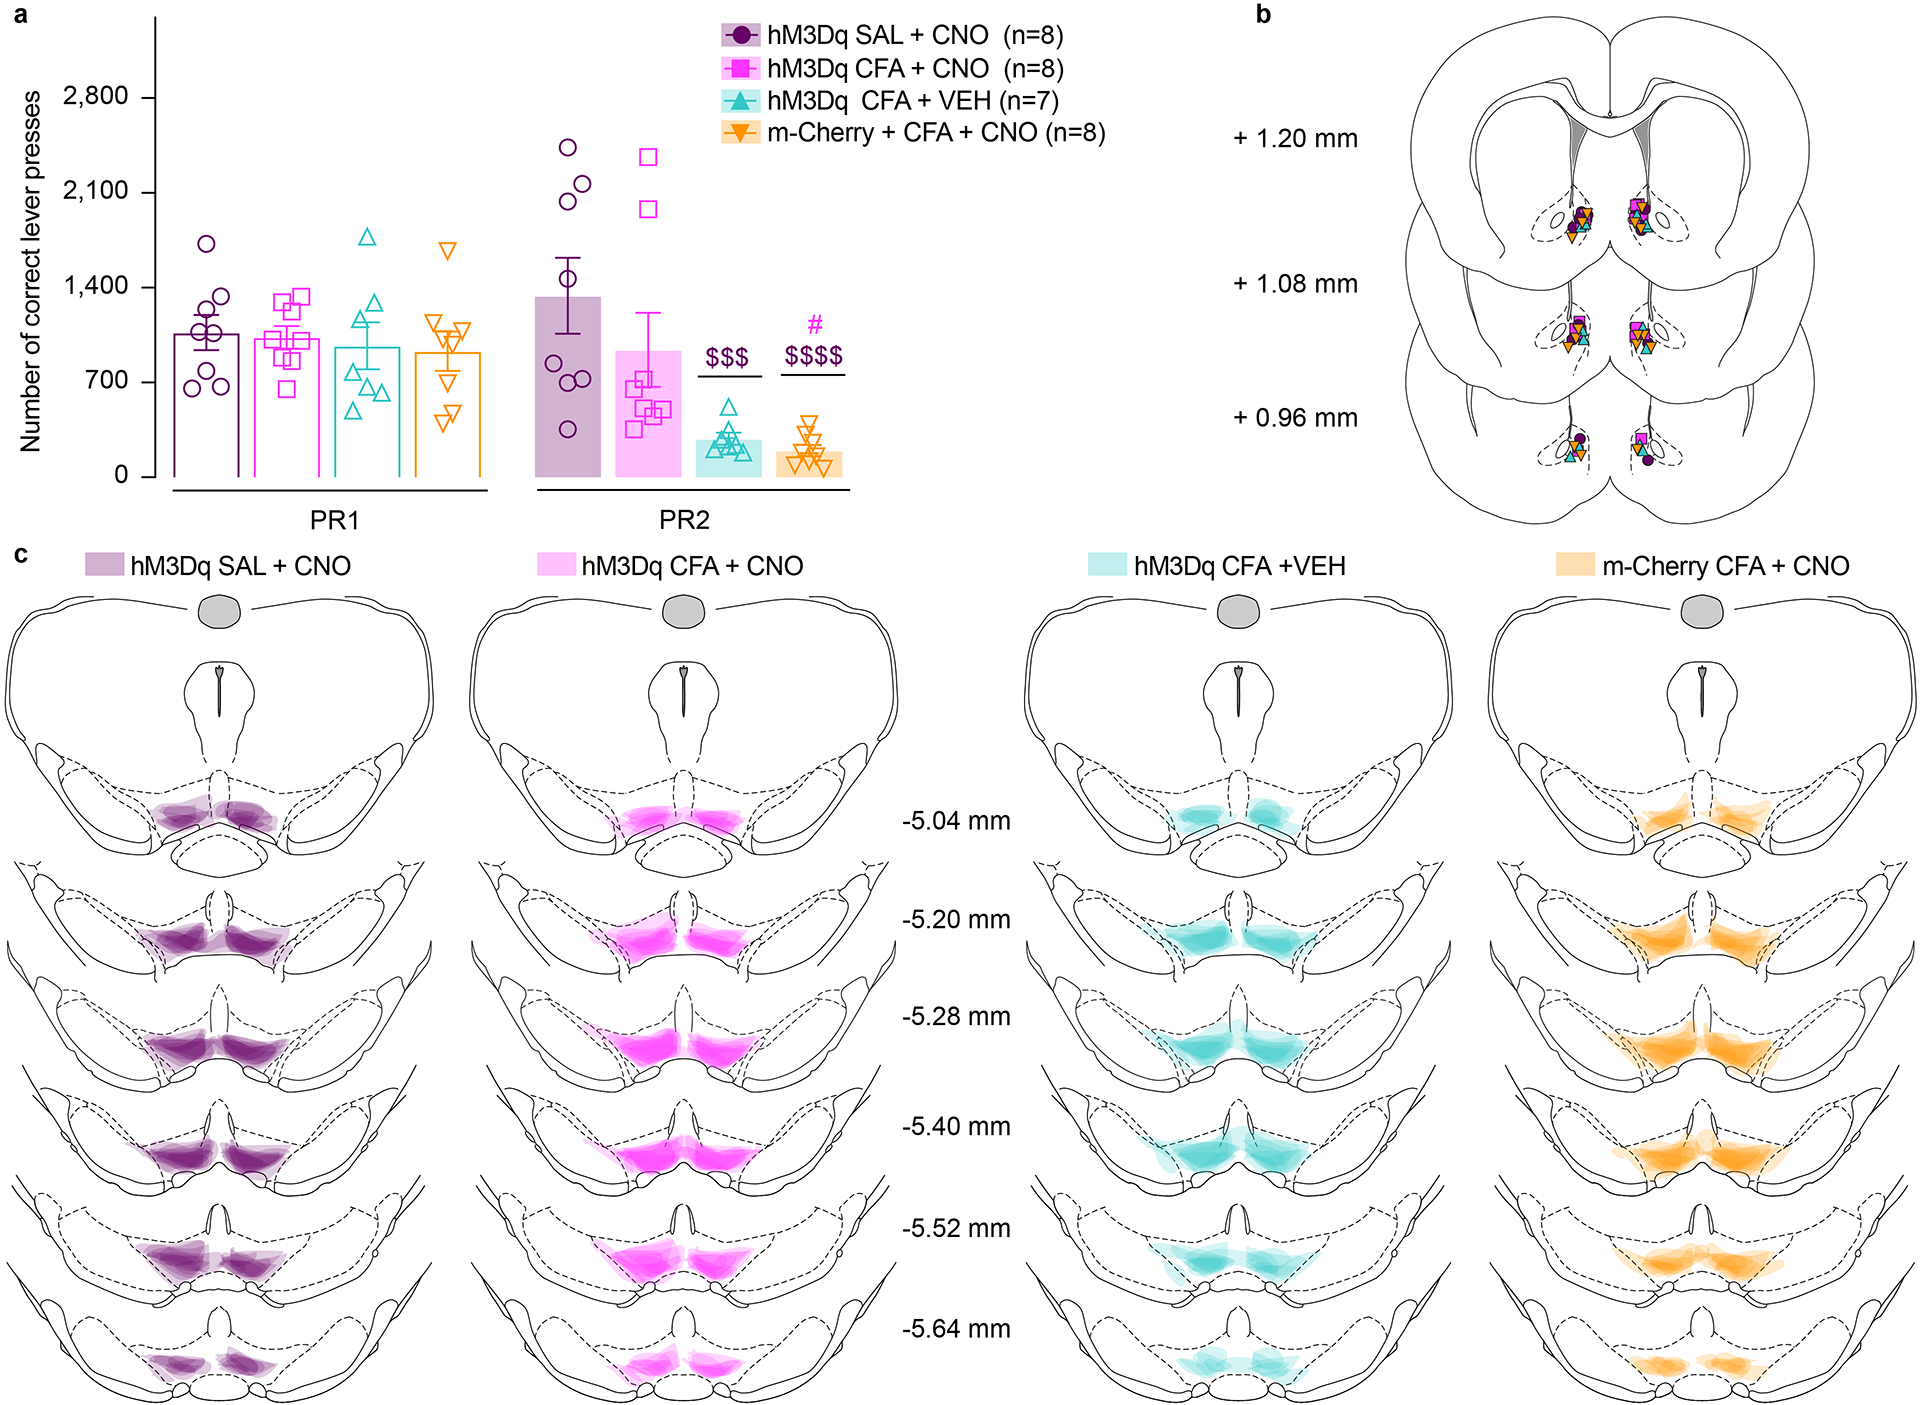
a. Activation of DA containing NAcSh projecting VTA neurons prevents CFA induced decrease in number of correct lever presses in sucrose PR. Animals injected with control virus and CNO alone showed decrease in the number of correct lever presses after the CFA injection (two-way ANOVA for repeated measures, time: F1, 27 = 8.016, p=0.0087; interaction (time × treatment): F3, 27 = 4.966, p=0.0071; Sidak’s post hoc between groups during PR2: hM3Dq + CFA + VEH (n=7) versus hM3Dq + SAL+ CNO (n=8) , $$$ p=0.0005; m-Cherry + CFA + CNO (n=8) versus hM3Dq + SAL+ CNO, $$$$ p<0.0001, m-Cherry + CFA + CNO versus hM3Dq + CFA+ CNO(n=8), # p=0.0190). b. Schematic representation of cannula placement in the NAcSh for local delivery of aCSF or CNO. c. Spread of overlay of individual animal viral expression across VTA in DREADD and control m-Cherry injected TH-cre animals. The data are presented as the mean ± s.e.m.
Extended Data Fig. 7. CFA does not alter intake of water during the sucrose two-bottle choice experiment.
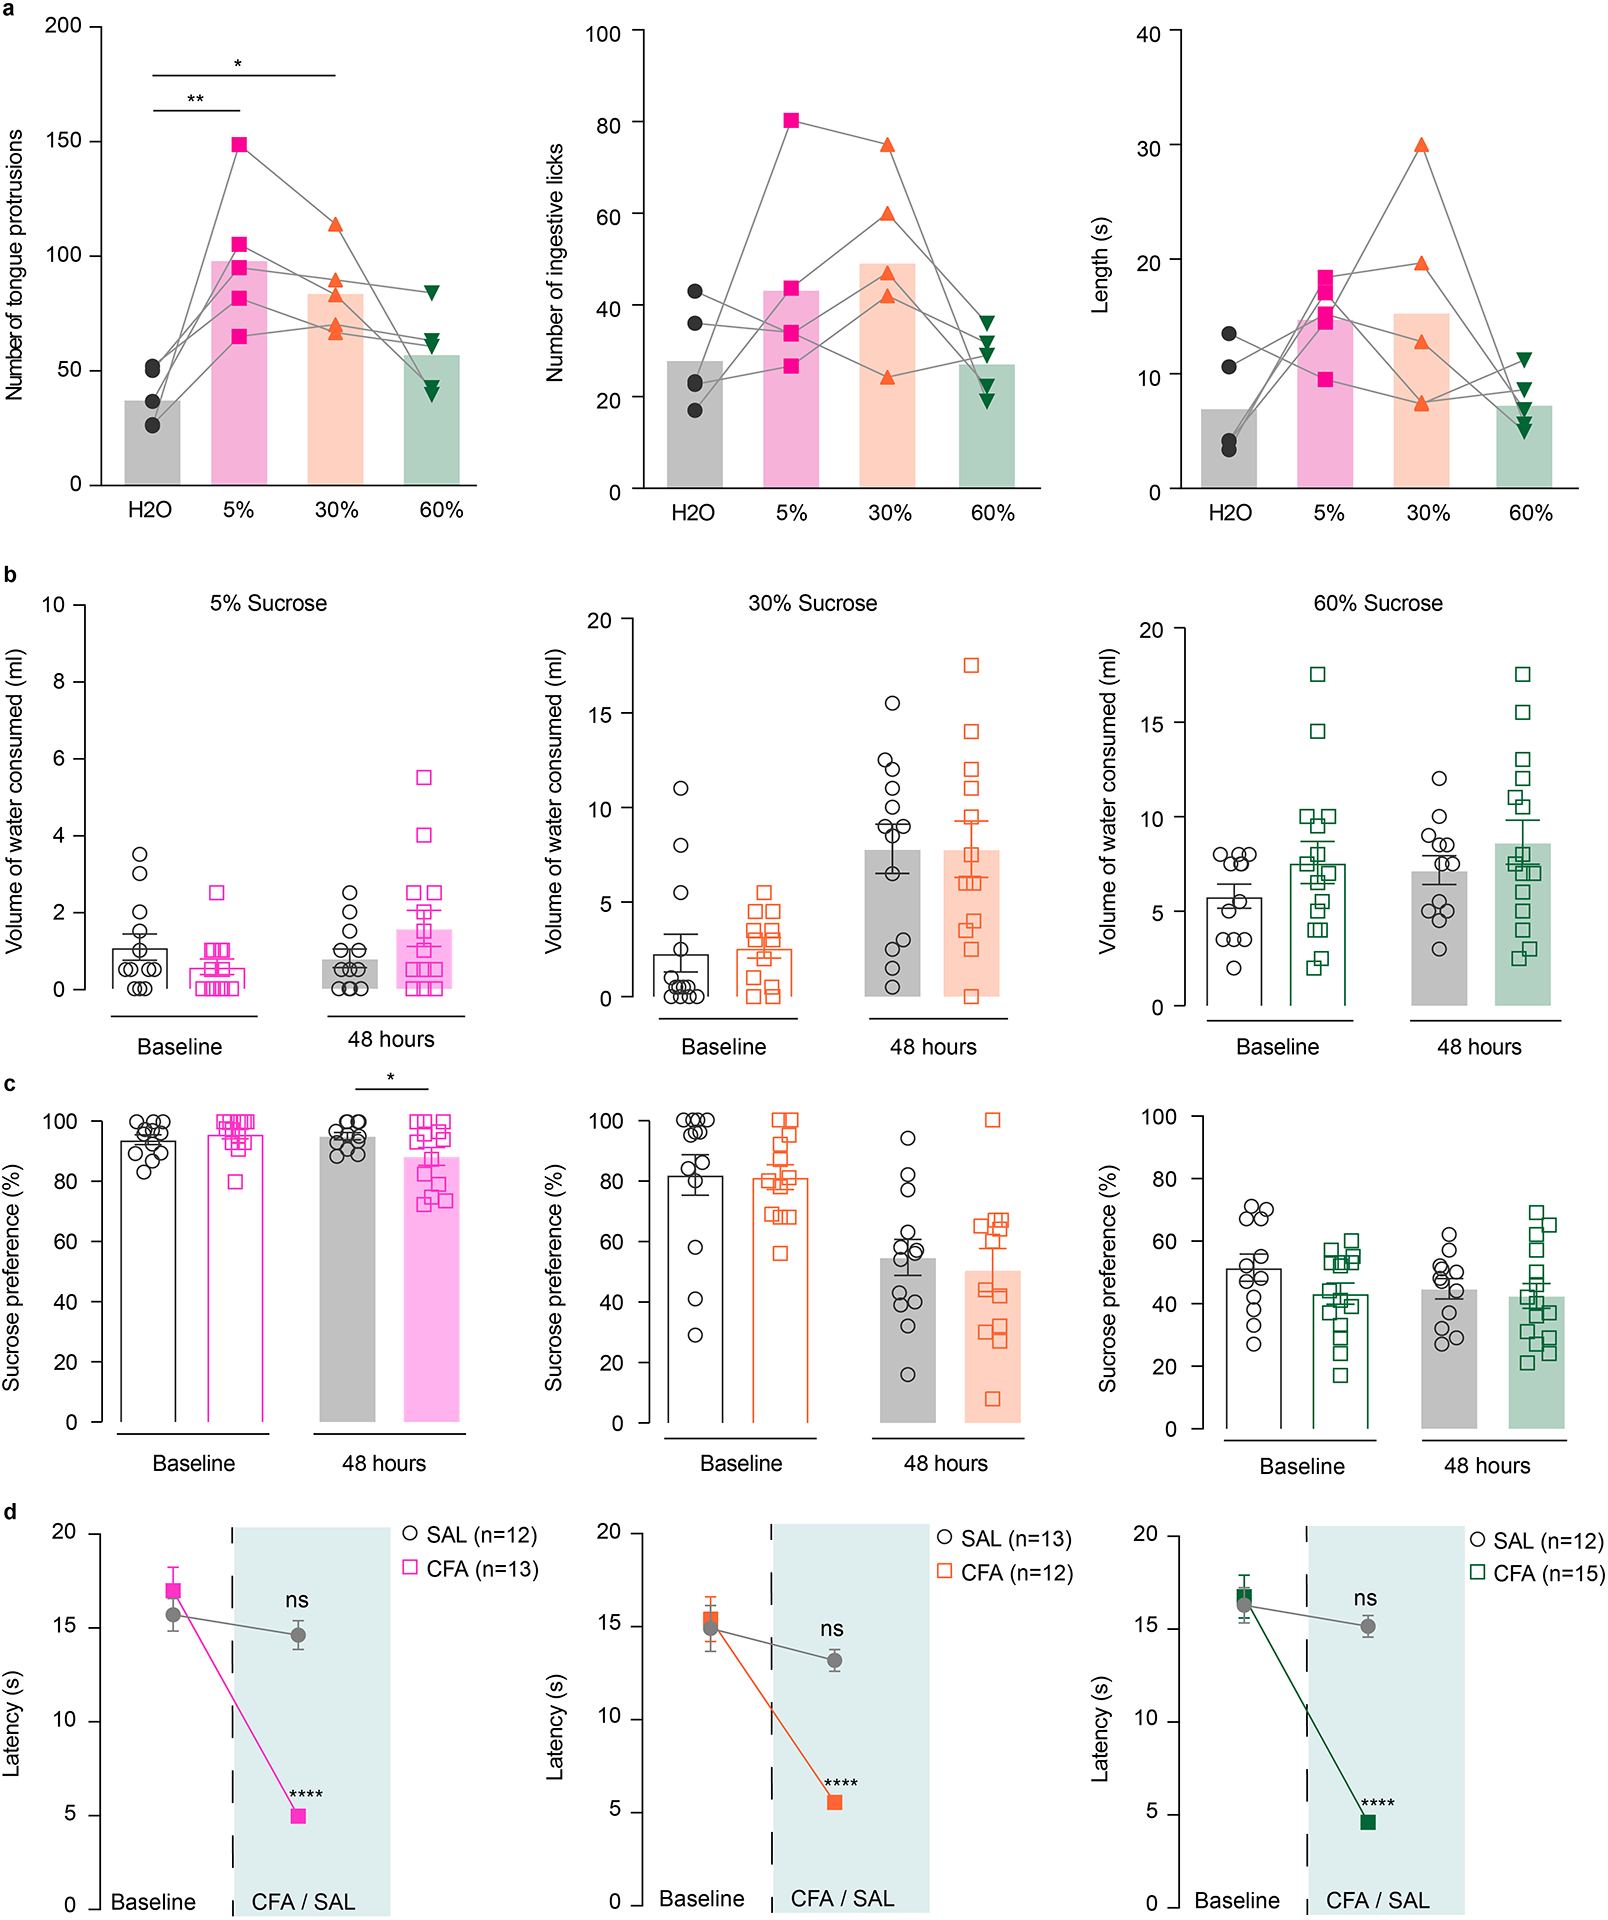
a. 5% and 30% sucrose significantly increased consummatory protrusions as compared to water, with similar trend being seeing with 60% sucrose as well (ANOVA Friedman’s test, **** p < 0.0001; two-tailed Dunn’s multiple comparisons post hoc: 5% sucrose versus water, ** p = 0.0036; 30% sucrose versus water, * p = 0.0423, n = 5 rats). No changes are observed in number of ingestive licks or the length of the lick between different concentrations. b. Volume of water consumed is not changed after the CFA injection during either 5% (CFA (n = 13 rats), SAL (n=12 rats)), 30% (CFA (n=12 rats) and SAL (n=13 rats)) or 60% (CFA (n = 15 rats), SAL (n = 12 rats)) sucrose two-bottle choice. c. CFA decreases 5% sucrose preference during two-bottle choice (open bars-baseline, filled bars – 48 hours post CFA/SAL. two-way ANOVA for repeated measures, time: F1, 23 = 2.339, p=0.1398; interaction (time × treatment): F1, 23 = 4.446, p=0.0461; Sidak’s post hoc within group: CFA (n=13) baseline versus 48 hours post CFA, * p=0.03), while it has no effect on 30% or 60% sucrose preference. d. CFA decreases latency to withdrawal from a noxious stimulus resulting in hyperalgesia (two-way ANOVA for repeated measures, 5% sucrose (CFA (n = 13 rats), SAL (n=12 rats)), time: F1,23 = 91.75, p<0.0001; interaction (time × treatment): F1,23 = 63.86, p<0.0001; Sidak’s post hoc for each group as compared to the group’s baseline session: **** p<0.0001; 30% sucrose (CFA (n=12 rats) and SAL (n=13 rats)) time: F1,23 = 40.71, p<0.0001; interaction (time × treatment): F1,23 = 20.02, p=0.0002; Sidak’s post hoc for each group as compared to the group’s baseline session: **** p<0.0001; 60% sucrose 60% (CFA (n = 15 rats), SAL (n = 12 rats)) time: F1,25 = 72.34, p<0.0001; interaction: F1,25 = 43.85, p<0.0001; Sidak’s post hoc for each group as compared to the group’s baseline session: **** p<0.0001). The data are presented as the mean ± s.e.m.
Extended Data Fig. 8. Chemogenetic stimulation of VTA DA neurons does not alter water intake in two-bottle choice test.
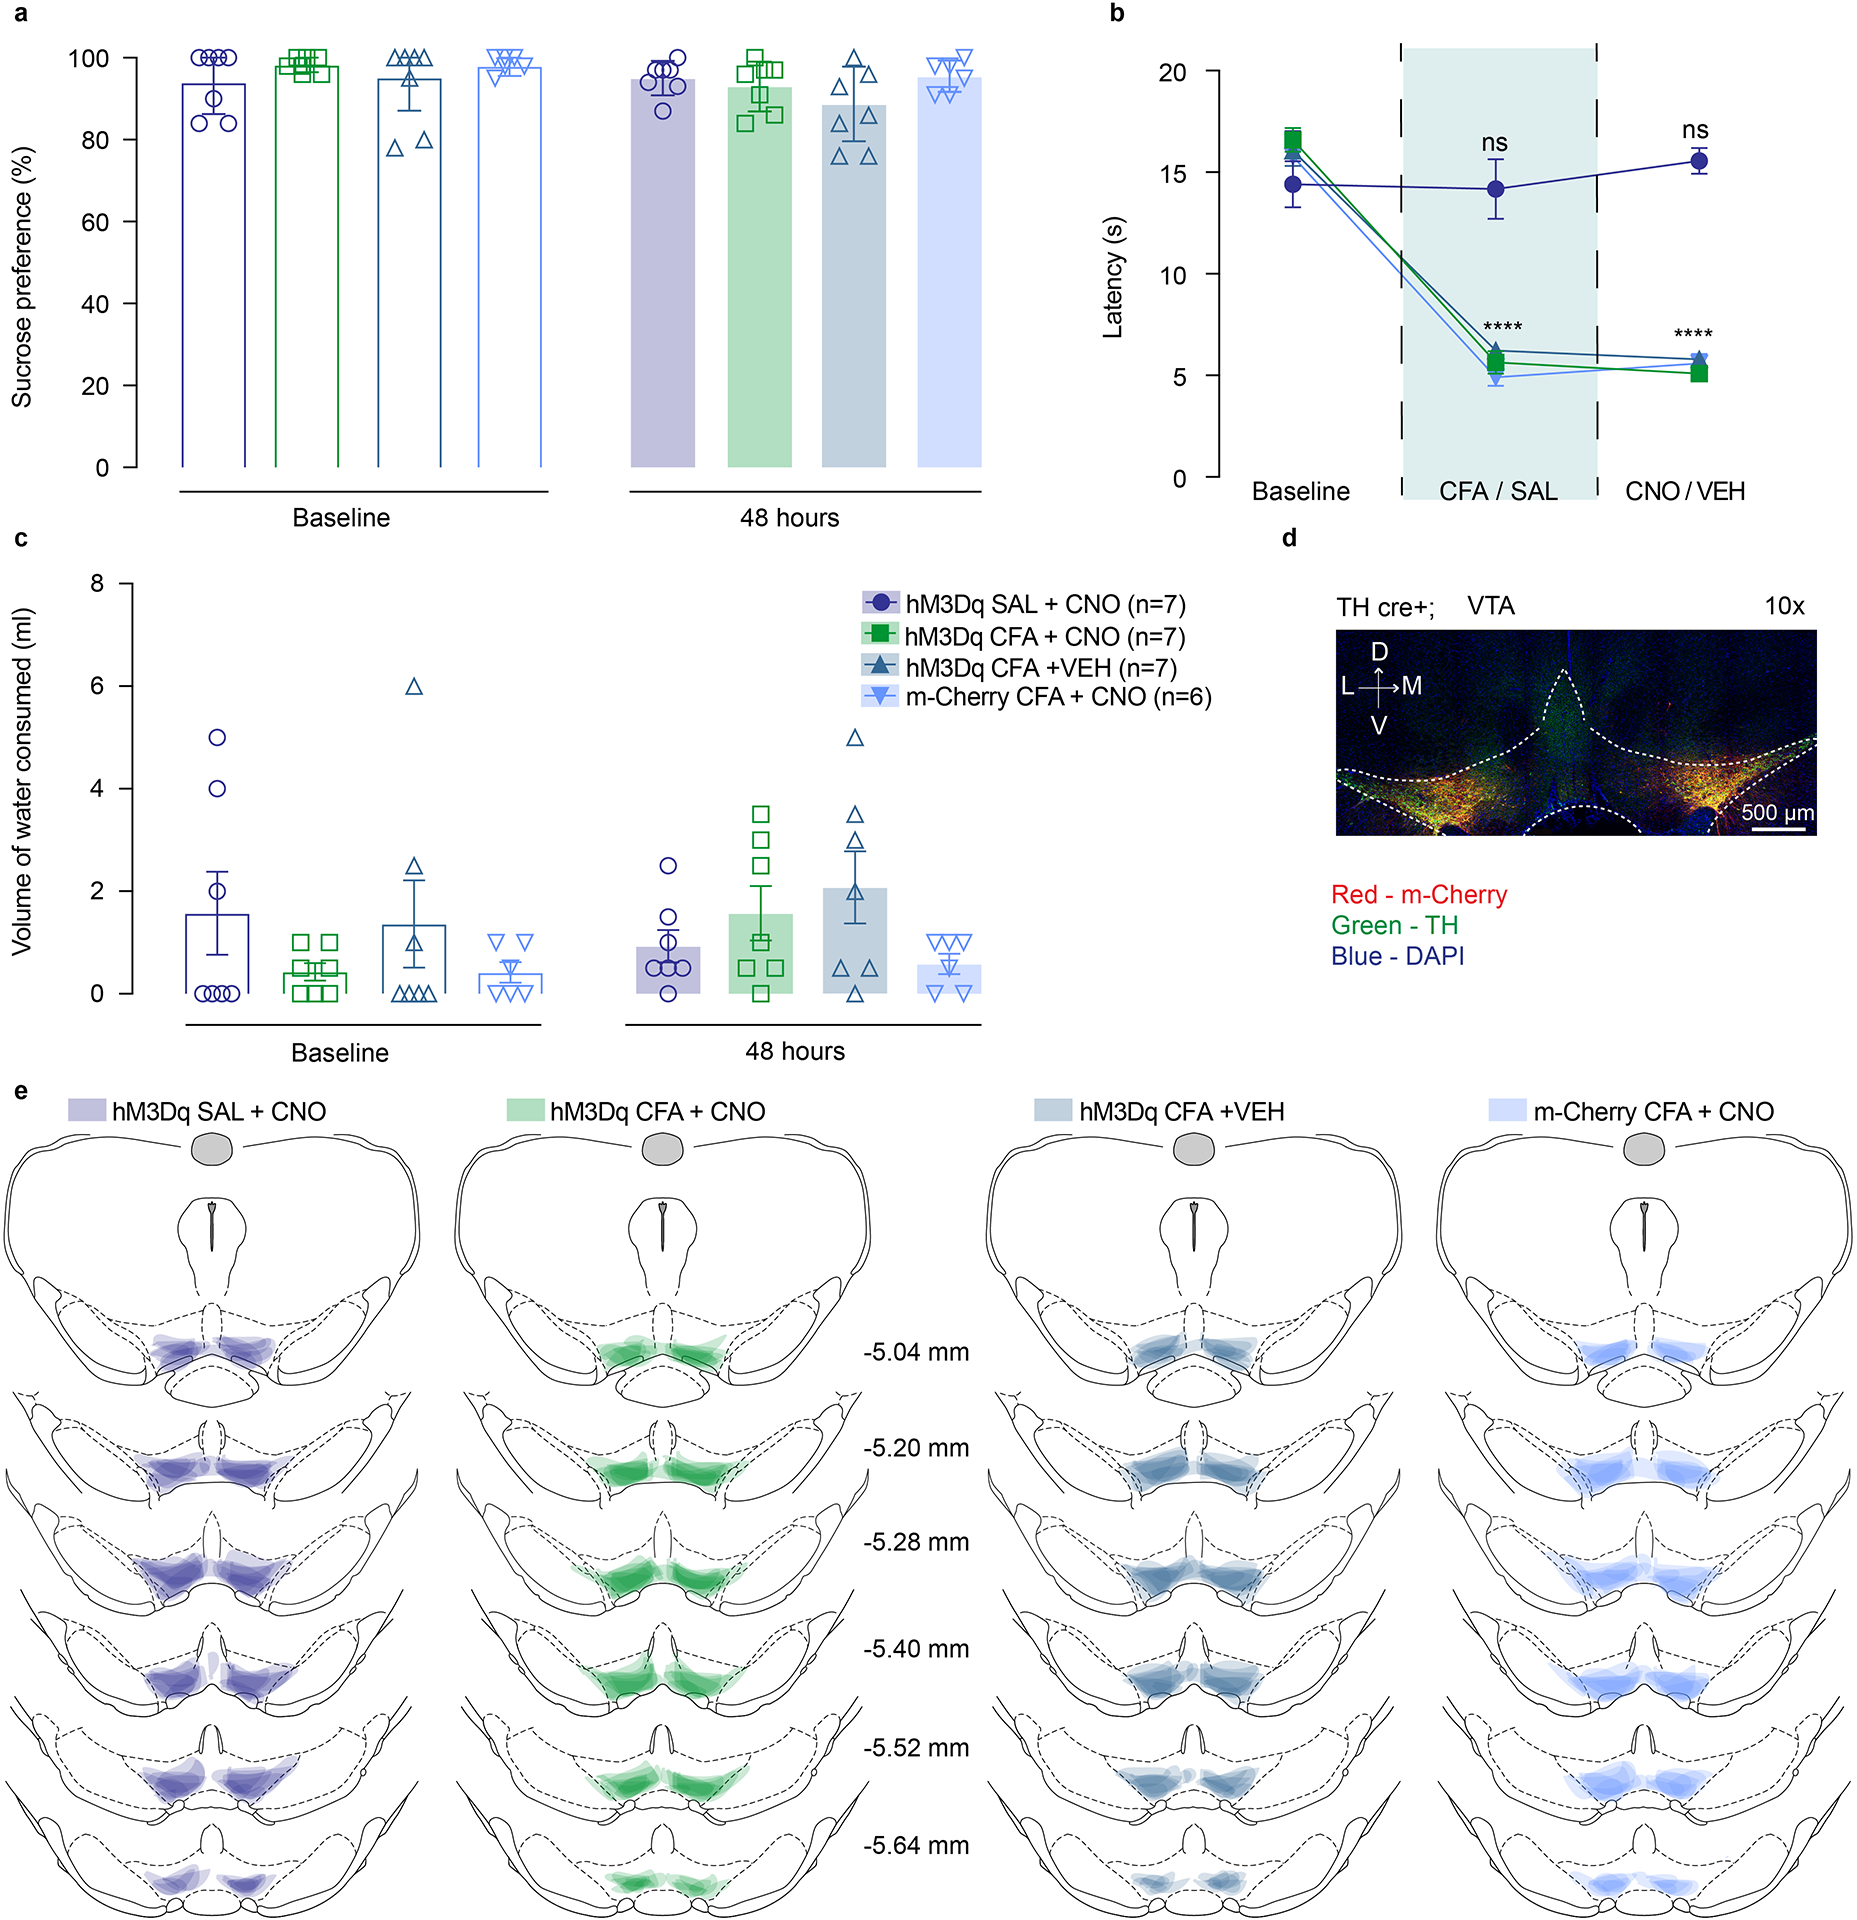
a. Chemogenetic activation of DA containing neurons in the VTA does not alter sucrose preference in two-bottle choice test. b. CFA induced hyperalgesia is not altered by activation of VTA DA neurons (two-way ANOVA for repeated measures, time: F2, 48 = 148.2, p<0.0001; interaction (time × treatment): F6, 48 = 19.30, p<0.0001; Sidak’s post hoc for each group as compared to the group’s baseline session: **** p<0.0001; n (hM3Dq SAL + CNO) = 7 rats, n (hM3Dq CFA + CNO) = 7 rats, n (hM3Dq CFA + VEH) = 7 rats, n (m-Cherry CFA + CNO) = 6 rats). c. Chemogenetic activation of DA containing neurons in the VTA does not alter water consumption in two-bottle choice test. d. Representative coronal section of VTA DREADD expressing neurons. Blue – DAPI; Red – m-Cherry (Gq DREADD); Green – TH (DA neurons). e. Spread of overlay of individual animal viral expression across VTA in DREADD and control m-Cherry injected TH-cre animals. The data are presented as the mean ± s.e.m.
Extended Data Fig. 9. Chemogenetic stimulation of RMTg GABA neurons does not alter sucrose preference in two-bottle choice test.
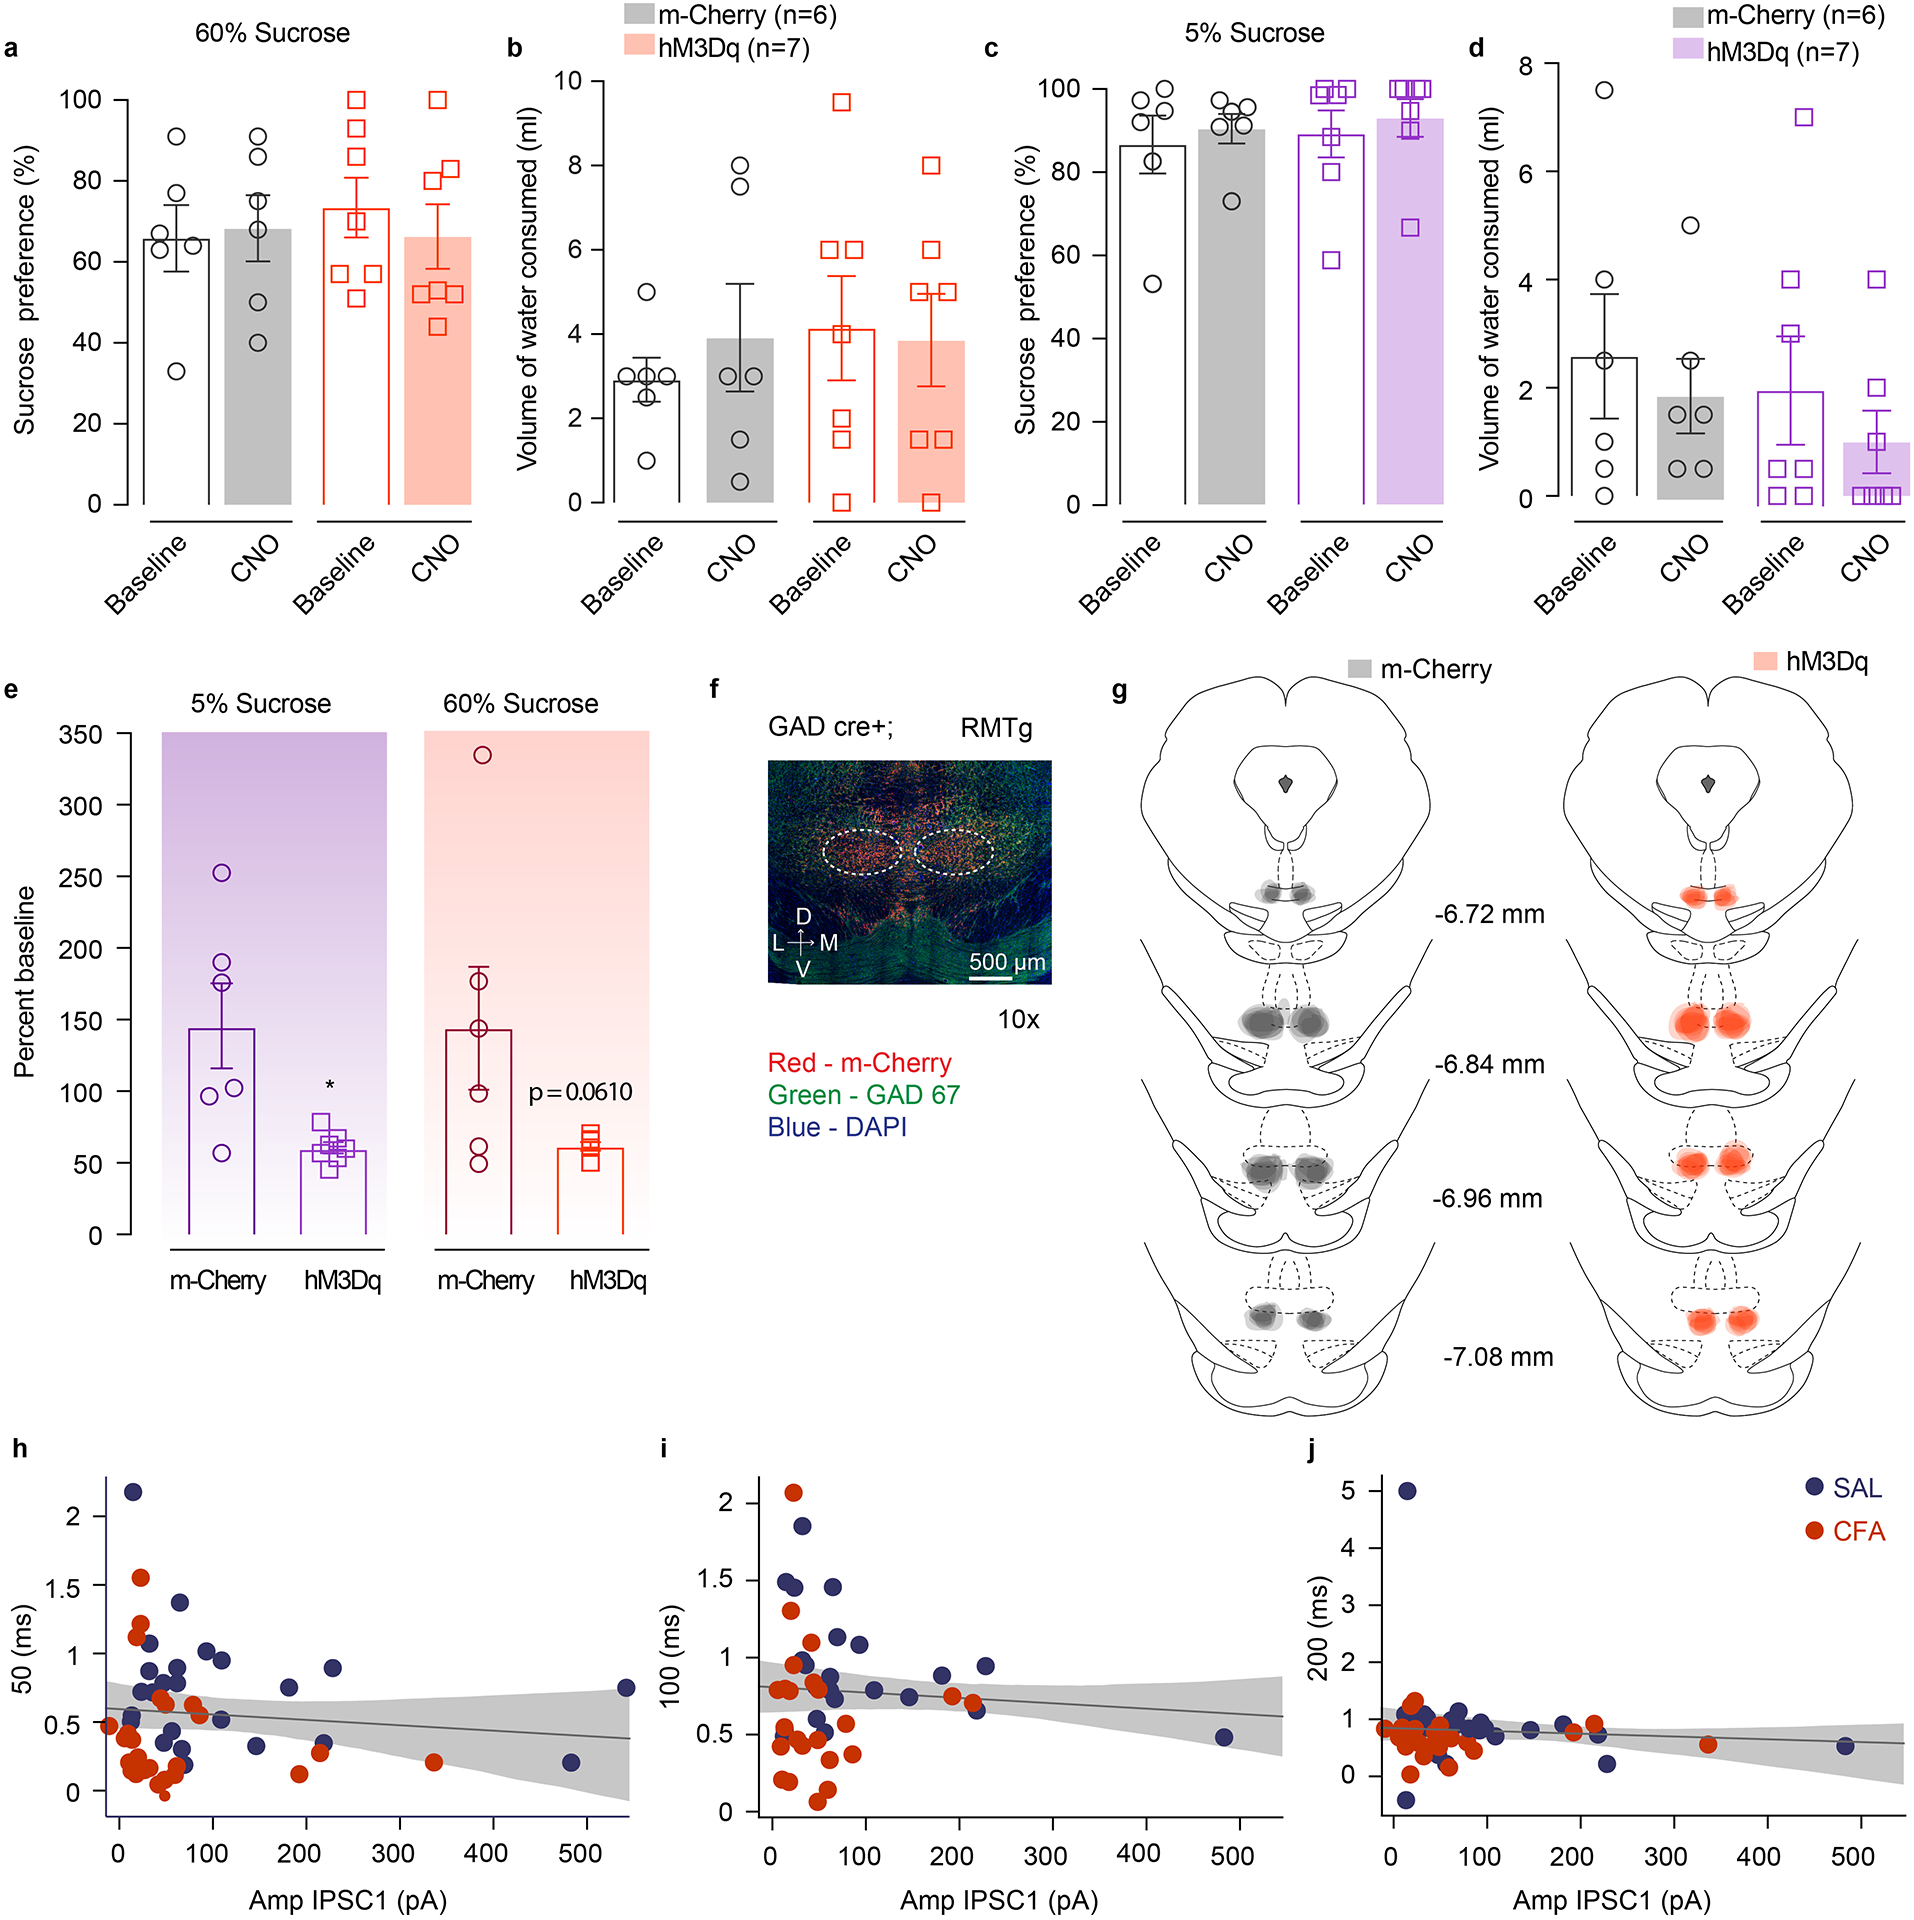
a–d. Chemogenetic activation of RMTg GABA cells does not alter preference for 60% or 5% sucrose or water consumption in two-bottle choice test. e. Sucrose consumption presented as percent change of baseline (5% sucrose (n (m-Cherry) = 6 rats, n (hM3Dq) = 7 rats) two tailed unpaired t test, * p=0.0105; 60% sucrose (n (m-Cherry) = 6 rats, n (hM3Dq) = 7 rats) two tailed unpaired t test p=0.0610). f. Representative coronal section of RMTg Gq DREADD expressing neurons. Blue – DAPI; Red – m-Cherry (Gq DREADD); Green – GAD 67 (GABA neurons). g. Spread of overlay of individual animal viral expression across RMTg in DREADD and control m-Cherry injected GAD-cre animals. The data are presented as the mean ± s.e.m. h–j. PPR is not correlated with the evoked amplitude of initial response at any inter-pulse interval. The data are presented as regression line and 95% confidence interval.
Extended Data Fig. 10. Chemogenetic inhibition of RMTg-VTA GABAergic pathway does not alter sucrose preference in two-bottle choice test.
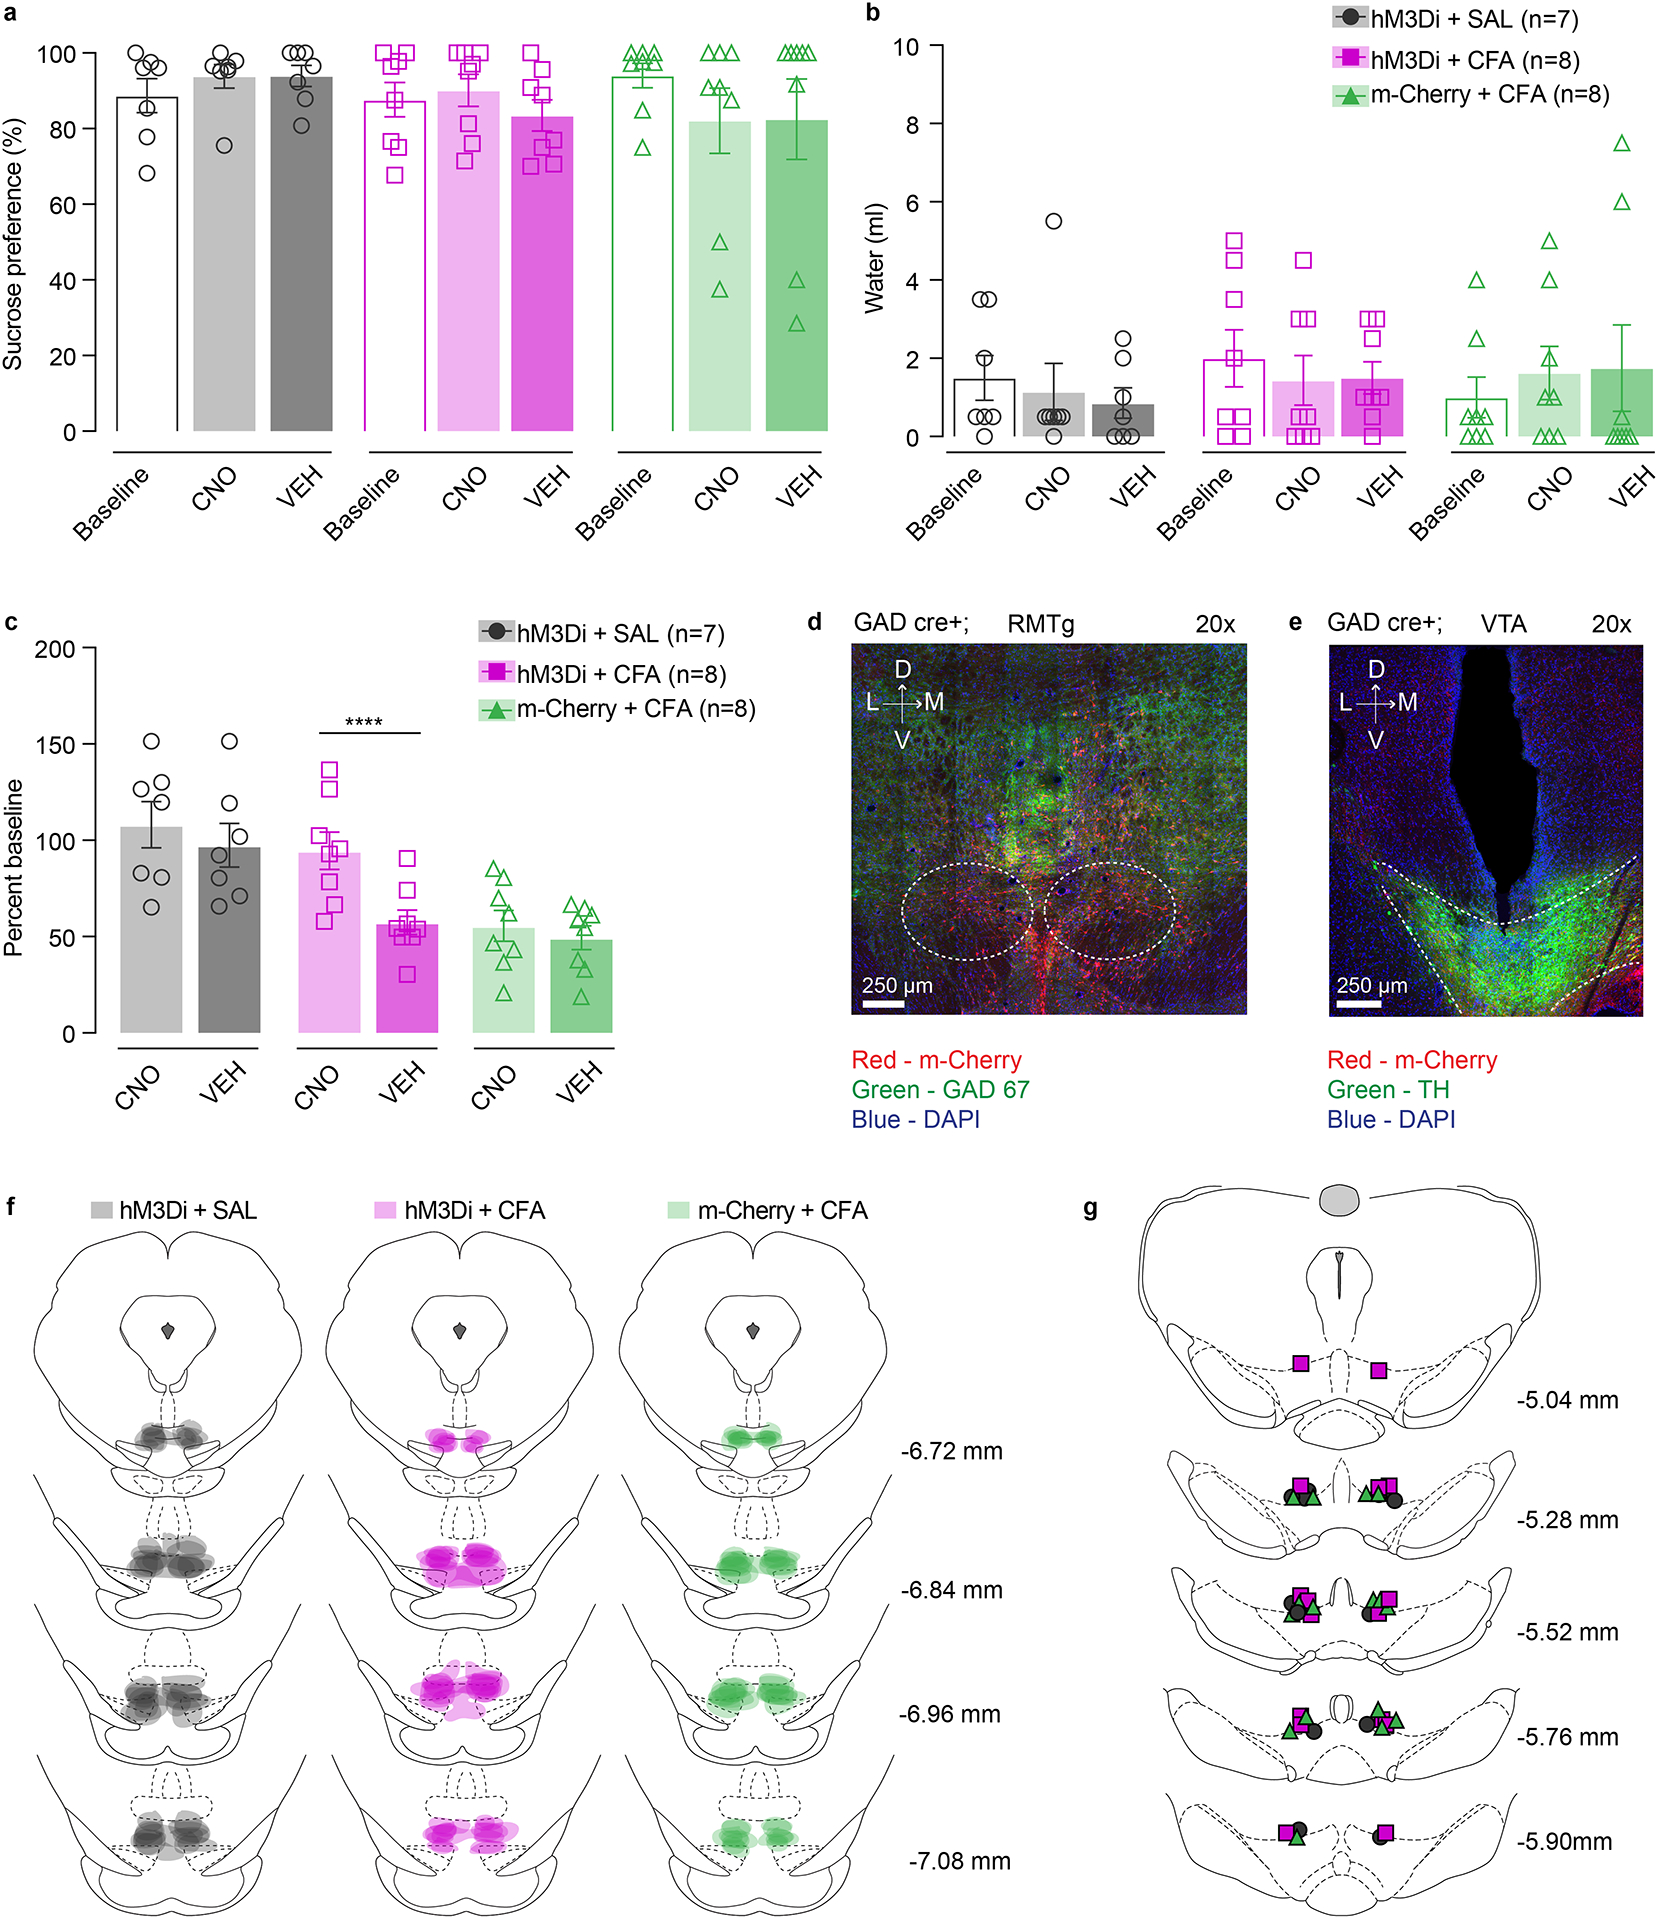
a–b. Chemogenetic inhibition of RMTg GABA cells projecting to VTA does not alter sucrose preference or water consumption in two-bottle choice test. c. Sucrose consumption presented as percent change of baseline (two-way ANOVA for repeated measures, time: F1, 20=20.89, p=0.0002; interaction (time × treatment): F2,20=6.236, p=0.0079; Sidak’s post hoc within group: hM3Di + CFA +CNO(n=8) versus hM3Di + CFA + VEH (n=8), **** p<0.0001) d. Representative coronal section of RMTg Gi DREADD expressing neurons. Blue – DAPI; Red – m-Cherry (Gi DREADD); Green – GAD 67 (GABA neurons). e. Representative coronal section of cannula placement in the VTA. Blue – DAPI; Red – m-Cherry (Gi DREADD); Green – TH (DA neurons). f. Spread of overlay of individual animal viral expression across RMTg in DREADD and control m-Cherry injected GAD-cre animals. i. Schematic representation of cannula placement in the VTA for local delivery of aCSF or CNO. The data are presented as the mean ± s.e.m.
Supplementary Material
ACKNOWLEDGMENTS
We would like to thank all members from the Moron-Concepcion, Bruchas, Creed and Alvarez laboratories for their help throughout the completion of the current study. In addition, we thank PhD. Ilya Monosov for help with statistical analysis for Figure 3 i,j,k, and PhD. Adrianne R. Wilson-Poe for manuscript review and editing. This work was supported by US National Institutes of Health (NIH) grant DA041781 (J.A.M.), DA042581 (J.A.M.), DA042499 (J.A.M.), DA041883 (J.A.M.), DA045463 (J.A.M.), NARSAD Independent Investigator Award from the Brain and Behavior Research Foundation (J.A.M.), the Brain and Behavior Research Foundation (NARSAD Young Investigator Grant 27197 M.C.C.), National Institutes of Health National Institute on Drug Abuse R21-DA047127 (M.C.C.), R01-DA049924 (M.C.C.), Whitehall Foundation Grant 2017-12-54 (M.C.C.), Rita Allen Scholar Award in Pain (M.C.C.) and NRSA F31DA051124 (C.E.P.)
Footnotes
COMPETING INTERESTS
The authors declare no competing interests.
CODE AND SOFTWARE AVAILABILITY
Custom MatLab scripts generated during and/or analyzed during the current study are available publicly from following link: https://github.com/christianepedersen . Custom written analysis software Igor Pro 7 and mafPC is publicly available from the following links: https://bitbucket.org/r-bock/vigor/src/master/, https://bitbucket.org/r-bock/common-igor-functions/src/master/, and https://www.xufriedman.org/mafpc.
DATA AVAILABILITY
The data that support the findings of this study are available from the corresponding author upon request.
References:
- 1.Leknes S & Tracey I A common neurobiology for pain and pleasure. Nature Reviews Neuroscience 9, 314–320 (2008). [DOI] [PubMed] [Google Scholar]
- 2.Bair MJ, Robinson RL, Katon W & Kroenke K Depression and pain comorbidity: a literature review. Arch Intern Med 163, 2433–2445 (2003). [DOI] [PubMed] [Google Scholar]
- 3.McWilliams LA, Goodwin RD & Cox BJ Depression and anxiety associated with three pain conditions: Results from a nationally representative sample. Pain 111, 77–83 (2004). [DOI] [PubMed] [Google Scholar]
- 4.Campbell LC, Clauw DJ & Keefe FJ Persistent pain and depression: a biopsychosocial perspective. Biol Psychiatry 54, 399–409 (2003). [DOI] [PubMed] [Google Scholar]
- 5.Volkow ND & McLellan AT Opioid Abuse in Chronic Pain — Misconceptions and Mitigation Strategies. New England Journal of Medicine 374, 1253–1263 (2016). [DOI] [PubMed] [Google Scholar]
- 6.Apkarian AV et al. Chronic pain patients are impaired on an emotional decision-making task. Pain 108, 129–136 (2004). [DOI] [PubMed] [Google Scholar]
- 7.Verdejo-García A, López-Torrecillas F, Calandre EP, Delgado-Rodríguez A & Bechara A Executive function and decision-making in women with fibromyalgia. Arch Clin Neuropsychol 24, 113–122 (2009). [DOI] [PubMed] [Google Scholar]
- 8.Wiech K et al. Influence of prior information on pain involves biased perceptual decision-making. Curr Biol 24, R679–R681 (2014). [DOI] [PMC free article] [PubMed] [Google Scholar]
- 9.Seixas D, Palace J & Tracey I Chronic pain disrupts the reward circuitry in multiple sclerosis. European Journal of Neuroscience 44, 1928–1934 (2016). [DOI] [PubMed] [Google Scholar]
- 10.Nestler EJ & Carlezon WA The mesolimbic dopamine reward circuit in depression. Biol Psychiatry 59, 1151–1159 (2006). [DOI] [PubMed] [Google Scholar]
- 11.Schultz W Behavioral dopamine signals. Trends in Neurosciences 30, 203–210 (2007). [DOI] [PubMed] [Google Scholar]
- 12.Berridge KC & Robinson TE What is the role of dopamine in reward: hedonic impact, reward learning, or incentive salience? Brain Research Reviews 28, 309–369 (1998). [DOI] [PubMed] [Google Scholar]
- 13.Bromberg-Martin ES, Matsumoto M & Hikosaka O Dopamine in motivational control: rewarding, aversive, and alerting. Neuron 68, 815–834 (2010). [DOI] [PMC free article] [PubMed] [Google Scholar]
- 14.Martikainen IK et al. Chronic Back Pain Is Associated with Alterations in Dopamine Neurotransmission in the Ventral Striatum. J. Neurosci 35, 9957–9965 (2015). [DOI] [PMC free article] [PubMed] [Google Scholar]
- 15.Scott DJ, Heitzeg MM, Koeppe RA, Stohler CS & Zubieta J-K Variations in the human pain stress experience mediated by ventral and dorsal basal ganglia dopamine activity. J Neurosci 26, 10789–10795 (2006). [DOI] [PMC free article] [PubMed] [Google Scholar]
- 16.Benarroch EE Involvement of the nucleus accumbens and dopamine system in chronic pain. Neurology 87, 1720–1726 (2016). [DOI] [PubMed] [Google Scholar]
- 17.Hipolito L et al. Inflammatory Pain Promotes Increased Opioid Self-Administration: Role of Dysregulated Ventral Tegmental Area Opioid Receptors. Journal of Neuroscience 35, 12217–12231 (2015). [DOI] [PMC free article] [PubMed] [Google Scholar]
- 18.Taylor AMW et al. Microglia Disrupt Mesolimbic Reward Circuitry in Chronic Pain. J. Neurosci 35, 8442–8450 (2015). [DOI] [PMC free article] [PubMed] [Google Scholar]
- 19.Massaly N et al. Pain-Induced Negative Affect Is Mediated via Recruitment of The Nucleus Accumbens Kappa Opioid System. Neuron 102, 564–573.e6 (2019). [DOI] [PMC free article] [PubMed] [Google Scholar]
- 20.Schwartz N et al. Decreased motivation during chronic pain requires long-term depression in the nucleus accumbens. Science 345, 535–542 (2014). [DOI] [PMC free article] [PubMed] [Google Scholar]
- 21.Matsui A, Jarvie BC, Robinson BG, Hentges ST & Williams JT Separate GABA afferents to dopamine neurons mediate acute action of opioids, development of tolerance and expression of withdrawal. Neuron 82, 1346–1356 (2014). [DOI] [PMC free article] [PubMed] [Google Scholar]
- 22.Ozaki S et al. Suppression of the morphine-induced rewarding effect in the rat with neuropathic pain: implication of the reduction in μ-opioid receptor functions in the ventral tegmental area. Journal of Neurochemistry 82, 1192–1198 (2002). [DOI] [PubMed] [Google Scholar]
- 23.Hodos W Progressive ratio as a measure of reward strength. Science 134, 943–944 (1961). [DOI] [PubMed] [Google Scholar]
- 24.Brennan K, Roberts DC, Anisman H & Merali Z Individual differences in sucrose consumption in the rat: motivational and neurochemical correlates of hedonia. Psychopharmacology (Berl) 157, 269–276 (2001). [DOI] [PubMed] [Google Scholar]
- 25.Kitai ST, Shepard PD, Callaway JC & Scroggs R Afferent modulation of dopamine neuron firing patterns. Curr Opin Neurobiol 9, 690–697 (1999). [DOI] [PubMed] [Google Scholar]
- 26.Neuhoff H, Neu A, Liss B & Roeper J. I(h) channels contribute to the different functional properties of identified dopaminergic subpopulations in the midbrain. J Neurosci 22, 1290–1302 (2002). [DOI] [PMC free article] [PubMed] [Google Scholar]
- 27.Saddoris MP, Cacciapaglia F, Wightman RM & Carelli RM Differential Dopamine Release Dynamics in the Nucleus Accumbens Core and Shell Reveal Complementary Signals for Error Prediction and Incentive Motivation. J. Neurosci 35, 11572–11582 (2015). [DOI] [PMC free article] [PubMed] [Google Scholar]
- 28.Boekhoudt L et al. Enhancing excitability of dopamine neurons promotes motivational behaviour through increased action initiation. Eur Neuropsychopharmacol 28, 171–184 (2018). [DOI] [PubMed] [Google Scholar]
- 29.Yang H et al. Nucleus Accumbens Subnuclei Regulate Motivated Behavior via Direct Inhibition and Disinhibition of VTA Dopamine Subpopulations. Neuron 97, 434–449.e4 (2018). [DOI] [PMC free article] [PubMed] [Google Scholar]
- 30.Al-Hasani R et al. Distinct Subpopulations of Nucleus Accumbens Dynorphin Neurons Drive Aversion and Reward. Neuron 87, 1063–1077 (2015). [DOI] [PMC free article] [PubMed] [Google Scholar]
- 31.Boender AJ et al. Combined Use of the Canine Adenovirus-2 and DREADD-Technology to Activate Specific Neural Pathways In Vivo. PLOS ONE 9, e95392 (2014). [DOI] [PMC free article] [PubMed] [Google Scholar]
- 32.Navratilova E et al. Pain relief produces negative reinforcement through activation of mesolimbic reward–valuation circuitry. PNAS 109, 20709–20713 (2012). [DOI] [PMC free article] [PubMed] [Google Scholar]
- 33.Liu M-Y et al. Sucrose preference test for measurement of stress-induced anhedonia in mice. Nat Protoc 13, 1686–1698 (2018). [DOI] [PubMed] [Google Scholar]
- 34.van Zessen R, Phillips JL, Budygin EA & Stuber GD Activation of VTA GABA neurons disrupts reward consumption. Neuron 73, 1184–1194 (2012). [DOI] [PMC free article] [PubMed] [Google Scholar]
- 35.Jhou TC, Fields HL, Baxter MG, Saper CB & Holland PC The rostromedial tegmental nucleus (RMTg), a GABAergic afferent to midbrain dopamine neurons, encodes aversive stimuli and inhibits motor responses. Neuron 61, 786–800 (2009). [DOI] [PMC free article] [PubMed] [Google Scholar]
- 36.Huang S, Borgland SL & Zamponi GW Peripheral nerve injury-induced alterations in VTA neuron firing properties. Molecular Brain 12, 89 (2019). [DOI] [PMC free article] [PubMed] [Google Scholar]
- 37.Creed MC, Ntamati NR & Tan KR VTA GABA neurons modulate specific learning behaviors through the control of dopamine and cholinergic systems. Front Behav Neurosci 8, (2014). [DOI] [PMC free article] [PubMed] [Google Scholar]
- 38.Waung MW, Margolis EB, Charbit AR & Fields HL A Midbrain Circuit that Mediates Headache Aversiveness in Rats. Cell Reports 28, 2739–2747.e4 (2019). [DOI] [PMC free article] [PubMed] [Google Scholar]
- 39.Schultz W Dopamine reward prediction error coding. Dialogues Clin Neurosci 18, 23–32 (2016). [DOI] [PMC free article] [PubMed] [Google Scholar]
- 40.Schultz W, Dayan P & Montague PR A neural substrate of prediction and reward. Science 275, 1593–1599 (1997). [DOI] [PubMed] [Google Scholar]
- 41.Li H et al. Three Rostromedial Tegmental Afferents Drive Triply Dissociable Aspects of Punishment Learning and Aversive Valence Encoding. Neuron 104, 987–999.e4 (2019). [DOI] [PMC free article] [PubMed] [Google Scholar]
- 42.Morales M & Margolis EB Ventral tegmental area: cellular heterogeneity, connectivity and behaviour. Nat Rev Neurosci 18, 73–85 (2017). [DOI] [PubMed] [Google Scholar]
- 43.Navratilova E & Porreca F Reward and motivation in pain and pain relief. Nat Neurosci 17, 1304–1312 (2014). [DOI] [PMC free article] [PubMed] [Google Scholar]
- 44.Leknes S, Lee M, Berna C, Andersson J & Tracey I Relief as a Reward: Hedonic and Neural Responses to Safety from Pain. PLOS ONE 6, e17870 (2011). [DOI] [PMC free article] [PubMed] [Google Scholar]
- 45.Mohebi A et al. Dissociable dopamine dynamics for learning and motivation. Nature 570, 65–70 (2019). [DOI] [PMC free article] [PubMed] [Google Scholar]
- 46.Liu S et al. Neuropathic Pain Alters Reward and Affect via Kappa Opioid Receptor (KOR) Upregulation. FASEB JOURNAL 30, (2016). [Google Scholar]
- 47.Hayward MD, Schaich-Borg A, Pintar JE & Low MJ Differential involvement of endogenous opioids in sucrose consumption and food reinforcement. Pharmacol Biochem Behav 85, 601–611 (2006). [DOI] [PMC free article] [PubMed] [Google Scholar]
- 48.Nummenmaa L et al. μ-opioid receptor system mediates reward processing in humans. Nature Communications 9, 1500 (2018). [DOI] [PMC free article] [PubMed] [Google Scholar]
- 49.Harris RE et al. Decreased Central μ-Opioid Receptor Availability in Fibromyalgia. J. Neurosci 27, 10000–10006 (2007). [DOI] [PMC free article] [PubMed] [Google Scholar]
- 50.A neural circuit for comorbid depressive symptoms in chronic pain | Nature Neuroscience. https://www.nature.com/articles/s41593-019-0468-2. [DOI] [PubMed]
Associated Data
This section collects any data citations, data availability statements, or supplementary materials included in this article.
Supplementary Materials
Data Availability Statement
The data that support the findings of this study are available from the corresponding author upon request.


