

Abstract
Non-enzymatic glucose sensors outperform enzymatic ones in terms of cost, sensitivity, stability, and operating duration. Though highly sensitive, it is still desirable to further improve the sensitivity of non-enzymatic glucose sensors to detect a trace amount of glucose in sweat and other biofluids. Among the demonstrated effective approaches using bimetals or 3D porous structures, the porous laser-induced graphene (LIG) on flexible polymers showcases good conductivity and a simple fabrication process for the integration of sensing materials. The uniform electroless plating of the nickel and gold layer on LIG electrodes demonstrates significantly enhanced sensitivity and a large linear range for glucose sensing. The sensor with the porous LIG foam exhibits a high sensitivity of 1080 μA mM−1 cm−2, whereas a further increased sensitivity of 3500 μA mM−1 cm−2 is obtained with LIG fibers (LIGF). Impressively, a large linear range (0 – 30 mM) can be achieved by changing the bias voltage from 0.5 to 0.1 V due to the Au coating. Because the existing non-enzymatic glucose sensors are limited to use in basic solutions, their application in wearable electronics is elusive. In addition to the reduced requirement for the base solution, this work integrates a porous encapsulating reaction cavity containing alkali solutions with a soft, skin-interfaced microfluidic component to provide integrated microfluidic non-enzymatic glucose sensors for sweat sampling and glucose sensing. The accurate glucose measurements from the human sweat and cell culture media showcase the practical utility, which opens up opportunities for the non-enzymatic glucose sensors in wearable electronics.
Keywords: Laser-induced graphene foams or fibers, Non-enzymatic glucose sensors, Integrated reaction cavity for on-body measurements, Porous/3D structures for improved sensitivity
Introduction
Diabetes poses a major health concern, so its monitoring and therapy have been of high interest (Wang and Lee 2015). Because the functional recovery of insulin secretion in diabetes patients is challenging, it is crucial to continuously monitor the blood glucose concentration for timely treatment with the injection of artificially synthesized insulin. Although noninvasive optical and spectroscopic measurements of glucose have been explored (Amir et al. 2007; Koschinsky and Heinemann 2001; Lee et al. 2018), they are associated with the expensive equipment setup and subject to the interference from movement and temperature (van Enter and von Hauff 2018). Because of the simplicity, electrochemical analysis (Dai et al. 2018; Kim et al. 2018; Lee et al. 2018; Lee et al. 2019; Muthuchamy et al. 2018), including the chronoamperometry (CA) (Lee et al. 2019) and differential pulse voltammetry (DPV) (Dai et al. 2018; Muthuchamy et al. 2018), has been extensively employed in portable glucose sensors for daily monitoring and clinical diagnostics. In the electrochemical setup, glucose is oxidized by an oxidizer at the working electrode to give away electrons, leading to current flow with a magnitude directly proportional to the glucose concentration. After obtaining the calibration curve in the glucose concentration versus current density, the electrochemical glucose sensor can be readily applied for use.
Both enzymatic and non-enzymatic glucose sensors have been widely used for glucose measurements. Glucose oxidase (GOx), as a representative enzymatic oxidizer, degrades rapidly during use for several days (Harris et al. 2013) even in mild conditions (e.g., the temperature of < 44 °C, pH of 2–8, and ambient humidity) (Toghill and Compton 2010). In contrast, the non-enzymatic glucose sensors based on metals or metal oxides showcase excellent stability, extended operating duration, and extraordinarily harsh environment tolerance with measurements independent from the temperature and humidity (Si et al. 2013; Zhu et al. 2016).
Although the sensitivity of non-enzymatic glucose sensors is already much higher than their enzymatic counterparts, it is still highly desirable to further improve the sensitivity for the detection of trace glucose in sweat and other biofluids. As an alternative to innovations in nanomaterials (Baghayeri et al. 2018; Sehit and Altintas 2020), novel 3D structures (Liu et al. 2015; Sedaghat et al. 2020) with a high specific surface area have been shown to improve the sensitivity of non-enzymatic glucose sensors over their planar counterparts. The commonly used method to create 3D structures explores the surfactant-templated approach and hydrothermal reaction (Liu et al. 2015). However, this method is complex with less controlled repeatability from the hydrothermal reaction. Also, the rigid electrode and high NaOH concentration are not suitable for wearable applications. As a simple alternative fabrication method, sensing materials with binders can be directly applied or electroplated on conductive porous substrates (Ensafi et al. 2014; Gupta et al. 2019) to yield non-enzymatic glucose sensors with 3D structures (Ling et al. 2018; Yang et al. 2020b). However, the use of binders reduces the catalytic activity of sensing materials to compromise the performance. As a solution to this issue, sensing materials have been directly plated on conductive substrates with good adhesion and uniformity (Zhang et al. 2020a; Zhang et al. 2017), but the planar substrate results in limited sensitivity. Although template-assisted electroplating leads to the formation of nanowires (Gupta et al. 2019), electroplating on the substrates with 3D structures (Ensafi et al. 2014) is limited to a few available porous conductive substrates (Davoodi et al. 2020; Pang et al. 2016).
The recently emerged laser-induced graphene (LIG) with porous structures, decent conductivity, and electrochemical stability appears to provide an excellent platform for electrochemical sensing applications (Tehrani and Bavarian 2016; Yang et al. 2020c; Yoon et al. 2020; Zhang et al. 2020c). Compared to the widely used 3D graphene grown on a porous template or laser-induced metal or metal oxide (such as nickel, gold, and copper) (Khairullina et al. 2018; Narayanan and Slaughter 2018; Sedaghat et al. 2020), the laser scribing process on a commercially available polyimide thin film can easily and rapidly program LIG patterns with different morphologies at a low cost for flexible/wearable devices (Sun et al. 2018; Yang et al. 2020c). Although LIG electrodes with electroplated metals have been leveraged for non-enzymatic glucose sensors (Tehrani and Bavarian 2016; Zhu et al. 2021), electroplating is only suitable for large LIG electrodes due to the limited conductivity. The limited and anisotropic conductivity in the porous 3D structure also leads to a long electroplating time and nonuniform electroplated layers. In addition, clamping to electrodes during electroplating may easily lead to the falling-off of LIG, leading to a failure of electroplating (Zahed et al. 2020). Efforts have been devoted to increasing the conductivity and mechanical robustness of LIG, e.g., spray coating a layer of conductive polymer (PEDOT:PSS) as a binder (Zahed et al. 2020). However, the PEDOT:PSS layer negatively affects the porous structure to result in low coverage of sensing metals for reduced sensitivity.
This work reports a uniform metal (e.g., Ni, or Ni/Au) coating process on the porous LIG with electroless plating for excellent glucose sensing performance. The electroless plated Au layer further mitigates the potential allergic reaction in certain patient populations (dos Santos et al. 2013; Menné and Nieboer 1989). The resulting glucose sensor with LIG foams shows a high sensitivity of 1080 μA mM−1 cm−2, whereas the one with LIG fibers further improves the sensitivity to 3500 μA mM−1 cm−2. The additional Au layer also enables a large linear sensing range (0 – 30 mM) under a small bias voltage (0.1 V). More importantly, the demonstrated non-enzymatic glucose sensors in the literature reports all have to be used in basic solutions, which prevent them from practical wearable applications as their enzymatic counterparts (Yu et al. 2020). Efforts to address this challenge include the use of an applied bias voltage work to increase the local pH and provide a basic environment from proton reduction reaction for non-enzymatic glucose sensing (Zhu et al. 2018; Zhu et al. 2019). However, this strategy involves the generation of hydrogen bubbles and does not have sweat sampling capabilities. In addition to a lower required basic solution, this work innovatively integrates the 3D porous non-enzymatic glucose sensor with a microfluidic component and a replaceable basic solution in the reaction cavity for highly efficient sweat sampling and real-time glucose sensing.
2. Materials and methods
2.1. Materials
Polyimide (PI) thin films with a thickness of 50 μm (Kapton® HN Film) were purchased from CS Hyde company. Nickel (RTM Kit) and gold (Immersion Gold CF) electroless plating precursors were purchased from Transene company. Silicone polymers, including Ecoflex 00–50 and Sylagrd 184, were purchased from Smooth-On and Dow Corning. Heptane to dilute Ecoflex, polyvinylpyrrolidone (PVP) for surface treatment, and polyaniline (PANI) for the pH measurement was purchased from Sigma-Aldrich. All chemicals were used without further purification. The cell culture media, including DMEM (11965092) and RPMI (11875119), were purchased from Thermo Fisher Scientific. Another customized cell culture medium composed of salts, amino acids, glucose, and cell-secreted factors, L7, was used to culture human pluripotent stem cells for 24 hours before the measurement.
2.2. Fabrication of flexible LIG electrodes
PI film (thickness of 50 um) was first rinsed with ethanol and distill (DI) water. After drying in the air, it was attached to an Ecoflex-coated silicon wafer for laser scribing. The flexible conductive LIG electrodes with programmable shapes in the form of foams or fibers were created by a CO2 laser (VLS2.30, Universal Laser Systems, Inc. VLS2.3) with dual-modes (i.e., raster and vector modes). The LIG foams on PI were obtained using the raster mode with optimized settings: 10.5% of the maximum power, 11% of the maximum speed, 1000 PPI, and an image density of 6. The LIG fibers (LIGF) on PI were prepared by the same laser system with a different set of setting parameters: 50% of the maximum power, 5% of the maximum speed, 100 PPI, and an image density of 3. After a vector cutting cycle (4% of the maximum power, 7% of the maximum speed, and 1000 PPI) to cut along the pattern outline, removal of the excessive PI outside the pattern completes the fabrication of LIG foam or fiber electrodes.
3. Results and discussion
3.1. LIG electrodes with electroless plated Ni and Au layers
As discussed in the Materials and Methods section, the Au/Ni/LIG WE is combined with the Nafion/AgCl/Ag/LIG RE and LIG CE electrodes in a three-electrode configuration to yield the non-enzymatic glucose sensor (Fig. 1a). Briefly, the commercial thin PI films are first converted into LIG electrodes by a simple laser scribing process. After Ag coating on the LIG electrode surface and immersion in the FeCl3 solution for chlorination, coating another layer of Nafion to get rid of the influence of chloride ions in the solution (Lim et al. 2020) on the obtained electrode completes the fabrication of the Nafion/AgCl/Ag/LIG RE (Fig. S1). The potential measurement of the resulting RE only shows a ~ 4 mV variation for 24 h even when immersed in PBS solutions with 0.1 M NaCl. A small variation of ~ 13 mV was observed for 30 days’ measurement (Fig. S2), indicating the long-term stability for electrochemical applications (Lim et al. 2020). The Au/Ni/LIG WE is obtained by electroless plating of Ni and Au on LIG electrodes in commercial precursor solutions. After integrating the Au/Ni/LIG WE with the RE and CE, the compact glucose sensor can be encapsulated by a porous encapsulating reaction cavity (Fig. S3) for on-body wearable applications (Fig. 1b).
Fig. 1. Non-enzymatic glucose sensors based on laser-induced graphene (LIG) and electroless plating Ni/Au.

(a) Fabrication process of the non-enzymatic glucose sensor starts with (i) laser scribing of the commercial polyimide (PI) film to prepare flexible LIG electrodes. Electroless plating of (ii) Ni and (iii) another layer of Au on LIG electrodes. (iv) Assembly of the as-fabricated working, reference, and counter electrodes (i.e., WE/RE/CE) completes the fabrication of the flexible compact glucose sensor. (b) Schematic illustration to show the integration of the glucose sensor with a porous encapsulating reaction cavity for an encapsulated wearable non-enzymatic glucose sensor. (c) Raman spectrum of the LIG and PI. Scanning electron microscope (SEM) images of the LIG (d), Ni_1/LIG (e), Au_1/Ni_1/LIG (f), Ni_3/LIG (g), and Au_1/Ni_3/LIG (h) WE (top view). The scale bar is 10 μm.
Before the electrochemical characterization of the integrated glucose sensor, the performance of individual electrodes is demonstrated and tested first. The Raman spectrum with three characteristic peaks (D peak at 1350 cm−1, G peak at 1580 cm−1, and 2D peak at 2700 cm−1) and the ratio of the 2D to G peak of ca. 0.48 confirms the existence of multi-layered graphene with some defects (Beams et al. 2015; Ferrari and Basko 2013) (Fig. 1c). These defects possibly originate from oxidation during the laser scribing without an inert gas environment. The small intensity ratio (~ 0.5, Fig. 1c) of the D to G peak implies a relatively high quality of the porous 3D graphene foam with a pore size of around 2–5 μm (Fig. 1d). In contrast, these characteristics are not observed in the Raman spectrum of the PI, indicating the successful conversion of the PI to LIG by laser scribing. Although the obtained LIG with good conductivity (sheet resistance of ~ 25 Ω/□ or conductivity of ~ 2000 S/m) is sufficient for capacitors (Peng et al. 2015) and gas sensing platforms (Stanford et al. 2019; Yang et al. 2020a), it is still challenging to electroplate a uniform layer of sensing materials on the porous LIG electrodes (Zahed et al. 2020). In fact, electroplating of nickel preferentially takes place at the LIG/solution interface, leaving the solution immersed LIG unplated (Fig. S4). Also, LIG flakes near the clamp often fall off during electroplating to result in failed plating processes. To address these challenges, we exploit the electroless plating to uniformly deposit a thin layer of Ni on the porous LIG electrode, where the thickness of the Ni layer is well controlled by the plating time. The color of LIG changes from black to grey with Ni coatings. With electroless plating of 1 min, the LIG foam is uniformly covered by a Ni layer without altering or blocking the porous structure (Fig. 1e and Fig. S5a). The structure with well-preserved porosity ensures a high specific surface area for fast diffusion of sampling solutions to result in a fast response and high sensitivity. When the plating time is increased to 3 min (Fig. 1g), the Ni layer gets thicker and almost blocks the porous structure (Fig. S5c). Though it is difficult to directly measure the thickness of the Ni layer on the highly porous 3D LIG foam, the comparison in the pore size of the same LIG foam before and after electroless plating provides a good estimate of its thickness. As the pore size decreases from ~ 1.5 to 0.3 μm after plating of 1 min, the thickness of the Ni layer is estimated to be ~ 0.6 μm. The Ni layer nearly blocks the porous structure after plating for 3 min, indicating a thickness of ~ 0.75 μm. When the electroplating time of Ni is reduced to 10 or 30 s, the porous structures of the 3D LIG foam are well maintained, as observed by SEM characterizations (Fig. S6). The influence of Ni thickness on the electrochemical sensing performance was investigated in the following part. Because some subjects have a nickel allergy, another Au layer is then electroless plated for 1 min on the Ni/LIG surface to minimize this side effect (Fig. 1f and h). Because Au is also sensitive to glucose (Cheng et al. 2010; Qiu and Huang 2010; Shen et al. 2019b), the Au/Ni/LIG WE is expected to maintain high sensitivity as well. The electroless plating of Au is a very slow and self-limiting process. According to the datasheet, the thickness of Au after electroless plating of 1 min is ca. 40 nm. The successful deposition of Ni and Au on the LIG is confirmed by X-ray powder diffraction (XRD) (Fig. 2a) and X-ray photoelectron spectroscopy (XPS) (Fig. 2b). The XPS results also reveal the existence of O elements from the oxidation of LIG and the electroplating precursor. The scanning transmission electron microscopy (STEM) combined with energy-dispersive X-ray spectroscopy (EDS) further reveals a conformal Ni coating on the LIG, followed by a thin Au layer on the surface of the Ni layer (Fig. 2c). The presence of sodium and phosphorus atoms results from the electrolyte residual and the Ni electroless plating according to 2Ni2+ + 8H2PO2− + 2H2O → 2Ni0 (s) + 6H2PO3− + 2H+ + 2P (s) + 3H2 (g). It is worth noting that the impurities (with the atomic weight shown in Table S1) in the fabricated glucose sensor do not affect glucose sensing performance. Additionally, Fourier-transform infrared spectroscopy (FTIR) has been carried out to verify the non-existence of the organic functional group on Ni or Au after electroless plating (Fig. S7), indicating that the glucose sensing may solely arise from the metal element. The Ni_1/LIG WE with a different thickness of the Au layer is studied in the following experiment: Ni_1/LIG, Au_1/Ni_1/LIG, Au_2/Ni_1/LIG, and Au_3/Ni_1/LIG (the number after Au and Ni indicates the plating time in min). Different from the substrate-assisted electroless deposition based on a galvanic displacement reaction, where the adopted Zn substrate has a redox potential than Cu ions in the solution (Zhang et al. 2020c), the electroless plating of Ni and Au adopted in this work doesn’t need another assistant electrode. Due to the contrast of roughness between LIG and PI, Ni electroless plating prefers to take place on LIG, eliminating the need for masks to define the electroplating region.
Fig. 2. Characterization of different WEs.
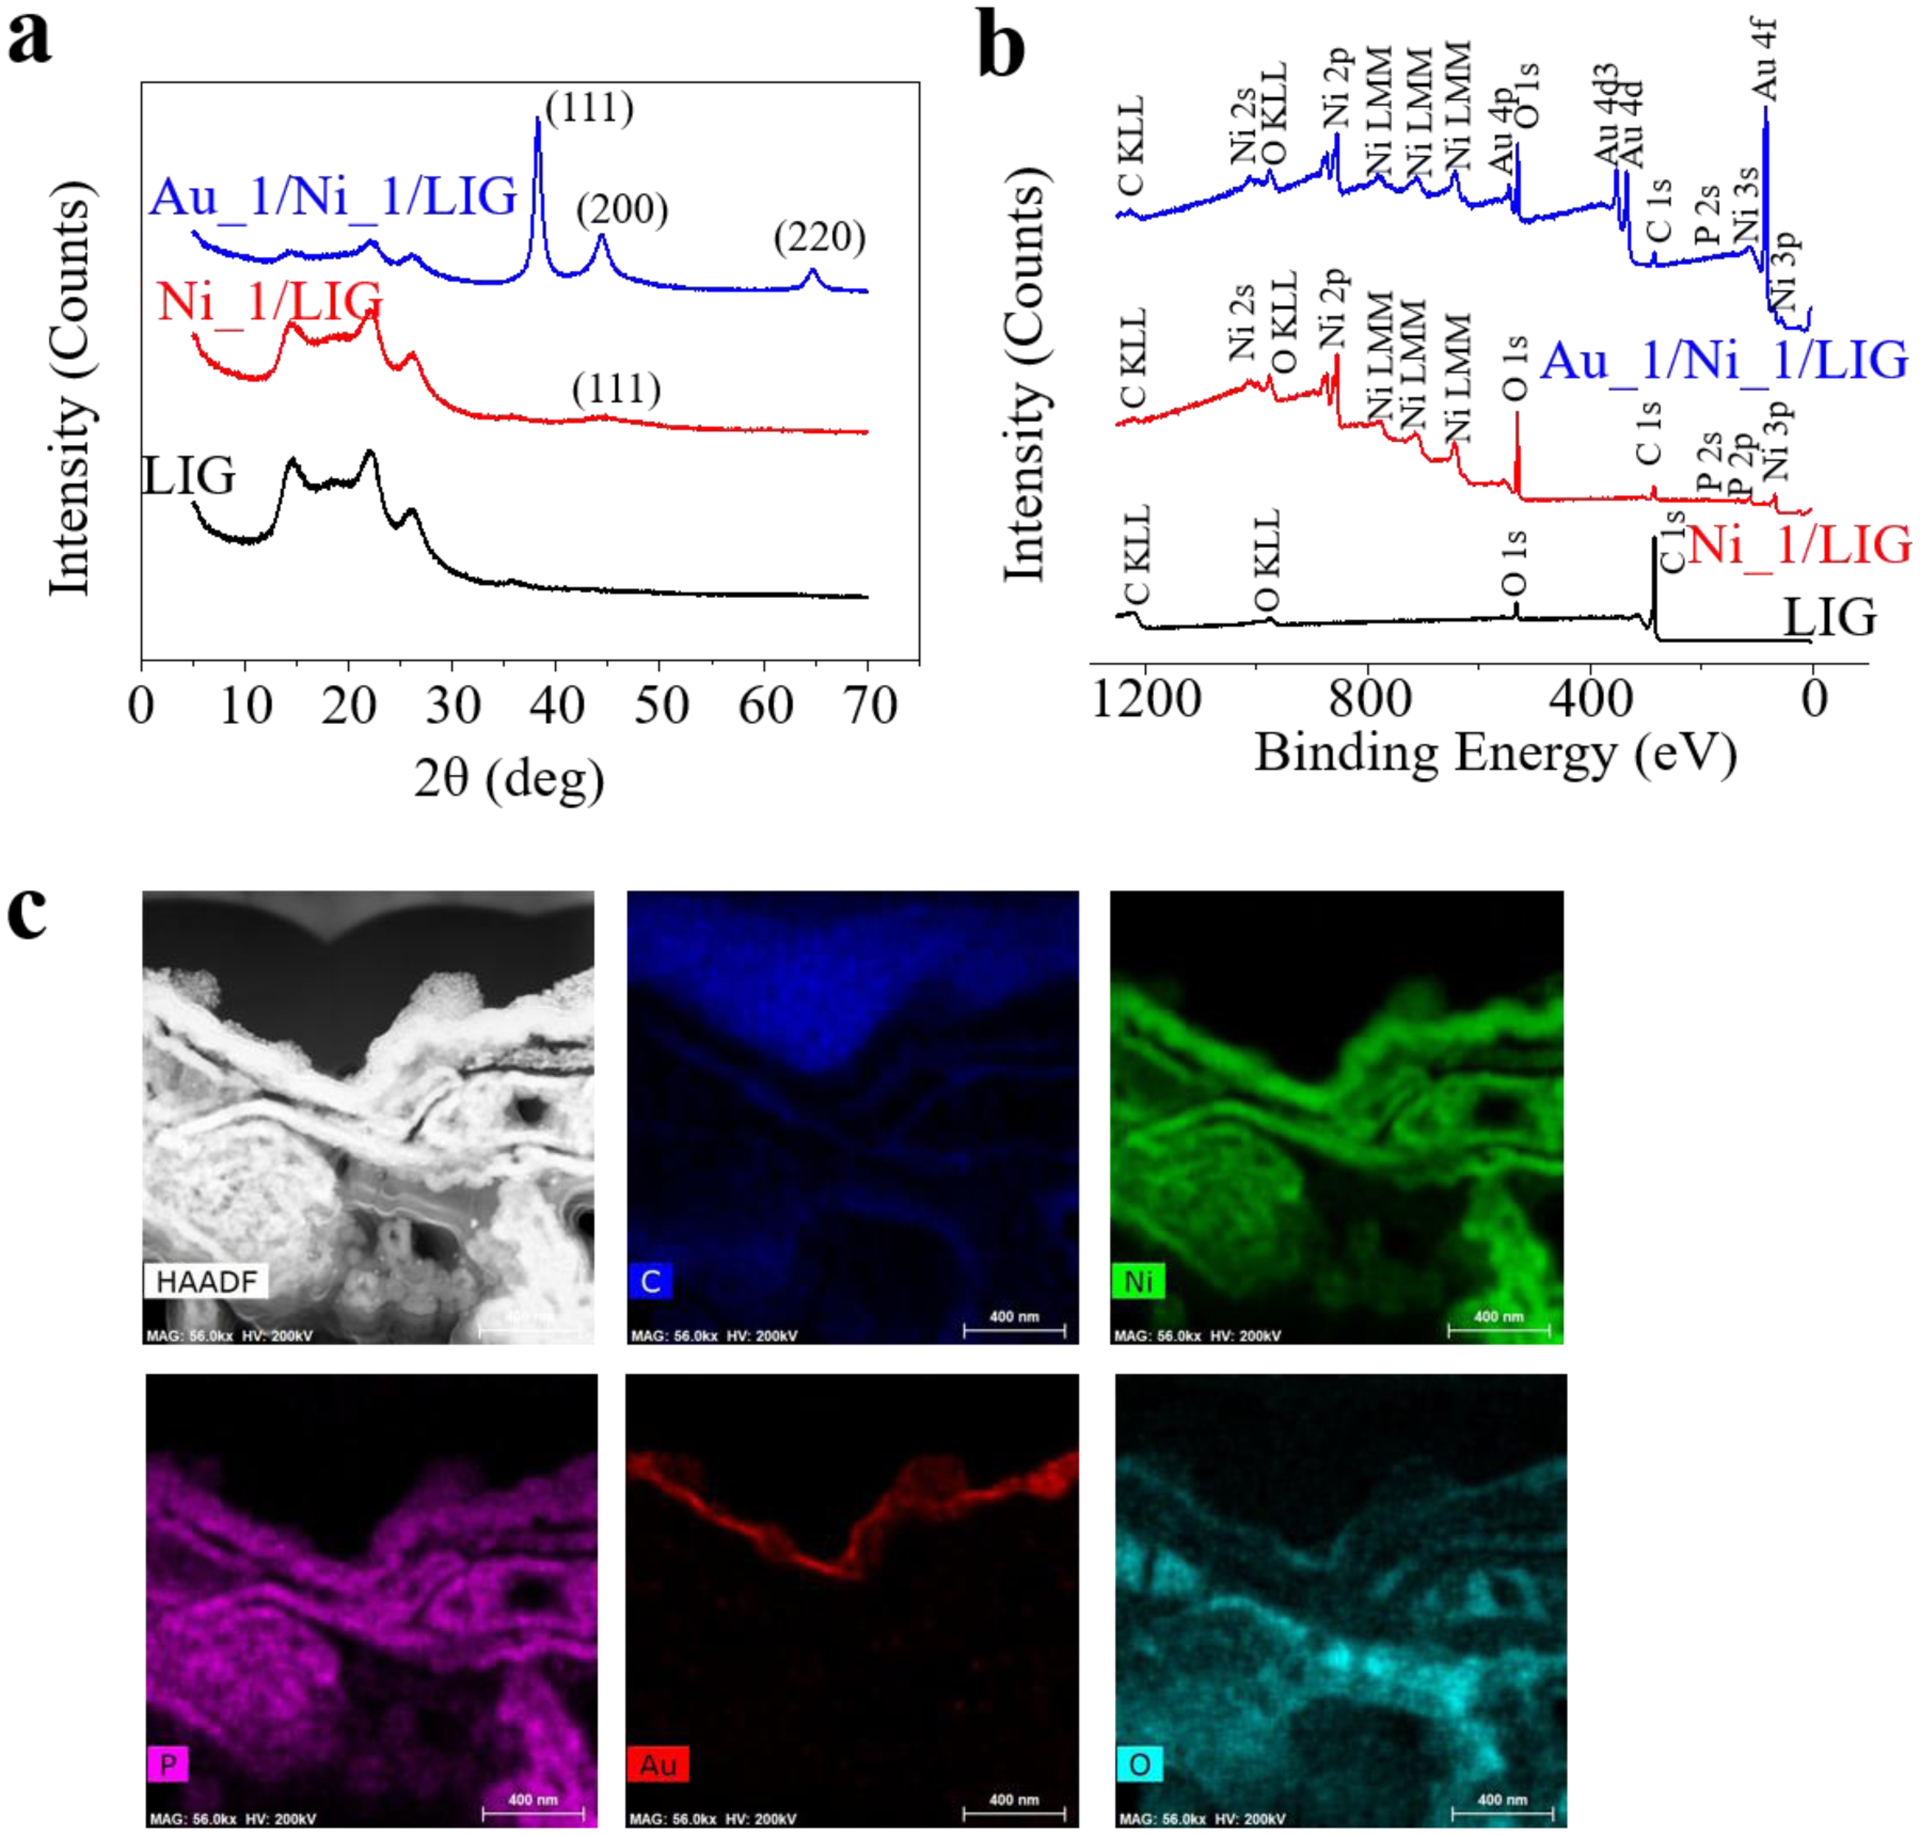
(a) XRD and (b) XPS measurements of the LIG, Ni_1/LIG, and Au_1/Ni_1/LIG WE. (c) STEM-EDS characterization of the Au_1/Ni_1/LIG WE.
Without Au layers, the cyclic voltammetry (CV) curves of Ni/LIG electrodes (both 1 and 3 min) reveal a single peak at ~ 0.5 V (and −0.25 V) in the forward (and reverse) scan, which corresponds to the oxidation (and reduction) of Ni (Fig 3a). In a basic solution under a positive bias voltage, Ni(OH)2 with Ni (II) arises from the oxidation of Ni anodes (Lu et al. 2009; Sattar and Conway 1969). The sensing mechanism of Ni to glucose relies on the following reaction (Gao et al. 2020):
The introduction of the Au layer leads to another peak at ~0.05 V in the reverse scan (green arrows in Fig. 3a), which is consistent with previous reports (Lim et al. 2020; Shen et al. 2019b) and corresponding to the reduction of gold (Hovancová et al. 2019). The separate peak from Au indicates its active role as a reactive material in the electrochemical reaction. The two clear peaks from the Ni and Au oxidations in the forward scan are not evident because they merge to form a single broad peak (see the red and pink curves at ~ 0.5 V in Fig. 3a). As the scan rate is reduced from 50 to 20 mV/s, two distinct oxidation peaks from the Ni and Au oxidations appear in the CV curve (Fig. S8). Because Au is less sensitive than Ni to glucose (Wang et al. 2013), the Au/Ni/LIG WE exhibits a reduced peak value in the CV curve. Next, the optimized bias voltage is determined before it is used to obtain the calibration curve of the current density versus glucose concentration by titration. By using three different bias voltages around the peak (i.e., 0.45, 0.50, and 0.55V) for the Ni_1/LIG WE, the chronoamperometry (CA) measurement indicates the best sensitivity from a bias voltage of 0.55 V, followed by 0.5 V and then 0.45 V (Fig. 3b). Because the Ni_1/LIG WE with the applied bias voltage of 0.5 V exhibits the highest signal-noise-ratio, the bias voltage of 0.5 V is chosen in the following CA measurement unless specified otherwise. The effect of the bias voltage on the Au_1/Ni_1/LIG electrode has also been investigated and the results similar to the Ni_1/LIG electrode have been observed (Fig. S9).
Fig. 3. Electrochemical characterization and glucose sensing performance of different WEs.

(a) Cyclic voltammetry (CV) curves of four different WEs in 0.05 M NaOH solutions with a scan rate of 50 mV/s. (b) Chrono amperometry response of the Ni_1/LIG WE with successive addition of glucose into gently stirred 0.05 M NaOH solutions under the applied potential of 0.45, 0.50, and 0.55 V. Chrono amperometry response of WEs with different Ni (c) and Au (e) plating time under an applied potential of 0.50 V in 0.05 M NaOH solutions. The linear range is defined by R2 > 0.99. Inset shows the linear fitting and regression equation of WEs in glucose sensing. The linear regression coefficient is 0.990, 0.993 and 0.991 for (c), and 0.994, 0.991, 0.992, 0.991 for (d). EIS measurements of WEs with a different Ni (d) and Au (f) plating time in 0.05 M NaOH solutions. The slop of the dashed line in (d) indicates the diffusion rate of electrodes, which is directly related to the porous structure.
The current at the WE increases with the successive addition of glucose solutions until saturation and the response time for all four WEs is within 3 s. In the plot of the current density versus glucose concentration (Fig. 3c), the slope of the linear range (with R2 > 0.99) gives the sensitivity, which gradually decreases with an increasing glucose concentration. Because of the preserved porous LIG structure, the WE with a short deposition time of Ni shows higher sensitivity, e.g., 972 μA·mM−1 cm−2 for the Ni_1/LIG WE and 926 μA·mM−1 cm−2 for the Ni_3/LIG WE. Compared with other electrode materials such as Au or Pt, LIG is cost-effective and can be easily patterned without masks. The porous 3D LIG foam also provides the Ni/LIG electrode with improved sensitivity, as compared with the Ni electrode without 3D structures (241 μA mM−1 cm−2). Reducing the deposition time from 1 min to 30 s further leads to an increased sensitivity of 1141 μA·mM−1 cm−2. However, further reducing the deposition time to 10 s leads to a much-decreased sensitivity of 825 μA·mM−1 cm−2 possibly due to the limited reactive materials (Fig. S10). These results indicate that there might exist an optimal deposition time between 10 and 60 s for the highest sensitivity. As the Ni plating time increases from 0.5 to 3 min, the circle radius in the electrochemical impedance spectroscopy (EIS) reduces, indicating a decreased charge-transfer resistance (Fig. 3d). However, the diffusion rate indicated by the slope in the low-frequency range decreases with the Ni plating duration because a thick Ni layer tends to block the pore in LIG. As a result, the Ni_3/LIG WE has the lowest sensitivity due to the reduced specific surface area. Take the Ni_1/LIG WE as an example, the thickness of Au on the sensing performance is investigated (Fig. 3e). 1-minute Au plating slightly improves the sensitivity from 972 μA·mM−1 cm−2 in Ni_1/LIG to 1080 μA mM−1 cm−2 in Au_1/Ni_1/LIG WE. With further increasing the Au plating time, the sensitivity decreases to 882 μA·mM−1 cm−2 for the Au_2/Ni_1/LIG WE and 790 μA·mM−1 cm−2 for the Au_3/Ni_1/LIG WE. The EIS measurement reveals that the Au coating helps to reduce the charge transfer resistance (Fig. 3f). It is anticipated that the introduction of a thin Au coating increases the roughness of the Ni surface and further increases the specific surface area. While Au plating of 1 min improves the diffusion rate, increasing the plating time to 2 or 3 min exhibits an opposite effect due to the reduced reactivity of Au than Ni. However, increasing the Au layer thickness seems to block the porous structure, leading to a reduced specific surface area. The linear range of the Au_1/Ni_1/LIG glucose sensor is from 0 to ~ 4 mM with a detection limit of 1.5 μM calculated from 3*SD/N, where SD and N is the standard deviation and slope of the linear fitting of the calibration curve, respectively. The demonstrated linear range is also able to cover the glucose concentration in sweat (0.01 – 2 mM) (Bhide et al. 2018; Karpova et al. 2019), tears (0.5 – 5 mM) (Sen and Sarin 1980), and saliva (0.55 – 1.77 mM) (Bruen et al. 2017). The Ni/LIG-based non-enzymatic glucose sensor exhibits a much wider linear range, compared with previously reported Ni nanoparticle-based ones (0.002 – 1.0 mM) (Cui et al. 2019). It is also noted that the photo-reduction from the laser can be explored for laser-induced metals (e.g., nickel, gold, and copper) (Khairullina et al. 2018; Narayanan and Slaughter 2018; Sedaghat et al. 2020) for non-enzymatic glucose sensing, which will be investigated in the future. The Au_1/Ni_1/LIG WE demonstrates a large linear range (0 – 30 mM) with a sensitivity of 89 μA·mM−1·cm−2 under a bias voltage of 0.1 V due to the Au (0)/Au (I) redox (Fig. S11). The low bias voltage is beneficial for reduced power consumption and improved selectivity by reduced (or eliminated) potential oxidation of other species in the biofluids. The demonstrated sensitivity under a bias voltage of 0.5 V is ~ 4 times of the non-enzymatic LIG glucose sensor (247.3 μA·mM−1·cm−2) (Zahed et al. 2020). After replacing the porous LIG foam with LIG fiber (LIGF, Fig. S12a), the Au/Ni_1/LIGF glucose sensor with the same dimensions exhibits an even higher sensitivity of ~3500 μA·mM−1·cm−2 due to an increased specific surface area (Duy et al. 2018) (Fig. S12b). A comprehensive comparison of the sensing performance of the proposed and previously reported glucose sensors are made in Table 1. In summary, the non-enzymatic LIG glucose sensors demonstrated in this work compare favorably with the previous reports on Ni-based (Cui et al. 2015; Sedaghat et al. 2020), Au-based (Shen et al. 2019a; Wu et al. 2013; Zhong et al. 2017), and bimetal-based (Fu et al. 2015; Gao et al. 2020; Lee et al. 2019; Qin et al. 2017; Zhou et al. 2020) glucose sensors (Table 1). In particular, the dual working modes (high sensitivity in a narrow linear range @ 0.1 V or low sensitivity in a wide linear range @ 0.5V) can be of high interest for a diverse range of applications. Although the Au/Ni/LIG glucose sensor already showcases a favorable sensitivity and linear rang in 0.05 M NaOH (pH = 12.5), a higher reaction activity can be achieved in 0.1 M NaOH (pH = 13) (Fig. S13), which can further improve the sensitivity and linear range (Yang et al. 2020b). To demonstrate the applicability of the non-enzymatic glucose sensor in other basic solutions, 0.05 M KOH has also been explored as a representative example, which shows almost identical sensing performance (Fig. S14). Since the sensitivity of the Au/Ni_1/LIG glucose sensor in the 0.05 M NaOH solution is enough for measuring the glucose concentration in sweat, it is used in the following demonstrations for safer wearable applications unless otherwise specified. It should be noted that the other glucose sensors with higher sensitivity such as the one with Ni plating of 30 s or optimum time hold high potential to measure the breath glucose of ultralow concentration. Despite the highest sensitivity in the LIGF-based glucose sensor, the LIGFs with an average height of ~ 2 mm make them prone to damage upon mechanical deformations. However, the encapsulation or integration strategies can be explored to use LIGF-based glucose sensors in future research.
Table 1.
Comparison of non-enzymatic glucose sensors
| Electrode materials | Sensitivity (μA mM−1 cm−2) | LOD (μM) | Linear Range | Response time | Real-time sample | Measurement environment | Reference |
|---|---|---|---|---|---|---|---|
| NiO microspheres | 30190 | 2 | 0.002 – 1.279 mM | N/A | no | 0.1 M NaOH | (Cui et al. 2015) |
| Porous NiO | 5222 | 3.31 | 0.005 – 1.1 mM | N/A | no | 0.1 M NaOH | (Sedaghat et al. 2020) |
| Au foam | N/A | 0.14 | 0.0005 – 12 mM | N/A | human serum | 0.3 M NaOH | (Shen et al. 2019a) |
| Au network | N/A | 0.2 | 1 – 500 μM | < 2 s | no | 0.2 M NaOH | (Zhong et al. 2017) |
| Au/graphene | 97.8 | 0.062 | 0 – 10 mM | < 3 s | no | 0.1 M NaOH | (Wu et al. 2013) |
| Core-shell Au/Ni | 23.17 | 15.7 | 0.5 – 10 mM | < 1 s | no | 0.1 M NaOH | (Gao et al. 2020) |
| Au/Ni/Al | 1989 | 1 | 0.01 – 6.1 mM | < 5 s | serum | 0.1 M NaOH | (Fu et al. 2015) |
| Au/Ni | 30.58 | 5.84 | 0 – 30 mM | < 1 s | blood | PBS (pH 7.4) | (Lee et al. 2019) |
| Au/Ni dendrite | 4035 | 0.2 | 0 – 3 mM | < 3 s | no | 0.1 M NaOH | (Zhou et al. 2020) |
| Ni/Au nanowire | 3372 | 0.1 | 0.25 – 2 mM | < 5 s | no | 0.2 M NaOH | (Qin et al. 2017) |
| Au/Ni/LIG (LIGF) | 1200 (LIG) 3500 (LIGF) | 1.5 | 0 – ~ 4 mM @ 0.5 V or 0 – 30 mM @ 0.1 V | <1 s | sweat, cell culture media | 0.05 M NaOH | This work |
The method used in the fabrication of glucose sensors cited in Table 1 (From top to bottom): Hydrothermal reaction, laser-induced oxidation, templated-assisted electroplating, templated-assisted reduction, hydrothermal reaction, hydrothermal reaction, hydrothermal reaction, electroplating, electroplating, templated-assisted electroplating.
3.2. Sensing performance at different pH levels and under deformations
Because of the biofluids with varied pH levels, it is of high interest to investigate the sensing performance of non-enzymatic glucose sensors in solutions with different pH values. As the alkaline solution provides the hydroxide for the oxidation of glucose, the lower pH value from 12.5 to 10.5 in the base solution results in a lower CV peak in the Au/Ni_1/LIG glucose sensor (Fig. 4a). Further decreasing the pH from 10.5 to 10.0 leads to an almost vanishing CV peak (Fig. S15), implying a deactivated electrochemical reaction. These results imply that non-enzymatic glucose sensing is highly pH-dependent and it is essential to maintain a suitable pH environment for high-performance sensing. As a result of the lower CV peak, the sensitivity also significantly reduces from 952 to 98 μA·mM−1·cm−2 (Fig. 4b). The high sensitivity in less alkaline solutions is possibly attributed to the additional noble metal of Au (Chinnadayyala et al. 2018; Jiang et al. 2014; Wang et al. 2008). Though the requirement is significantly reduced in terms of the needed pH for the proposed sensor, the non-enzymatic glucose sensors still cannot be directly applied for measurements in human sweat that is near neutral or moderately acidic. Therefore, this work explores a reaction cavity with a porous Ecoflex containing 0.05 mM NaOH solutions to provide an alkaline environment for the non-enzymatic glucose sensor. When the porous encapsulating reaction cavity is filled with a solution with a pH of 12.5 or 10.5, the measured CV curves still exhibit the “dual-peak” in the reverse scan in the former and a smaller peak current in the latter (Fig. 4c). The effectiveness of the porous encapsulating reaction cavity with the above two different solutions (i.e., pH of 12.5 or 10.5) in the encapsulated glucose sensor is demonstrated with the glucose measurements. The measured sensitivity of the encapsulated glucose sensor with the pH 12.5 (or 10.5) reaction cavity is 930 (or 95) μA·mM−1·cm−2 (Fig. 4d), which is close to the value from the sensor in the corresponding open pH solution (Fig. 4b). Therefore, the required alkaline environment in the sampling solution can be effectively removed when the encapsulated non-enzymatic glucose sensors are exploited. Furthermore, the sweat of 1000 mL with a pH of 6 (Jadoon et al. 2015) will need to be added into the porous encapsulating reaction cavity with a pH of 12.5 to reduce its pH down to 10, which implies a longer operation time of the encapsulated glucose sensor when used for on-body wearable measurements.
Fig. 4. Electrochemical characterization of the Au/Ni glucose sensor (a, b) without or (c, d) with the recreation cavity in the solution with different pH levels (i.e., 10.5 or 12.5) or under deformations (e, f).

(a) and (c) CV curves of the Au_1/Ni_1/LIG glucose sensor. (b) and (d) Current density as a function of the glucose concentration for the Au_1/Ni_1/LIG glucose sensor. Inset in (b) and (d) shows the linear fitting and regression equation of WEs in glucose sensing. The linear regression coefficient is 0.995 and 0.992 for (b), and 0.996 and 0.991 for (d). (e) Chrono amperometry response and (f) current density versus glucose concentration of the flexible glucose sensor in a flat or bending state measured in 0.05 M NaOH solutions. Mechanical durability (500 cycles of bending, the blue curve) and electrochemical stability (immersion in PBS solutions with 0.1 mM NaCl for 30 days, the magenta curve) were also conducted. Inset shows the linear fitting and regression equation of WEs in glucose sensing.
Because of the intrinsically flexible property of the LIG WE/RE/CE integrated on a soft PDMS substrate, the resulting flexible, the compact glucose sensor is able to accommodate various bending deformations without performance change in glucose sensing. Attaching the flexible glucose sensor to a cylinder tube with a radius of 5 mm indeed showcases a small to negligible change in the response time, sensitivity, and measurement range (Fig. 4e). Compare to the flat Au_1/Ni_1/LIG sensor with a sensitivity of 1156 μA·mM−1·cm−2, the measured sensitivity of 1123 μA·mM−1·cm−2 only shows a 2% variation (Fig. 4f). The almost unchanged sensitivity is also observed after the cyclic bending of 500 cycles to indicate cyclic stability of the sensor (blue curve, Fig. 4f). After the sensor immersion in PBS solutions with 0.1 M NaCl for 30 days, the Au_1/Ni_1/LIG WE exhibits almost unchanged sensitivity (magenta curve, Fig. 4f).
3.3. Specificity of the flexible glucose sensor
Although the selectivity of the non-enzymatic glucose sensors is often less than their enzymatic counterparts, our Au/Ni/LIG glucose sensor still highlights excellent selectivity against various interferences. Compared to the significant response to glucose (0.1 mM), little or almost no response is observed to these interfering substances, including 0.02 mM ascorbic acid (AA), dopamine hydrochloride (DA), uric acid (UA), acetaminophen, lactose, sucrose, fructose, lactate, urea, 1.5 mM glycine, and 0.2 mM NaCl, KCl, CaCl2, and NaHCO3 solutions (Fig. 5a and S16). The good specificity of the demonstrated glucose sensor in this work allows it to accurately measure the glucose concentration of the sample with complex interfering substances. As a demonstration, the non-enzymatic glucose sensor accurately measures the glucose concentration in various cell culture media (Fig. 5b). Despite the complex composites (e.g., salts, amino acids, glucose, and cell-secreted factors) in the media for stem cell culture, the glucose concentrations of the off-the-shelf cell culture media (DMEM and RPMI) measured by our glucose sensor agrees with those from the commercial glucose sensors very well. The measured glucose concentration of 21 mM (or 15 mM) in DMEM (or RPMI) with the flexible glucose sensor is reasonably close to that measured by the commercial one of 23 mM (or 13 mM). After the medium of L7 is used for cell culture for 24 h, the glucose concentration of 15 mM measured with our flexible glucose sensor still agrees with the value of 13 mM from the commercial one. Although the accuracy of the flexible glucose sensor can be further enhanced with a more accurate titration process, the accuracy in measuring glucose concentration is reasonably well in this proof-of-concept demonstration.
Fig. 5. Demonstrations of the flexible glucose sensor under deformation or the encapsulated glucose sensor on-body.

(a) Selectivity of the flexible glucose sensor against various interfering substances. (b) Comparison of the measured glucose in cell culture media between the commercial and demonstrated glucose sensors. (c) Optical image of the encapsulated glucose sensor attached to the arm of a healthy human subject, with the top, side, and back views of the encapsulated glucose sensor shown in the low panel. (d) Chrono amperometry response of the encapsulated glucose sensor to human sweats collected 1 or 3 h after a meal from a healthy subject. (e) The exploded view of the integrated microfluidic non-enzymatic glucose sensor for sweat sampling and glucose sensing (without the porous Ecoflex reaction cavity for clarity) (left). The increased hydrophilicity of PDMS from the air plasma and PVP treatment allows for easy and rapid fluid collection (right), with the red arrows to indicate the advancing front of the air-fluid interface in the microfluidic channel. (f) Optical images of the microfluidic non-enzymatic glucose sensors attached to the human arm and forehead (Scale bar: 1 cm). The measurements of the sweat glucose concentration after the meal at 1 hour and 3 hours by the integrated microfluidic non-enzymatic glucose sensor were compared with those by the commercial glucose sensor and the in vitro testing (i.e., manual titration of the collected sweat into the reaction cavity).
3.4. Integrated microfluidic devices for on-body glucose measurements
In the encapsulated non-enzymatic glucose sensor, the porous encapsulating reaction cavity not only retains NaOH solutions to provide a relatively stable pH environment but also reduces evaporation while allowing sweat diffusion. The volume of NaOH electrolytes was carefully calibrated by micropipettes and kept fixed before glucose measurements. Compared to the design with an open cavity, the porous cavity reduces the evaporation rate by ~ 24% (Fig. S17). The reduced evaporation can allow the glucose sensor to achieve long durability, which is especially important for wearable applications. The porous Ecoflex encapsulation also exhibits much-improved hydrophilicity, manifested by a much-reduced contact angle of 37° compared to the solid slab of 128° (Fig. S18). As a result, the porous encapsulation facilitates the diffusion of the sampling solution with spontaneous wicking. Furthermore, the porous encapsulation is able to retain the NaOH solution within the cavity between it and the compact sensor, even when the encapsulated glucose sensor is flipped over or deformed from bending (Supplementary Video S1). Because of the well-maintained alkaline environment, the encapsulated glucose sensor can still provide accurate and reliable measurements of the glucose concentration in the prepared solutions (Fig. S19). Compared to the measurement in an electrochemical cell, a longer response time is observed because of the diffusion barrier. Perforation of the porous Ecoflex encapsulation with small patterned holes by laser cutting reduces the response time from ~6 min to 4 min while leaving the capability to retain the NaOH solution unaltered.
Next, the on-body performance is demonstrated by attaching the encapsulated glucose sensor to the arm of a healthy human subject after a workout (rowing machine) with an additional adhesive layer of Silbione (Fig. 5c and Supplementary Video S2). The glucose analysis in sweat is first performed either 1 or 3 h after lunch from one healthy human subject (Fig. 5d). The glucose concentration is obtained by adding 0.05 mL sweat samples to the reactive cavity for measuring the current response. The measurement indicates that the glucose concentration in sweat decreases from 0.26 mM to 0.15 mM. Even though the sweat volume is much smaller than that of the NaOH solution in the reaction cavity, the long-term use with excessive sweat may change the pH value of the NaOH solution. Therefore, it is crucial to monitor the pH value in the reaction cavity or in the sweat to help inform the pH change in the reaction cavity. Demonstration of this idea includes an additional WE prepared by depositing polyaniline (PANI) on LIG. The pH value is determined from the potential difference between the PANI/LIG WE and the RE (Fig. S20). With the measured pH value in real-time, the glucose concentration obtained from the calibration curve at the given pH value provides a more accurate result (Lee et al. 2017). In fact, the sweat glucose concentration of 0.29 mM (0.19 mM) calculated at the measured pH level is indeed higher than that of 0.26 mM (0.15 mM) calculated at the initial pH level, which agrees better with the measurements from the commercial glucose sensors (Fig. 5f).
The wearable non-enzymatic glucose sensor can also be integrated with a soft, skin-interfaced microfluidic component for real-time sweat sampling and glucose analysis (Fig. 5e). The electrical connection from the electrodes of the glucose sensor to the electrochemical station is made with thin copper wires and silver paste, which is further encapsulated by a thin layer of PDMS to improve mechanical robustness (Fig. S21). In the soft microfluidic component, the channel layer with a glucose sensor is sandwiched between a top capping layer and an adhesive layer that can pliably attach to the skin. The porous Ecoflex containing the NaOH solution is replaceable in the reaction cavity to provide the basic environment for glucose sensing. Because of the improved hydrophilicity in the channel layer after the air plasma and PVP treatment to create C=O and -OH groups (Zhang et al. 2020b) (Fig. S22), the sweat can be spontaneously wicked into the microfluidic channel for efficient sweat sampling. The inlet with a diameter of 3 mm covers ~ 9 sweat glands, which also leads to rapid sweat collection from the human arm or forehead. The average sweat flow rate of 0.4 μL/min per sweat gland after a 7-min workout with a rowing machine is calculated from the ratio of the channel volume (0.576 μL) between two chamber markers (arc length of 4.8 mm) to the corresponding filling time (9.6 s). The sweat volume collected into the reaction cavity is the product of the sweat flow rate and the time interval. The glucose concentration in sweat measured by the integrated microfluidic glucose sensor shows a consistent decrease from 0.31 to 0.20 mM, which agrees with the measurements of 0.34 and 0.23 mM from the commercial glucose sensor (Fig. 5f). The use of the replaceable porous Ecoflex in the reaction cavity allows the replacement of the NaOH solution and cleaning of the microfluidic channel with the distilled water, which regenerates the integrated device for reuse. The regenerated device provides the measured glucose concentrations of 0.30 mM and 0.21 mM, which are consistent with measurements from the freshly prepared device. By exploiting multiple sensing chambers with hydrophobic valves (Zhang et al. 2020b), the sweat can be sequentially collected into each sensing chamber along the microfluidic channel at different times for chrono-sampling and glucose sensing.
The paired t-test was performed to evaluate the measured data for three cell media and two sweat samples (Table 2). Each sample was measured three times. The t-value is calculated to be 0.58 and 1.35 for the cell media and sweat sample, which is much smaller than the critical value (1.76 or 2.02) at the 95% confidence level (n = 9 or 6). The demonstrated non-enzymatic glucose sensor could also be integrated with wireless measurement units to provide real-time monitoring capabilities.
Table 2.
Measured glucose concentration in the cell culture media or sweat samples by the proposed glucose sensors and the commercial one.
| Samples | Au_1/Ni/LIG | Commercial |
|---|---|---|
| Mean (SD) (mM) | ||
| L7 | 15.0 (± 1.1) | 13.2 (± 1.2) |
| DMEM | 21.1 (± 1.5) | 22.8 (±1.7) |
| RPMI | 9.9 (± 0.71) | 8.5 (±0.8) |
| Sweat 1 | 0.29(±0.02) | 0.34 (±0.04) |
| Sweat 2 | 0.19 (± 0.01) | 0.23 (±0.02) |
4. Conclusion
This work demonstrates the use of 3D porous LIG foams or fibers on a flexible, thin-film substrate and electroless plating of Ni and Au for high-performance non-enzymatic glucose sensors. With well-maintained porosity in the 3D LIG foam scaffold, the resulting glucose sensor exhibits high sensitivity. The Au/Ni co-plating imparts the glucose sensor dual working modes: the high sensitivity in a small linear range or the low sensitivity in a large linear range. The sensitivity is further improved by 3.7 times when the flexible substrate with LIG fibers is explored. Before the use of the porous encapsulating reaction cavity, the non-enzymatic glucose sensor still demonstrates a higher sensitivity in the relatively mild base solution (pH = 10) than those in the strong base solutions in the literature, attributing to the Au layer. The demonstrated sensitivity and linear range compare favorably with those in the literature reports. Moreover, the encapsulated glucose sensor with a reaction cavity to provide a mildly alkaline environment further removes the need for an alkaline sampling solution. The exceptional sensitivity and selectivity of the LIG-based non-enzymatic glucose sensor ensure precise measurement of the glucose concentration in the complex sampling solutions (e.g., stem cell culture media and human sweat). In addition to retain the mild NaOH solution inside the reaction cavity even upon flipping over severe deformation, the porous Ecoflex encapsulation with improved hydrophilic properties also facilitates the diffusion of the sampling solutions and reduces the evaporation for fast and more accurate measurements. By integrating a microfluidic component for sweat sampling and a replaceable solution in the reaction cavity for sensor regeneration, the microfluidic non-enzymatic glucose sensor establishes the potential for future long-term monitoring of glucose and other biomarkers in sweat and other biofluids.
Supplementary Material
Highly sensitive flexible nonenzymatic glucose sensors based on laser-induced graphene (LIG) or graphene fibers (LIGF).
Simple electroless plating of Ni and Au with the different deposition time contributes to controllable sensitivity
Integration of a soft, skin-interfaced microfluidic component to non-enzymatic glucose sensors for sweat sampling and glucose sensing.
Acknowledgments
This work was supported by the National Science Foundation (NSF) (Grant No. ECCS-1933072), the National Heart, Lung, And Blood Institute of the National Institutes of Health under Award Number R61HL154215, and the start-up fund at Penn State University. The partial support from various Penn State Seed Grants provided by the Center for Biodevices, the College of Engineering, and the Center for Security Research and Education is also acknowledged. J.Z. would like to acknowledge the Leighton Riess Graduate Fellowship and Diefenderfer Graduate Fellowship in Engineering at Penn State University.
Footnotes
Publisher's Disclaimer: This is a PDF file of an unedited manuscript that has been accepted for publication. As a service to our customers we are providing this early version of the manuscript. The manuscript will undergo copyediting, typesetting, and review of the resulting proof before it is published in its final form. Please note that during the production process errors may be discovered which could affect the content, and all legal disclaimers that apply to the journal pertain.
Declaration of interests
The authors declare that they have no known competing financial interests or personal relationships that could have appeared to influence the work reported in this paper. One or more provisional patents are being filed on this work.
Appendix A. Supplementary data
Supplementary information is available for this paper.
References
- Amir O, Weinstein D, Zilberman S, Less M, Perl-Treves D, Primack H, Weinstein A, Gabis E, Fikhte B, Karasik A, 2007. Continuous Noninvasive Glucose Monitoring Technology Based on “Occlusion Spectroscopy”. Journal of Diabetes Science and Technology 1(4), 463–469. [DOI] [PMC free article] [PubMed] [Google Scholar]
- Baghayeri M, Ansari R, Nodehi M, Veisi H, 2018. Designing and fabrication of a novel gold nanocomposite structure: application in electrochemical sensing of bisphenol A. International Journal of Environmental Analytical Chemistry 98(9), 874–888. [Google Scholar]
- Beams R, Gustavo Cançado L, Novotny L, 2015. Raman characterization of defects and dopants in graphene. Journal of Physics: Condensed Matter 27(8), 083002. [DOI] [PubMed] [Google Scholar]
- Bhide A, Muthukumar S, Saini A, Prasad S, 2018. Simultaneous lancet-free monitoring of alcohol and glucose from low-volumes of perspired human sweat. Scientific Reports 8(1), 6507. [DOI] [PMC free article] [PubMed] [Google Scholar]
- Bruen D, Delaney C, Florea L, Diamond D, 2017. Glucose Sensing for Diabetes Monitoring: Recent Developments. Sensors (Basel) 17(8). [DOI] [PMC free article] [PubMed] [Google Scholar]
- Cheng T-M, Huang T-K, Lin H-K, Tung S-P, Chen Y-L, Lee C-Y, Chiu H-T, 2010. (110)-Exposed Gold Nanocoral Electrode as Low Onset Potential Selective Glucose Sensor. ACS Applied Materials & Interfaces 2(10), 2773–2780. [DOI] [PubMed] [Google Scholar]
- Chinnadayyala SR, Park I, Cho S, 2018. Nonenzymatic determination of glucose at near neutral pH values based on the use of nafion and platinum black coated microneedle electrode array. Microchimica Acta 185(5), 250. [DOI] [PubMed] [Google Scholar]
- Cui N, Guo P, Yuan Q, Ye C, Yang M, Yang M, Chee KWA, Wang F, Fu L, Wei Q, Lin C-T, Gao J, 2019. Single-Step Formation of Ni Nanoparticle-Modified Graphene-Diamond Hybrid Electrodes for Electrochemical Glucose Detection. Sensors (Basel, Switzerland) 19(13), 2979. [DOI] [PMC free article] [PubMed] [Google Scholar]
- Cui Z, Yin H, Nie Q, 2015. Controllable preparation of hierarchically core–shell structure NiO/C microspheres for non-enzymatic glucose sensor. Journal of Alloys and Compounds 632, 402–407. [Google Scholar]
- Dai Y, Molazemhosseini A, Abbasi K, Liu CC, 2018. A Cuprous Oxide Thin Film Non-Enzymatic Glucose Sensor Using Differential Pulse Voltammetry and Other Voltammetry Methods and a Comparison to Different Thin Film Electrodes on the Detection of Glucose in an Alkaline Solution. Biosensors 8(1), 4. [DOI] [PMC free article] [PubMed] [Google Scholar]
- Davoodi E, Montazerian H, Haghniaz R, Rashidi A, Ahadian S, Sheikhi A, Chen J, Khademhosseini A, Milani AS, Hoorfar M, Toyserkani E, 2020. 3D-Printed Ultra-Robust Surface-Doped Porous Silicone Sensors for Wearable Biomonitoring. ACS Nano 14(2), 1520–1532. [DOI] [PubMed] [Google Scholar]
- dos Santos WAT, dos Santos WIA, de Assis SL, Terada M, Costa I, 2013. Bronze as alternative for replacement of nickel in intermediate layers underneath gold coatings. Electrochimica Acta 114, 799–804. [Google Scholar]
- Duy LX, Peng Z, Li Y, Zhang J, Ji Y, Tour JM, 2018. Laser-induced graphene fibers. Carbon 126, 472–479. [Google Scholar]
- Ensafi AA, Abarghoui MM, Rezaei B, 2014. A new non-enzymatic glucose sensor based on copper/porous silicon nanocomposite. Electrochimica Acta 123, 219–226. [Google Scholar]
- Ferrari AC, Basko DM, 2013. Raman spectroscopy as a versatile tool for studying the properties of graphene. Nature Nanotechnology 8(4), 235–246. [DOI] [PubMed] [Google Scholar]
- Fu S, Fan G, Yang L, Li F, 2015. Non-enzymatic glucose sensor based on Au nanoparticles decorated ternary Ni-Al layered double hydroxide/single-walled carbon nanotubes/graphene nanocomposite. Electrochimica Acta 152, 146–154. [Google Scholar]
- Gao X, Du X, Liu D, Gao H, Wang P, Yang J, 2020. Core-shell gold-nickel nanostructures as highly selective and stable nonenzymatic glucose sensor for fermentation process. Scientific Reports 10(1), 1365. [DOI] [PMC free article] [PubMed] [Google Scholar]
- Gupta J, Arya S, Verma S, Singh A, Sharma A, Singh B, Prerna, Sharma R, 2019. Performance of template-assisted electrodeposited Copper/Cobalt bilayered nanowires as an efficient glucose and Uric acid senor. Materials Chemistry and Physics 238, 121969. [Google Scholar]
- Hovancová J, Šišoláková I, Vanýsek P, Oriňaková R, Shepa I, Vojtko M, Oriňak A, 2019. Nanostructured Gold Microelectrodes for Non-enzymatic Glucose Sensor. Electroanalysis 31(9), 1680–1689. [Google Scholar]
- Jadoon S, Karim S, Akram MR, Kalsoom Khan A, Zia MA, Siddiqi AR, Murtaza G, 2015. Recent developments in sweat analysis and its applications. Int J Anal Chem 2015, 164974–164974. [DOI] [PMC free article] [PubMed] [Google Scholar]
- Jiang G, Jiang T, Wang Y, Du X, Wei Z, Zhou H, 2014. Facile preparation of novel Au–polydopamine nanoparticles modified by 4-mercaptophenylboronic acid for use in a glucose sensor. RSC Advances 4(64), 33658–33661. [Google Scholar]
- Karpova EV, Shcherbacheva EV, Galushin AA, Vokhmyanina DV, Karyakina EE, Karyakin AA, 2019. Noninvasive Diabetes Monitoring through Continuous Analysis of Sweat Using Flow-Through Glucose Biosensor. Analytical Chemistry 91(6), 3778–3783. [DOI] [PubMed] [Google Scholar]
- Khairullina EM, Safonov SV, Logunov LS, Panov MS, 2018. Non-enzymatic glucose sensors based on metal structures produced by laser-induced deposition from solution. Materials Today: Proceedings 5(11, Part 1), 22798–22805. [Google Scholar]
- Kim J, Campbell AS, Wang J, 2018. Wearable non-invasive epidermal glucose sensors: A review. Talanta 177, 163–170. [DOI] [PubMed] [Google Scholar]
- Koschinsky T, Heinemann L, 2001. Sensors for glucose monitoring: technical and clinical aspects. Diabetes/Metabolism Research and Reviews 17(2), 113–123. [DOI] [PubMed] [Google Scholar]
- Lee H, Hong YJ, Baik S, Hyeon T, Kim D-H, 2018. Enzyme-Based Glucose Sensor: From Invasive to Wearable Device. Advanced Healthcare Materials 7(8), 1701150. [DOI] [PubMed] [Google Scholar]
- Lee H, Song C, Hong YS, Kim MS, Cho HR, Kang T, Shin K, Choi SH, Hyeon T, Kim D-H, 2017. Wearable/disposable sweat-based glucose monitoring device with multistage transdermal drug delivery module. Science Advances 3(3), e1601314. [DOI] [PMC free article] [PubMed] [Google Scholar]
- Lee W-C, Kim K-B, Gurudatt NG, Hussain KK, Choi CS, Park D-S, Shim Y-B, 2019. Comparison of enzymatic and non-enzymatic glucose sensors based on hierarchical Au-Ni alloy with conductive polymer. Biosensors and Bioelectronics 130, 48–54. [DOI] [PubMed] [Google Scholar]
- Lim H-R, Hillman N, Kwon Y-T, Kim Y-S, Choa Y-H, Yeo W-H, 2020. Ultrathin, long-term stable, solid-state reference electrode enabled by enhanced interfacial adhesion and conformal coating of AgCl. Sensors and Actuators B: Chemical 309, 127761. [Google Scholar]
- Ling W, Liew G, Li Y, Hao Y, Pan H, Wang H, Ning B, Xu H, Huang X, 2018. Materials and Techniques for Implantable Nutrient Sensing Using Flexible Sensors Integrated with Metal–Organic Frameworks. Advanced Materials 30(23), 1800917. [DOI] [PubMed] [Google Scholar]
- Liu H, Wu X, Yang B, Li Z, Lei L, Zhang X, 2015. Three-Dimensional Porous NiO Nanosheets Vertically Grown on Graphite Disks for Enhanced Performance Non-enzymatic Glucose Sensor. Electrochimica Acta 174, 745–752. [Google Scholar]
- Lu L-M, Zhang L, Qu F-L, Lu H-X, Zhang X-B, Wu Z-S, Huan S-Y, Wang Q-A, Shen G-L, Yu R-Q, 2009. A nano-Ni based ultrasensitive nonenzymatic electrochemical sensor for glucose: Enhancing sensitivity through a nanowire array strategy. Biosensors and Bioelectronics 25(1), 218–223. [DOI] [PubMed] [Google Scholar]
- Menné T, Nieboer E, 1989. Metal contact dermatitis: a common and potentially debilitating disease. Endeavour 13(3), 117–122. [DOI] [PubMed] [Google Scholar]
- Muthuchamy N, Gopalan A, Lee K-P, 2018. Highly selective non-enzymatic electrochemical sensor based on a titanium dioxide nanowire–poly(3-aminophenyl boronic acid)–gold nanoparticle ternary nanocomposite. RSC Advances 8(4), 2138–2147. [DOI] [PMC free article] [PubMed] [Google Scholar]
- Narayanan JS, Slaughter G, 2018. Flexible Non-Enzymatic Glucose Biosensor Based on Gold-Platinum Colloidal. 2018 IEEE SENSORS, pp. 1–4. [Google Scholar]
- Pang Y, Tian H, Tao L, Li Y, Wang X, Deng N, Yang Y, Ren T-L, 2016. Flexible, Highly Sensitive, and Wearable Pressure and Strain Sensors with Graphene Porous Network Structure. ACS Applied Materials & Interfaces 8(40), 26458–26462. [DOI] [PubMed] [Google Scholar]
- Peng Z, Lin J, Ye R, Samuel ELG, Tour JM, 2015. Flexible and Stackable Laser-Induced Graphene Supercapacitors. ACS Applied Materials & Interfaces 7(5), 3414–3419. [DOI] [PubMed] [Google Scholar]
- Qin L, He L, Zhao J, Zhao B, Yin Y, Yang Y, 2017. Synthesis of Ni/Au multilayer nanowire arrays for ultrasensitive non-enzymatic sensing of glucose. Sensors and Actuators B: Chemical 240, 779–784. [Google Scholar]
- Qiu H, Huang X, 2010. Effects of Pt decoration on the electrocatalytic activity of nanoporous gold electrode toward glucose and its potential application for constructing a nonenzymatic glucose sensor. Journal of Electroanalytical Chemistry 643(1), 39–45. [Google Scholar]
- Sattar MA, Conway BE, 1969. Electrochemistry of the nickel-oxide electrode—VI. Surface oxidation of nickel anodes in alkaline solution. Electrochimica Acta 14(8), 695–710. [Google Scholar]
- Sedaghat S, Piepenburg CR, Zareei A, Qi Z, Peana S, Wang H, Rahimi R, 2020. Laser-Induced Mesoporous Nickel Oxide as a Highly Sensitive Nonenzymatic Glucose Sensor. ACS Applied Nano Materials 3(6), 5260–5270. [Google Scholar]
- Sehit E, Altintas Z, 2020. Significance of nanomaterials in electrochemical glucose sensors: An updated review (2016–2020). Biosensors and Bioelectronics 159, 112165. [DOI] [PubMed] [Google Scholar]
- Sen DK, Sarin GS, 1980. Tear glucose levels in normal people and in diabetic patients. Br J Ophthalmol 64(9), 693–695. [DOI] [PMC free article] [PubMed] [Google Scholar]
- Shen N, Xu H, Zhao W, Zhao Y, Zhang X, 2019a. Highly Responsive and Ultrasensitive Non-Enzymatic Electrochemical Glucose Sensor Based on Au Foam. Sensors (Basel, Switzerland) 19(5), 1203. [DOI] [PMC free article] [PubMed] [Google Scholar]
- Shen N, Xu H, Zhao W, Zhao Y, Zhang X, 2019b. Highly Responsive and Ultrasensitive Non-Enzymatic Electrochemical Glucose Sensor Based on Au Foam. Sensors 19(5). [DOI] [PMC free article] [PubMed] [Google Scholar]
- Si P, Huang Y, Wang T, Ma J, 2013. Nanomaterials for electrochemical non-enzymatic glucose biosensors. RSC Advances 3(11), 3487–3502. [Google Scholar]
- Stanford MG, Yang K, Chyan Y, Kittrell C, Tour JM, 2019. Laser-Induced Graphene for Flexible and Embeddable Gas Sensors. ACS Nano 13(3), 3474–3482. [DOI] [PubMed] [Google Scholar]
- Sun B, McCay RN, Goswami S, Xu Y, Zhang C, Ling Y, Lin J, Yan Z, 2018. Gas-Permeable, Multifunctional On-Skin Electronics Based on Laser-Induced Porous Graphene and Sugar-Templated Elastomer Sponges. Advanced Materials 30(50), 1804327. [DOI] [PubMed] [Google Scholar]
- Tehrani F, Bavarian B, 2016. Facile and scalable disposable sensor based on laser engraved graphene for electrochemical detection of glucose. Scientific Reports 6(1), 27975. [DOI] [PMC free article] [PubMed] [Google Scholar]
- van Enter BJ, von Hauff E, 2018. Challenges and perspectives in continuous glucose monitoring. Chemical Communications 54(40), 5032–5045. [DOI] [PubMed] [Google Scholar]
- Wang G, He X, Wang L, Gu A, Huang Y, Fang B, Geng B, Zhang X, 2013. Non-enzymatic electrochemical sensing of glucose. Microchimica Acta 180(3), 161–186. [Google Scholar]
- Wang H-C, Lee A-R, 2015. Recent developments in blood glucose sensors. Journal of Food and Drug Analysis 23(2), 191–200. [DOI] [PMC free article] [PubMed] [Google Scholar]
- Wang J, Thomas DF, Chen A, 2008. Nonenzymatic Electrochemical Glucose Sensor Based on Nanoporous PtPb Networks. Analytical Chemistry 80(4), 997–1004. [DOI] [PubMed] [Google Scholar]
- Wu J-W, Wang C-H, Wang Y-C, Chang J-K, 2013. Ionic-liquid-enhanced glucose sensing ability of non-enzymatic Au/graphene electrodes fabricated using supercritical CO2 fluid. Biosensors and Bioelectronics 46, 30–36. [DOI] [PubMed] [Google Scholar]
- Yang L, Yi N, Zhu J, Cheng Z, Yin X, Zhang X, Zhu H, Cheng H, 2020a. Novel gas sensing platform based on a stretchable laser-induced graphene pattern with self-heating capabilities. Journal of Materials Chemistry A 8(14), 6487–6500. [Google Scholar]
- Yang LW, Liu EE, Xu AF, Chen JY, Wang RT, Xu G, 2020b. Improving Linear Range Limitation of Non-Enzymatic Glucose Sensor by OH− Concentration. Crystals 10(3). [Google Scholar]
- Yang Y, Song Y, Bo X, Min J, Pak OS, Zhu L, Wang M, Tu J, Kogan A, Zhang H, Hsiai TK, Li Z, Gao W, 2020c. A laser-engraved wearable sensor for sensitive detection of uric acid and tyrosine in sweat. Nature Biotechnology 38(2), 217–224. [DOI] [PubMed] [Google Scholar]
- Yoon H, Nah J, Kim H, Ko S, Sharifuzzaman M, Barman SC, Xuan X, Kim J, Park JY, 2020. A chemically modified laser-induced porous graphene based flexible and ultrasensitive electrochemical biosensor for sweat glucose detection. Sensors and Actuators B: Chemical 311, 127866. [Google Scholar]
- Yu Y, Nyein HYY, Gao W, Javey A, 2020. Flexible Electrochemical Bioelectronics: The Rise of In Situ Bioanalysis. Advanced Materials 32(15), 1902083. [DOI] [PubMed] [Google Scholar]
- Zahed MA, Barman SC, Das PS, Sharifuzzaman M, Yoon HS, Yoon SH, Park JY, 2020. Highly flexible and conductive poly (3, 4-ethylene dioxythiophene)-poly (styrene sulfonate) anchored 3-dimensional porous graphene network-based electrochemical biosensor for glucose and pH detection in human perspiration. Biosensors and Bioelectronics 160, 112220. [DOI] [PubMed] [Google Scholar]
- Zhang H, Yu Y, Shen X, Hu X, 2020a. A Cu2O/Cu/carbon cloth as a binder-free electrode for non-enzymatic glucose sensors with high performance. New Journal of Chemistry 44(5), 1993–2000. [Google Scholar]
- Zhang L, Ye C, Li X, Ding Y, Liang H, Zhao G, Wang Y, 2017. A CuNi/C Nanosheet Array Based on a Metal–Organic Framework Derivate as a Supersensitive Non-Enzymatic Glucose Sensor. Nano-Micro Letters 10(2), 28. [DOI] [PMC free article] [PubMed] [Google Scholar]
- Zhang Y, Chen Y, Huang J, Liu Y, Peng J, Chen S, Song K, Ouyang X, Cheng H, Wang X, 2020b. Skin-interfaced microfluidic devices with one-opening chambers and hydrophobic valves for sweat collection and analysis. Lab on a Chip 20(15), 2635–2645. [DOI] [PubMed] [Google Scholar]
- Zhang Y, Li N, Xiang Y, Wang D, Zhang P, Wang Y, Lu S, Xu R, Zhao J, 2020c. A flexible non-enzymatic glucose sensor based on copper nanoparticles anchored on laser-induced graphene. Carbon 156, 506–513. [Google Scholar]
- Zhong S-L, Zhuang J, Yang D-P, Tang D, 2017. Eggshell membrane-templated synthesis of 3D hierarchical porous Au networks for electrochemical nonenzymatic glucose sensor. Biosensors and Bioelectronics 96, 26–32. [DOI] [PubMed] [Google Scholar]
- Zhou J, Yin H, Chen J, Gong J, Wang L, Zheng Y, Nie Q, 2020. Electrodeposition of bimetallic NiAu alloy dendrites on carbon papers as highly sensitive disposable non-enzymatic glucose sensors. Materials Letters 273, 127912. [Google Scholar]
- Zhu B, Yu L, Beikzadeh S, Zhang S, Zhang P, Wang L, Travas-Sejdic J, 2021. Disposable and portable gold nanoparticles modified - laser-scribed graphene sensing strips for electrochemical, non-enzymatic detection of glucose. Electrochimica Acta 378, 138132. [Google Scholar]
- Zhu H, Li L, Zhou W, Shao Z, Chen X, 2016. Advances in non-enzymatic glucose sensors based on metal oxides. Journal of Materials Chemistry B 4(46), 7333–7349. [DOI] [PubMed] [Google Scholar]
- Zhu X, Ju Y, Chen J, Liu D, Liu H, 2018. Nonenzymatic Wearable Sensor for Electrochemical Analysis of Perspiration Glucose. ACS Sensors 3(6), 1135–1141. [DOI] [PubMed] [Google Scholar]
- Zhu X, Yuan S, Ju Y, Yang J, Zhao C, Liu H, 2019. Water Splitting-Assisted Electrocatalytic Oxidation of Glucose with a Metal–Organic Framework for Wearable Nonenzymatic Perspiration Sensing. Analytical Chemistry 91(16), 10764–10771. [DOI] [PubMed] [Google Scholar]
Associated Data
This section collects any data citations, data availability statements, or supplementary materials included in this article.