

Abstract
Objective:
We evaluated brain glucose metabolism in people living with HIV (PLWH) with [18F]-Fluoro-Deoxyglucose (FDG) PET/CT before and after antiretroviral therapy (ART) initiation.
Design:
We conducted a longitudinal study where ART-naïve late-presenting untreated PLWH with CD4 counts <100 cells/uL were prospectively assessed for FDG uptake at baseline and at 4-8 weeks (n=22) and 19-26 months (n=11) following ART initiation.
Methods:
Relative uptake in the subcortical regions (caudate, putamen and thalamus) and cortical regions (frontal, parietal, temporal, and occipital cortices) were compared across time and correlated with biomarkers of disease activity and inflammation, in addition to being compared to a group of uninfected individuals (n=10).
Results:
Before treatment initiation, putaminal and caudate relative FDG uptake values in PLWH were significantly higher than in uninfected controls. Relative putaminal and thalamic uptake significantly decreased shortly following ART initiation, while frontal cortex values significantly increased. FDG uptake changes correlated with changes in CD4 counts and VL, and, in the thalamus, with IL-6R and sCD14. Approximately two years following ART initiation, there was further decrease in subcortical relative uptake values, reaching levels below those of uninfected controls.
Conclusions:
Our findings support pre-treatment basal ganglia and thalamic neuroinflammatory changes in PLWH, which decrease after treatment with eventual unmasking of long-term irreversible neuronal damage. Meanwhile, increased frontal cortex metabolism following ART initiation suggests reversible cortical dysfunction which improves with virologic control and increased CD4 counts. Early initiation of treatment after HIV diagnosis and secondary control of inflammation are thus necessary to halt neurological damage in PLWH.
Keywords: HIV, Brain PET imaging, Inflammation, Brain metabolism
INTRODUCTION
The introduction of combination antiretroviral therapy (cART) has greatly reduced the morbidity and mortality associated with human immunodeficiency virus (HIV) infection [1, 2]. Despite these advances, rates of HIV-associated neurocognitive impairment remain high, with asymptomatic and mild neurocognitive impairment still reported to occur in around 30-50% of patients [3–6]. HIV enters the central nervous system (CNS) early in the course of infection [7] via infected monocytes and lymphocytes [3, 8–10]. Once in the brain, HIV infection of macrophages, microglial cells and astrocytes leads to chronic inflammation, which is believed to be the primary source of neuronal damage in untreated people living with HIV (PLWH) [3, 11]. The pathophysiology of CNS disease in PLWH after treatment, however, remains less well understood.
While multiple studies have investigated neurocognition [1, 2] and brain volumetric changes in treated PLWH [12, 13], few studies have focused on the acute and chronic effects of ART initiation from a metabolic perspective. Whether an inflammatory component of the infection is acutely detectable in the brains of infected patients, and how this inflammation is modified by effective ART, remains unclear. In this study, we aimed to better understand brain metabolic changes in a group of late-presenting ART-naïve PLWH patients with low CD4 counts [14], as it relates to ART initiation and maintenance. To assess glucose metabolism in the cortical and subcortical regions of the brain as a reflection of neuroinflammation and neuronal function, participants underwent 18F-Fluorodeoxyglucose (FDG) PET/CT scans before and once (n=22) or twice (n=11) after initiation of ART (short and long-term follow-up). FDG uptake values from the baseline and long-term treated PLWH scans were also compared to values obtained from a group of uninfected HIV-negative (HIV−) controls. Finally, we looked for associations between FDG uptake in PLWH and biomarkers of disease activity and immune activation in the periphery, in an attempt to correlate changes in metabolic activity with overall disease progression.
MATERIALS AND METHODS
Study design
PLWH and HIV− controls were recruited and scanned under protocols 14-I-0124 (PET Imaging and Lymph Node Assessment of IRIS in Persons With AIDS, PANDORA, NCT02147405) and 13-N-0149 (Screening and Recruitment for HIV-associated Neurocognitive Disorders Studies and an Evaluation of HIV-associated Neurocognitive Disorders in Virologically Controlled Patients, NCT01875588) respectively. Both studies were reviewed and approved by the National Institute of Allergy and Infectious Diseases Institutional Review Board and by the NIH Radiation Safety Committee in keeping with the Declaration of Helsinki of the World Medical Association. All participants signed informed consent before study procedures began.
This was a prospective observational study of 22 PLWH. PLWH participants had CD4 T-cell counts of <100 cells/µL at baseline, were naïve to ART, and were willing to start therapy. ART was initiated according to standard treatment guidelines in all PLWH, as part of enrollment in the NCT02147405 protocol, usually within 2 weeks after study enrollment. The choice of ART was based on each participant’s genotype, comorbidities and possible drug interactions. Changes in ART during the disease course were dictated by response criteria and side effects. Only PLWH with no evidence of active CNS opportunistic infection or CNS immune reconstitution inflammatory syndrome (IRIS) were included in this sub-study [15]. Ten seronegative controls were selected from the neurocognitive disorders study (NCT01875588), which recruited uninfected controls from the DC metro area to match age, gender and social history of the enrolled PLWH [16].
FDG-PET/CT imaging
FDG PET/CT scans for the 22 PLWH participants were performed prior to ART initiation and 4-8 weeks after ART initiation (short-term ART) using a clinical PET/CT scanner (Biograph PET/CT; Siemens Medical Solutions, Malvern, PA). A subset of 11 PLWH participants received an additional FDG PET/CT scan 19-26 months following ART initiation (long-term ART). All participants consented to undergoing FDG PET/CT for research purposes.
Approximately 58 minutes following the injection of 10 mCi of 18F-FDG, each PLWH was positioned on the scanner table and a low-dose CT scan was performed from the top to the base of the skull for attenuation correction and anatomical localization under protocol 14-I-0124, NCT02147405. Emission scans were then obtained in 3-dimensional mode for a duration of 10-15 minutes. Images were reconstructed with an iterative technique featuring an ordered subset expectation-maximization algorithm and attenuation and scatter corrected with a CT-based correction. The 10 controls were imaged on the same PET/CT scanner with the same acquisition and reconstruction techniques following the administration of 5 mCi of 18F-FDG (scanned under protocol 13-N-0149, NCT01875588). The differences in doses is due to the different objectives of the two studies, which included whole body scanning (including the brain) for NCT02147405 compared to only brain imaging in NCT01875588.
Quantification analysis of subcortical and cortical FDG uptake
FDG uptake (whole-brain and brain region specific) was assessed using the Neuro Tool in PMOD version 4.002 (PMOD Technologies LC, Zurich, Switzerland).
Standardized uptake values (SUVs) for the basal ganglia (caudate and putamen), thalamus and whole brain were generated through application of automatic template volumes of interest (VOIs) to each PET scan. The subcortical VOIs were manually adjusted as needed. The right and left VOIs of each structure (caudate, putamen and thalamus) were merged and SUVmean values were obtained for the merged VOI. Regional VOIs for the frontal, parietal, temporal and occipital cortical regions were similarly generated using the Neuro Tool in PMOD. The left and right cortical subregions were fused together and SUVmean values were then calculated. We evaluated all the regions by averaging the right and left hemispheres in order to decrease the probability of type 1 statistical errors due to multiple comparisons.
Partial volume correction (PVC) calculations were applied to each of the VOIs from the three subcortical structures and four cortical regions using VOI-based algorithms [17, 18]. Relative uptake was then calculated as a ratio of each structure’s regional uptake to the whole brain uptake. We used relative SUV values as those have been proven to be more stable quantitative indices of cerebral glucose metabolism than absolute SUV values [19], and because control participants had received a lower FDG dose.
Peripheral disease markers
CD4 counts and plasma viral load values were measured at each imaging time point for all 22 PLWH participants. For 15 of the 22 PLWH, cryopreserved plasma was obtained within one week of the baseline, short-term and long-term follow-up FDG-PET scans. Samples were analyzed by Enzyme Linked Fluorescent Assay on a VIDAS instrument for D-dimer (bioMerieux Inc., Durham, NC) and by ELISA kits (R&D Systems, Minneapolis, MN and MyBiosource.com, San Diego, CA) for sCD14. Plasma levels of IFN-γ (lower limit of detection (LLD) = 0.40 pg/ml), TNF-α (LLD = 0.09 pg/ml), MPO (LLD = 0.07 ng/ml), MCP-1 (LLD = 0.11 pg/ml), sPD1 (LLD = 0.00 pg/ml), sCD14 (LLD = 2.5 E-7 mg/L), IL-2 (LLD = 0.38 pg/ml), IL-6 (LLD = 0.18 pg/ml), IL-8 (LLD = 0.16 pg/ml), IL-10 (LLD = 0.09 pg/ml), IL-6R (LLD=0.49 pg/ml) and G-CSF (LLD=0.24 pg/ml) were measured using a custom multiplex kit and 3 single-plex kits by electrochemiluminescence (Meso Scale Discovery, Gaithersburg, MD). Results from IL-1b and IL-12p70 were at or below LLD and were excluded.
Statistical methods
Shapiro-Wilk normality tests were applied to all data sets before statistical analyses were conducted between groups. Due to non-normal distributions in a few data sets, non-parametric tests were used for all analyses to maintain consistency. Non-parametric tests are typically more conservative than parametric tests and would not be expected to increase type I error. Values deemed to be outliers using the Grubb’s method were excluded.
Comparisons for relative FDG uptake changes in the short term (baseline and short-term ART; n=22) were assessed for both the cortical (composite of all regions of cortex) and subcortical (caudate, putamen and thalamus) regions. Comparisons of the two groups were performed using Wilcoxon tests (matched-pairs signed rank tests). The statistical significance criteria for these comparisons was set to p < 0.05.
Changes in FDG uptake across the long-term scans (baseline, short-term ART, and long-term ART; n=11) were assessed for the cortical and subcortical regions using Friedman tests (non-parametric repeated-measures one-way ANOVA). Following non-parametric ANOVA analysis, Dunn’s multiple comparison tests for differences between each of the three time points were further conducted, if warranted. The statistical significance criteria for these comparisons was set to p < 0.05.
Relative FDG uptake values of PLWH’s brain regions from the baseline (n=22) and long-term ART time points (n=11) were separately compared to corresponding cortical and subcortical measurements from control participants (n=10) using Mann-Whitney tests (non-parametric unpaired t-tests). The criteria for statistical significance for these analyses were set to p < 0.05.
Within individual PLWH participants, CD4 counts and plasma viral load (VL) values were correlated with relative FDG uptake values at different time points using repeated measures correlations [20] for both the short-term (n=22) and long-term ART (n=11) time points. Additional markers of immune activation and inflammation that were available were correlated with subcortical and cortical uptake values between baseline and short-term ART follow-up (n=15). At the long-term ART time point, correlations with soluble biomarkers were not performed since a complete data set of biomarkers was only available for 7 patients. Correlations were performed using the rmcorr program in R (version 3.5.1), with statistical significance set to p < 0.01 due to multiple correlations.
Data Availability Statement:
Anonymized data not published within this article will be made available by request from any qualified investigator.
RESULTS
Clinical characteristics of study participants
Twenty-two ART-naïve, PLWH participants (6 female and 16 male; median age, 36.6 years [interquartile range (IQR), 32.2-39.9]), were recruited from the greater Washington, D.C. area and their HIV clinical care was provided through protocol participation at the National Institutes of Health, Clinical Center (Supplemental Table S1). Participants had nadir CD4 counts ranging from 0 to 84 (median count, 26.0 [IQR, 10-41.3]). Ten uninfected control participants (median age, 53.7 [IQR, 50.1-56.5]) were included in the study.
Six of the 22 PLWH were eventually diagnosed with non-CNS IRIS based on AIDS Clinical Trial Group criteria (https://actgnet-work.org/IRIS_case_definitions). IRIS developed within 1 to 12 weeks of starting ART (median weeks, 3 [IQR, 2-8]). Among those, four participants were already diagnosed with IRIS when they underwent their short-term F/U scans while two had not been diagnosed with IRIS yet. Three subjects were on corticosteroids at the time of the first scan while the other three had stopped the corticosteroids prior to the PET scan. None of the participants had evidence of opportunistic CNS infection. In one (#6), there was history of shingles prior to presentation and the CSF was positive for varicella zoster virus (VZV) by PCR. This was, however, considered not to be indicative of opportunistic CNS infection as both the CSF profile (WBC: 3 leukocytes/mm3, protein: 34 mg/dL, glucose: 70 mg/dL) and the enhanced brain MRI and MRA were normal. All participants experienced increases in CD4 cell counts and decreases in plasma HIV viremia by the time the second FDG-PET was performed. All 11 PLWH participants with a long-term follow-up scan were virally suppressed with VL < 40 copies at the third time point. A table showing the clinical characteristics of all PLWH participants is included (Table S1).
There were significant increases in CD4 cell counts and decreases in plasma VL across all time points for the PLWH patients. Baseline values were significantly different in the 22 participants compared to their short-term ART follow-up (p < 0.0001 for CD4 count and p < 0.0001 for VL) (Fig. S1-A). CD4 cell counts in the long-term group (n=11) significantly increased between baseline and long-term post-ART (p < 0.0001); their plasma VL levels first decreased significantly in the short term (p = 0.012) and decreased further in the long term (p < 0.0001). All VL values dropped below the level of detection by the last time point (Fig. S1-B).
Whole-brain FDG uptake
There were no significant differences in whole brain SUVmean values across all three time points (long-term ART; n=11) or across two time points (short-term ART; n=22).
Subcortical and cortical FDG uptake
In the putamen, relative SUV (rSUV) values decreased significantly at short-term follow-up after ART initiation (Wilcoxon test, p < 0.0001) (Fig. 1A). When the long-term scans were added to the analysis, the significant differences persisted (Friedman test, p = 0.002) (Fig. 1B). Post-hoc analysis showed a significant decrease in the short-term compared to baseline (p = 0.032) as well as in the long-term compared to baseline (p = 0.004), although there were no significant differences between the short and long-term values.
Figure 1:
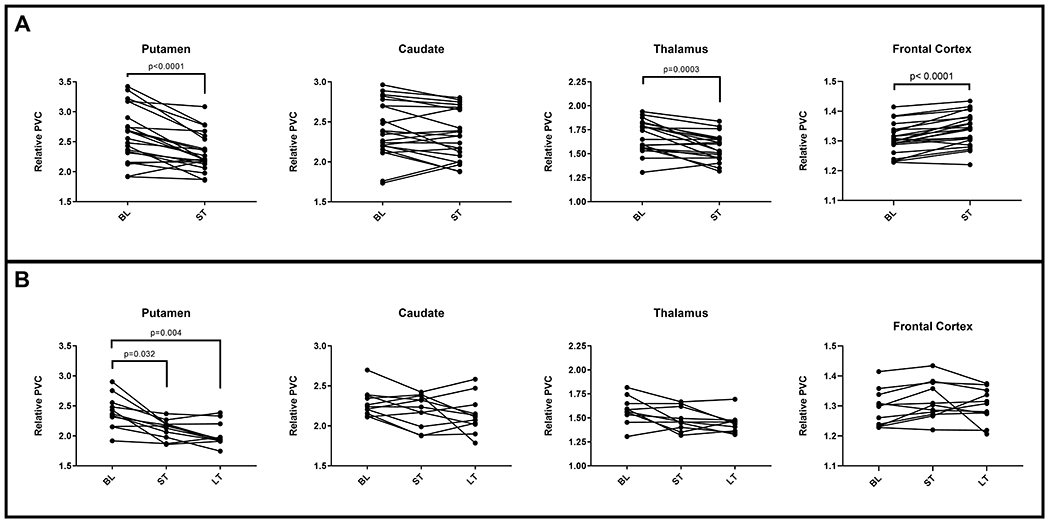
Longitudinal changes in relative SUV in the caudate, putamen, thalamus and frontal cortex between the baseline (BL), short-term follow-up (ST, n=22) (A) and long-term follow-up after ART initiation (LT, n=11) (B). For the thalamic dataset, one subject was excluded as an outlier.
In the caudate, the mean and median of the rSUV values decreased between baseline and both short-term and long-term ART time-points. These differences, however, were not statistically significant (Fig. 1A, 1B).
In the thalamus, one participant’s values had to be excluded (outlier as determined by Grubb’s method). Only short-term comparisons were significant with decreased rSUV values (p = 0.0003) compared to baseline (Fig. 1A). There were no significant differences when all three time-points were analyzed together (Fig. 1B).
For the cortical VOIs (n=22), the frontal cortex rSUV significantly increased from baseline to short-term post-ART (Wilcoxon test, p < 0.0001) (Fig. 1A). There were no significant differences in rSUV for any of the other evaluated cortical regions. When long-term scans were included (n=11), there were no significant differences in uptake across the three time points in any cortical region, including the frontal cortex (Fig. 1B).
In patients who developed systemic IRIS, the median values for rSUV were higher in the subcortical regions and in the frontal cortex compared to those who did not develop IRIS, more so at baseline than at later time points. The differences between IRIS and non-IRIS subjects however did not reach statistical significance in any of the regions, at any of the time points (Mann-Whitney, p > 0.05) (Fig. S2).
Each of the regions had a few patients that showed an increase in rSUV between the pre-ART and one or both ART time-points. They were mostly non-IRIS patients and a review of their ARV regimens revealed no obvious differences when compared to patients with decreased rSUV values.
When the patients were separated by sex, there were also no statistically significant differences in rSUV values between males and females in any region at any time point (Fig. S3).
FDG uptake in PLWH before ART and following long-term ART in comparison to controls
At baseline, ART-naïve PLWH participants showed significantly higher rSUV values in the putamen when compared to uninfected controls (p = 0.005). Relative FDG uptake values in the caudate were also higher in PLWH participants, but with only borderline significance (p = 0.025). In the thalamus the differences did not reach statistical significance. Cortical rSUV values in PLWH were also not significantly different from uptake values in controls (Fig. 2A).
Figure 2:
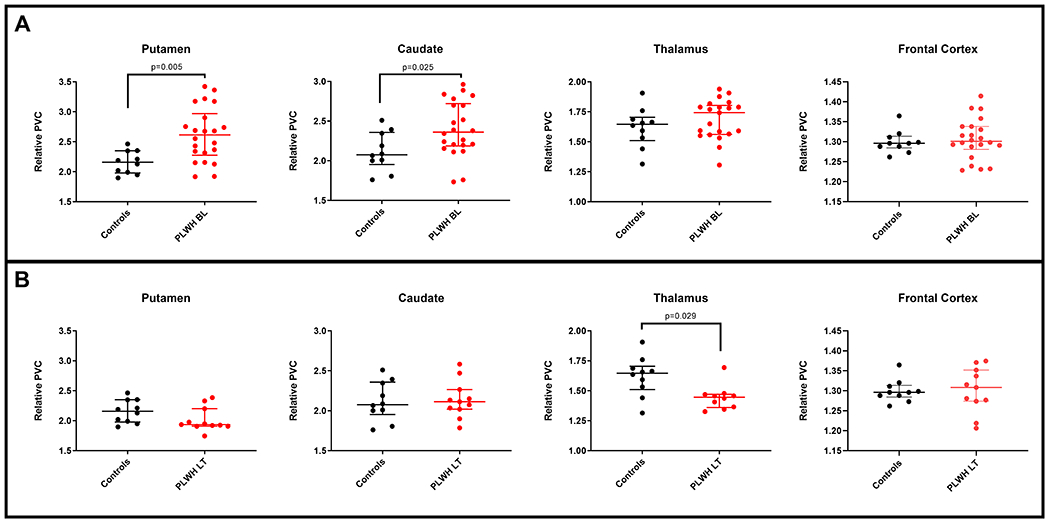
A. Differences in relative SUV in the putamen, caudate, thalamus and frontal cortex between ART-naïve PLWH at baseline (BL< n=22) and uninfected controls (n=10). B. Differences in relative SUV in the caudate, putamen, thalamus and frontal cortex between PLWH on continuous long-term ART for approximately two years (LT, n=11) and uninfected controls (n=10). For the thalamic dataset, one subject was excluded as an outlier.
However, when comparing the long-term rSUV values to control values (n = 11), a reversed pattern was observed with significantly lower relative uptake in the thalamus (p = 0.029). The other regions were not significantly different in rSUV between PLWH and controls (Fig. 2B).
Correlations of regional uptake with peripheral viremia and CD4 counts
Repeated measures correlations from the first two time points (baseline and short-term ART; n=22) showed a significant negative association between rSUV values of the putamen and CD4 counts (p = 0.0003, r = −0.69) and a significant positive association with VL (p = 0.0005, r = 0.67) (Fig. 3A). No significant correlations were found for the caudate rSUV with CD4 counts or VL (Fig. 3B). Similar to the putamen results, the thalamic rSUV values showed a significant negative correlation with CD4 counts (p = 0.0001, r = −0.72) and a significant positive correlation with VL (p = 0.007, r = 0.55) (Fig. 3C). Frontal and temporal cortical rSUV values had significant positive correlations with CD4 counts (p = 0.009, r = 0.54 and p = 0.007, r = 0.55 respectively), while frontal lobe rSUV values had a significantly negative correlation with viral load (p = 0.002, r = −0.62) (Fig. 3D). Cortical associations were opposite in direction to subcortical regional correlations.
Figure 3:
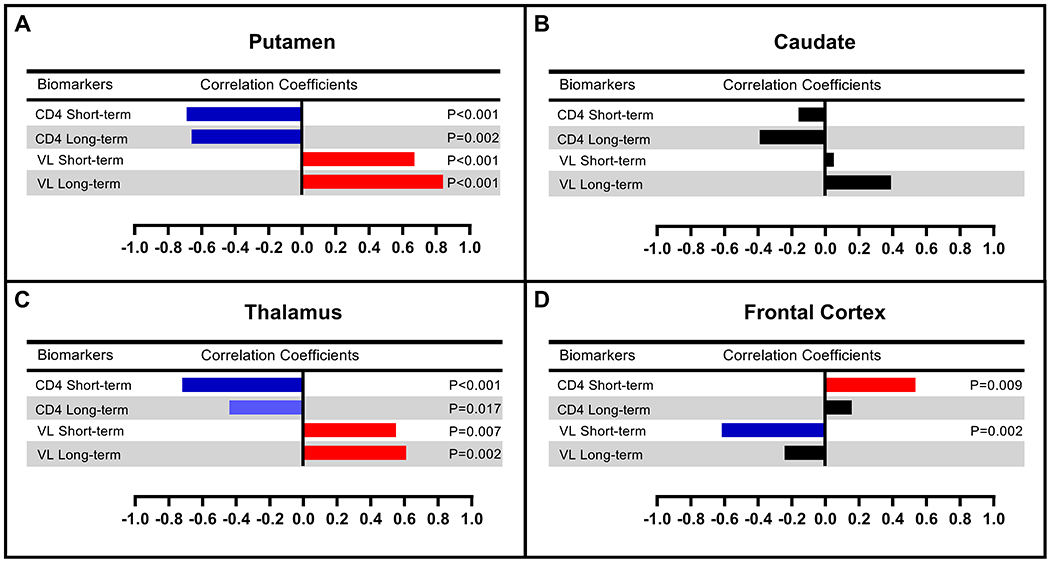
Repeated measures correlations between regional relative SUV values and CD4 counts/plasma viral loads in the short-term (ST, n=22) and long-term (LT, n=11) follow-up after ART initiation.
In the long-term ART group (n=11), putaminal rSUV values remained positively associated with VL (p < 0.0001, r = 0.84) and negatively associated with CD4 (p = 0.0006, r = −0.66) (Fig. 3A). Thalamic rSUV remained positively associated with VL (p = 0.002, r = 0.61) with a negative trend association with CD4 counts (p = 0.035, r = −0.44) (Fig. 3C). The caudate and frontal cortex showed no significant correlations with either CD4 or VL.
Correlations of regional uptake with inflammatory biomarkers
In the longitudinal analyses, repeated measures correlations from the baseline and short-term follow-up revealed that relative uptake in the putamen and caudate showed a trend for positive correlations with various biomarkers (e.g. sIL-6R, sCD14, and D-dimer) (Fig. 4A, 4B). On the other hand, rSUV values in the thalamus significantly positively correlated with sIL-6R (p = 0.0096, r = 0.63) and sCD14 (p = 0.007, r = 0.64) (Fig. 4C). The frontal cortex was the only region showing a negative correlation with sCD14 (p = 0.004, r = −0.68), and a trend for significant correlations with sIL-6R (p = 0.031, r = −0.54) suggesting that uptake values increased as sCD14 and sIL-6R values in the periphery decreased (Fig. 4D).
Figure 4:
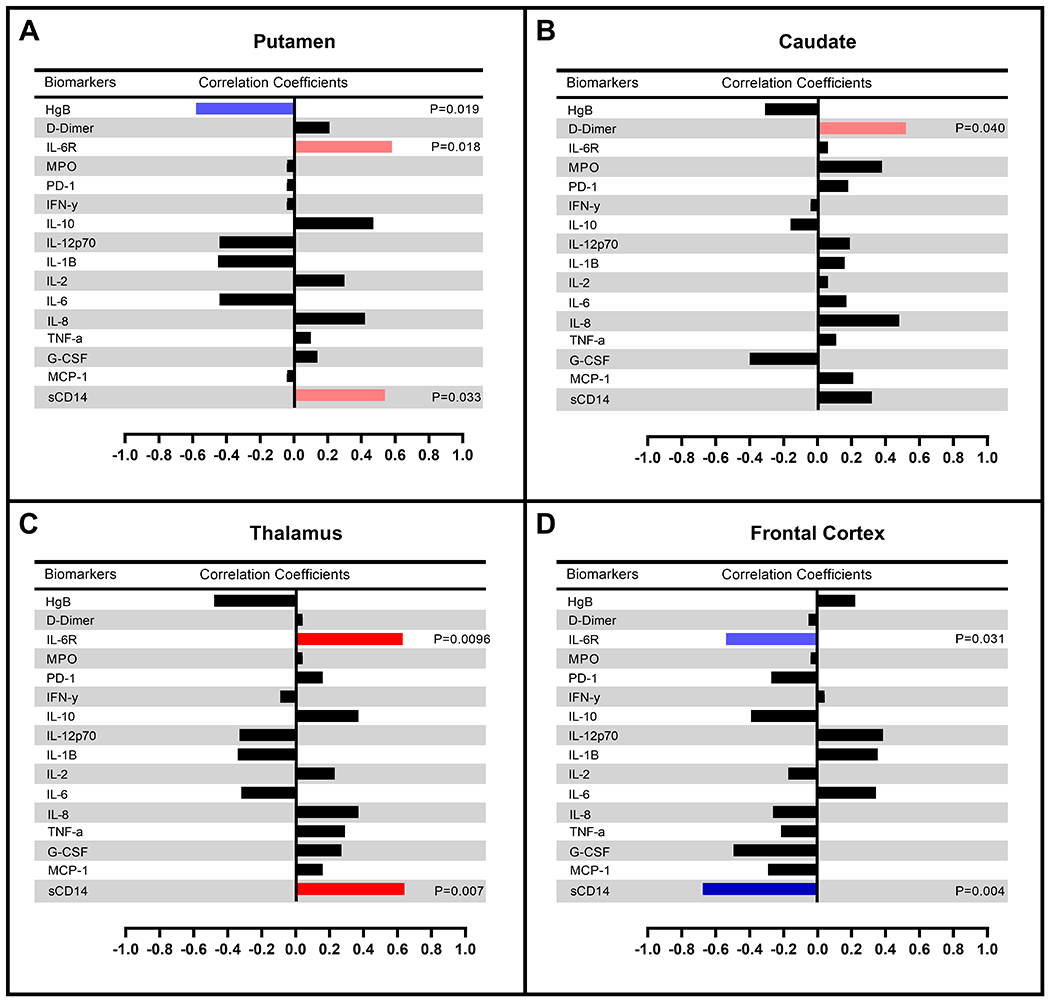
Repeated measures correlations between relative SUV values and inflammatory markers in the short-term (ST, n=15) follow-up after ART initiation.
DISCUSSION
The exact pathophysiology of brain involvement with HIV infection in the acute and chronic stages remains unclear. In this study, using a longitudinal assessment of glucose metabolism in the brains of ART-naïve PLWH who were late-presenters, we were able to delineate the temporal progression of cortical and subcortical glucose metabolism changes associated with treatment. At baseline, basal ganglia and thalamic hypermetabolism in PLWH compared to uninfected controls dominated the picture, especially in the putamen. Those changes, however, reversed promptly after initiation of ART, with decreased relative uptake, suggesting a baseline subcortical inflammatory process in association with HIV infection [3, 21, 22] that quickly decreases with peripheral control of the infection (Fig. 1, 5). This was further supported with relative uptake values in the putamen and thalamus showing significant negative correlations with CD4 counts and significant positive correlations with plasma VL values. This reduction of neuroinflammation also occurred in concert with decreasing inflammatory markers, leading to thalamic relative glucose metabolism correlating positively with sIL-6R and, more importantly, sCD14. The latter is a monocyte activation marker [23–25] known to persist even in early treated PLWH [26] and to independently predict mortality in PLWH [27]. In fact, a relationship between elevated sCD14 and brain HIV involvement has been previously proposed with higher levels being associated with worse cognitive performance [28–31].
Figure 5:
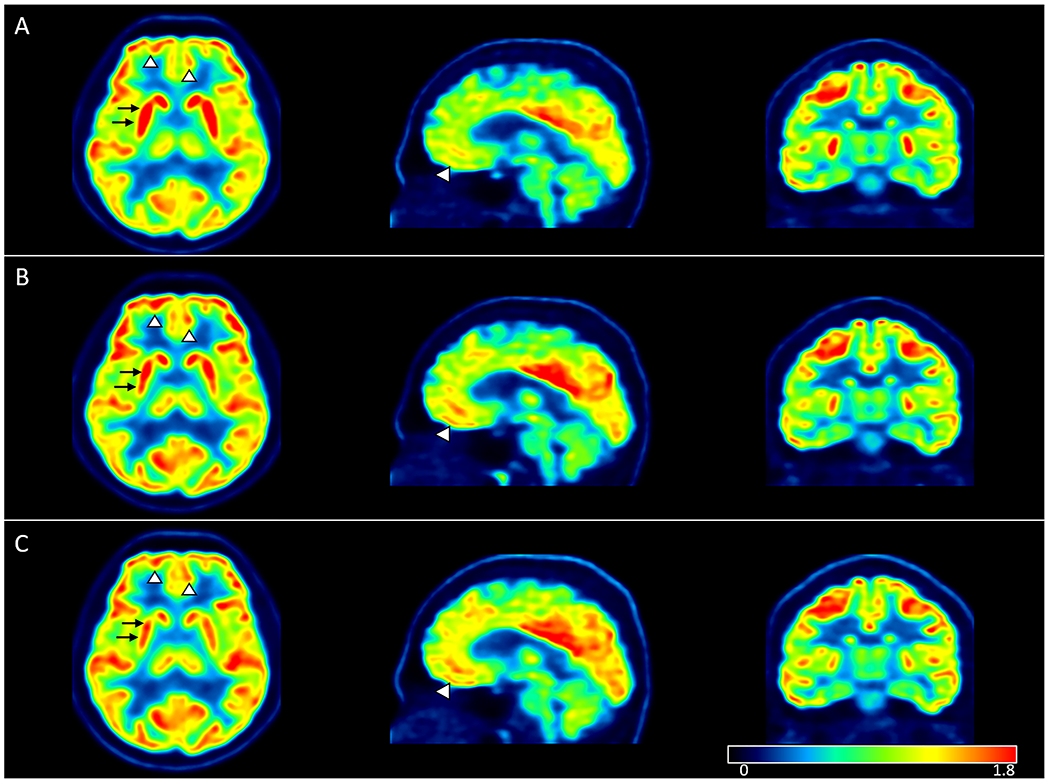
Relative SUV parametric maps in one participant at (A) baseline, (B) short-term follow-up and (C) long-term follow-up. Axial, sagittal and coronal maps showing visually detectable decreasing putaminal (black arrows) and increasing cortical uptake (arrowheads) after initiation of ART.
Meanwhile, relative uptake in the frontal cortex increased following ART initiation (Fig. 5). The literature on FDG uptake in the cortical regions of PLWH is scarce. MR imaging studies have provided insight into cortical involvement, with cortical thinning seen in the pre-ART stages of infection being halted following ART initiation [32]. Our FDG uptake findings in the frontal cortex at baseline could reflect neuronal injury and/or stunting in the setting of active viral replication. Increased relative uptake values after ART, however, suggests a reversible process with apparent rescuing of cortical activity, occurring in concert with increasing CD4 counts and decreasing viral load and sCD14 levels. As such, our findings suggest a better functional outcome in the frontal cortex following ART initiation than what has been established by structural imaging.
We also evaluated a subset of patients who were imaged after approximately two years of uninterrupted ART and found evidence for differential long-term injury in various brain regions: subcortical hypometabolism further progressed in the basal ganglia and thalamus, suggesting an element of irreversible injury and neuronal loss [13, 33–35], while cortical metabolism did not change appreciably. With the limitations of a small sample number, our findings could reflect higher susceptibility of the thalamus and subcortical regions to the effects of the virus compared to the more resilient cortical structures. These findings are in concordance with multiple prior MR volumetric studies repeatedly demonstrating volume loss in subcortical structures [12, 13, 18]. In one of those studies, striatal volume loss was noted despite immediate initiation of ART in the acute stage of infection [18]. The exact reason for relative sparing of cortical neurons from permanent damage compared to subcortical neurons is unclear. Neuronal damage in the pre-treatment stage, however, is likely due to a combination of viral protein toxicity, loss of astrocytic support, and neuroinflammatory changes with cytokine/chemokine release. A predilection for viral replication in the subcortical regions compared to cortical regions could thus exacerbate those effects and lead to subcortical/cortical dissociation as far as neurological damage. This predilection has been shown in brain autopsies of HIV infected patients, with HIV-associated brain lesions identified mainly in the putamen and thalamus [36], as well as a higher concentration of HIV p24 positive cells in the basal ganglia [37]. We have also previously shown subcortical dopaminergic loss (both pre-synaptic and post-synaptic) in an animal model of HIV infection [38–41], which was associated with Gp120 levels and oxidative stress [39]. The exact underlying causes for subcortical predilection of damage in HIV are unclear. Prior studies of SIV-infected animals have demonstrated an association between increased dopamine levels and CNS vacuolization, SIV encephalitic lesions, and enhanced CNS viral replication during early infection [42, 43]. This could be due to the role of dopamine in increasing the susceptibility of primary human macrophages to HIV entry through stimulation of both D1-like and D2-like receptors [44] via an alternative signaling pathway [45]. The abundance of dopaminergic neurons/projections in the basal ganglia, and to a lesser extent in the thalami and frontal cortex, could therefore possibly explain higher levels of viral replication in these regions compared to other regions.
In the pre-ART era, there were reports of initial hypermetabolism in the striatum in the acute and subacute stages of the infection and hypometabolism in the chronic stage [46–48, 49 ]. The strength of our study, however, is in the longitudinal design and long-term follow-up scan. This allowed us to separate the rapid changes occurring shortly after ART initiation (decreased subcortical and increased cortical metabolism) from long-term changes (further subcortical hypometabolism probably due to neuronal loss). While the former effect is likely due to decreased neuroinflammation, the latter is more likely to reflect long-term neuronal loss.
Despite the limitations of spatial resolution associated with PET, this modality has the advantage of very high sensitivity compared to MRI as well as the ability to surpass structural abnormalities and detect subtle functional and molecular changes. Although FDG PET is widely available as a clinical tool, the associated radiation limits its applicability in evaluating individual patients. The information obtained from group analysis, however, such as in our study, can shed light on the pathophysiology of disease involvement, beyond what can be derived from structural imaging modalities and neurocognitive testing alone.
A limitation of our study is the small sample size of our long-term cohort. A larger sample size could have resulted in better appreciation of subtle changes in metabolism in various regions and could have allowed us to better assess the contribution of various factors such as HIV clade, substance use and co-morbidities to the end result of neuronal dysfunction/loss. Another limitation is a significantly older control group. This, however, further supports our results of abnormally decreased metabolism in PLWH since one would expect an older population to have shown lower glucose metabolism values [50]. Additional limitations include the lack of CSF measurements, including inflammatory or neuronal injury biomarkers, the lack of plasma ART levels and the partial availability of plasma biomarkers. Since all PLWH participants achieved appropriate plasma virologic suppression, however, we do not believe variability in drug levels would have played a major role in their FDG findings. There was a difference in injected FDG dose between PLWH and controls since the two groups were scanned under different protocols. However, this should not affect our results since we used SUV values (which account for the injected dose and body weight) and because we relied on comparisons between relative SUV values (which normalize regional uptake to whole brain uptake) rather than absolute SUV values. Finally, our PLWH population consisted of late-presenters with low nadir CD4 (<100 cells/uL at baseline). This could have magnified the neuroinflammatory and eventual neurodegenerative changes compared to PLWH with higher CD4 counts upon presentation, which would be consistent with previous observations showing low CD4 nadir as a predictor of HIV neurocognitive impairment [51]. Late-presenters, however, still constitute a large proportion of PLWH starting therapy, especially in resource-limited settings. Our advanced imaging techniques are not readily available in such settings due to infrastructure, expertise and financial constraints. As a result, we believe the information we are gleaning regarding the neuropathophysiology of the infection in this study using FDG PET imaging will eventually inform and improve the management of late-presenters in countries with limited resources, especially as it relates to CNS manifestations in those patients.
In summary, our findings suggest that there is differential regional susceptibility of the brain to HIV infection with maximal effects in the basal ganglia, particularly the putamen, and the thalamus. ART has a significant role in tempering neuroinflammatory changes in the brain in concert with the abatement of systemic viral replication and inflammation. Long-term subcortical decreases in glucose metabolism, on the other hand, are likely the result of irreversible neuronal damage associated with pretreatment neuroinflammatory changes, although other factors, including ART toxicity [52, 53] and cardiovascular disease [16], cannot be ruled out. Our findings support the importance of early initiation of treatment and controlling viral replication/neuroinflammation in minimizing neurological damage, and suggest that FDG PET may be a sensitive technique for monitoring the effects of ART in this population.
Supplementary Material
Figure. 1S: Longitudinal changes in CD4 counts and plasma viral loads (VL) in the short-term (ST, n=22) and long-term (LT, n=11) follow-up after ART initiation.
Figure. 2S: Trajectories of change in subcortical and cortical relative SUV values in PLWH participants who developed non-CNS IRIS versus those who did not develop IRIS.
Figure. 3S: Trajectories of change in subcortical and cortical relative SUV values in male and female PLWH participants.
Table 1S: Demographic and clinical data of all PLWH participants.
Study funding:
This work was supported entirely by the Intramural Research Programs of the Clinical Center (CC), National Institute of Neurological Diseases and Stroke (NINDS), and National Institute for Allergy and Infectious Diseases (NIAID), National Institutes of Health (NIH), Bethesda, Maryland, USA.
Footnotes
Disclosures:
Zeping Wang reports no disclosures.
Maura M. Manion reports no disclosures.
Elizabeth Laidlaw reports no disclosures.
Adam Rupert reports no disclosures.
Chuen-Yen Lau reports no disclosures.
Bryan R. Smith reports no disclosures.
Avindra Nath reports no disclosures.
Irini Sereti reports no disclosures.
Dima A. Hammoud reports no disclosures.
Conflicts of interest
There are no conflicts of interest.
References:
- 1.Heaton RK, Clifford DB, Franklin DR Jr., Woods SP, Ake C, Vaida F, et al. HIV-associated neurocognitive disorders persist in the era of potent antiretroviral therapy: CHARTER Study. Neurology 2010; 75(23):2087–2096. [DOI] [PMC free article] [PubMed] [Google Scholar]
- 2.Heaton RK, Franklin DR, Ellis RJ, McCutchan JA, Letendre SL, Leblanc S, et al. HIV-associated neurocognitive disorders before and during the era of combination antiretroviral therapy: differences in rates, nature, and predictors. J Neurovirol 2011; 17(1):3–16. [DOI] [PMC free article] [PubMed] [Google Scholar]
- 3.Schouten J, Cinque P, Gisslen M, Reiss P, Portegies P. HIV-1 infection and cognitive impairment in the cART era: a review. Aids 2011; 25(5):561–575. [DOI] [PubMed] [Google Scholar]
- 4.Sheppard DP, Iudicello JE, Morgan EE, Kamat R, Clark LR, Avci G, et al. Accelerated and accentuated neurocognitive aging in HIV infection. J Neurovirol 2017; 23(3):492–500. [DOI] [PMC free article] [PubMed] [Google Scholar]
- 5.Saloner R, Campbell LM, Serrano V, Montoya JL, Pasipanodya E, Paolillo EW, et al. Neurocognitive SuperAging in Older Adults Living With HIV: Demographic, Neuromedical and Everyday Functioning Correlates. J Int Neuropsychol Soc 2019; 25(5):507–519. [DOI] [PMC free article] [PubMed] [Google Scholar]
- 6.Portilla I, Reus S, León R, van-der Hofstadt C, Sánchez J, López N, et al. Neurocognitive Impairment in Well-Controlled HIV-Infected Patients: A Cross-Sectional Study. AIDS Res Hum Retroviruses 2019; 35(7):634–641. [DOI] [PubMed] [Google Scholar]
- 7.Thurnher MM, Donovan Post MJ. Neuroimaging in the brain in HIV-1-infected patients. Neuroimaging Clin N Am 2008; 18(1):93–117; viii. [DOI] [PubMed] [Google Scholar]
- 8.Ho EL, Ronquillo R, Altmeppen H, Spudich SS, Price RW, Sinclair E. Cellular Composition of Cerebrospinal Fluid in HIV-1 Infected and Uninfected Subjects. PLoS One 2013; 8(6):e66188. [DOI] [PMC free article] [PubMed] [Google Scholar]
- 9.Zayyad Z, Spudich S. Neuropathogenesis of HIV: from initial neuroinvasion to HIV-associated neurocognitive disorder (HAND). Curr HIV/AIDS Rep 2015; 12(1):16–24. [DOI] [PMC free article] [PubMed] [Google Scholar]
- 10.Subra C, Trautmann L. Role of T Lymphocytes in HIV Neuropathogenesis. Curr HIV/AIDS Rep 2019; 16(3):236–243. [DOI] [PMC free article] [PubMed] [Google Scholar]
- 11.Price RW, Brew B, Sidtis J, Rosenblum M, Scheck AC, Cleary P. The brain in AIDS: central nervous system HIV-1 infection and AIDS dementia complex. Science 1988; 239(4840):586–592. [DOI] [PubMed] [Google Scholar]
- 12.Ances BM, Roc AC, Wang J, Korczykowski M, Okawa J, Stern J, et al. Caudate blood flow and volume are reduced in HIV+ neurocognitively impaired patients. Neurology 2006; 66(6):862–866. [DOI] [PubMed] [Google Scholar]
- 13.Ances BM, Ortega M, Vaida F, Heaps J, Paul R. Independent effects of HIV, aging, and HAART on brain volumetric measures. J Acquir Immune Defic Syndr 2012; 59(5):469–477. [DOI] [PMC free article] [PubMed] [Google Scholar]
- 14.Antinori A, Coenen T, Costagiola D, Dedes N, Ellefson M, Gatell J, et al. Late presentation of HIV infection: a consensus definition. HIV Med 2011; 12(1):61–64. [DOI] [PubMed] [Google Scholar]
- 15.Hammoud DA, Boulougoura A, Papadakis GZ, Wang J, Dodd LE, Rupert A, et al. Increased Metabolic Activity on 18F-Fluorodeoxyglucose Positron Emission Tomography-Computed Tomography in Human Immunodeficiency Virus-Associated Immune Reconstitution Inflammatory Syndrome. Clin Infect Dis 2019; 68(2):229–238. [DOI] [PMC free article] [PubMed] [Google Scholar]
- 16.Hammoud DA, Sinharay S, Steinbach S, Wakim PG, Geannopoulos K, Traino K, et al. Global and regional brain hypometabolism on FDG-PET in treated HIV-infected individuals. Neurology 2018; 91(17):e1591–e1601. [DOI] [PMC free article] [PubMed] [Google Scholar]
- 17.Yang J, Hu C, Guo N, Dutta J, Vaina LM, Johnson KA, et al. Partial volume correction for PET quantification and its impact on brain network in Alzheimer’s disease. Sci Rep 2017; 7(1):13035. [DOI] [PMC free article] [PubMed] [Google Scholar]
- 18.Kallianpur KJ, Jahanshad N, Sailasuta N, Benjapornpong K, Chan P, Pothisri M, et al. Regional brain volumetric changes despite two years of treatment initiated during acute HIV infection. Aids 2019. [DOI] [PMC free article] [PubMed] [Google Scholar]
- 19.Wang GJ, Volkow ND, Wolf AP, Brodie JD, Hitzemann RJ. Intersubject variability of brain glucose metabolic measurements in young normal males. J Nucl Med 1994; 35(9):1457–1466. [PubMed] [Google Scholar]
- 20.Bakdash JZ, Marusich LR. Repeated Measures Correlation. Front Psychol 2017; 8:456. [DOI] [PMC free article] [PubMed] [Google Scholar]
- 21.Gisslen M, Fuchs D, Svennerholm B, Hagberg L. Cerebrospinal fluid viral load, intrathecal immunoactivation, and cerebrospinal fluid monocytic cell count in HIV-1 infection. J Acquir Immune Defic Syndr 1999; 21(4):271–276. [DOI] [PubMed] [Google Scholar]
- 22.Kim WK, Avarez X, Williams K. The role of monocytes and perivascular macrophages in HIV and SIV neuropathogenesis: information from non-human primate models. Neurotox Res 2005; 8(1-2):107–115. [DOI] [PubMed] [Google Scholar]
- 23.Castley A, Berry C, French M, Fernandez S, Krueger R, Nolan D. Elevated plasma soluble CD14 and skewed CD16+ monocyte distribution persist despite normalisation of soluble CD163 and CXCL10 by effective HIV therapy: a changing paradigm for routine HIV laboratory monitoring? PLoS One 2014; 9(12):e115226. [DOI] [PMC free article] [PubMed] [Google Scholar]
- 24.Shive CL, Jiang W, Anthony DD, Lederman MM. Soluble CD14 is a nonspecific marker of monocyte activation. Aids 2015; 29(10):1263–1265. [DOI] [PMC free article] [PubMed] [Google Scholar]
- 25.Williams JC, Zhang X, Karki M, Chi YY, Wallet SM, Rudy BJ, et al. Soluble CD14, CD163, and CD27 biomarkers distinguish ART-suppressed youth living with HIV from healthy controls. J Leukoc Biol 2018; 103(4):671–680. [DOI] [PMC free article] [PubMed] [Google Scholar]
- 26.Sereti I, Krebs SJ, Phanuphak N, Fletcher JL, Slike B, Pinyakorn S, et al. Persistent, Albeit Reduced, Chronic Inflammation in Persons Starting Antiretroviral Therapy in Acute HIV Infection. Clin Infect Dis 2017; 64(2):124–131. [DOI] [PMC free article] [PubMed] [Google Scholar]
- 27.Sandler NG, Wand H, Roque A, Law M, Nason MC, Nixon DE, et al. Plasma levels of soluble CD14 independently predict mortality in HIV infection. The Journal of infectious diseases 2011; 203(6):780–790. [DOI] [PMC free article] [PubMed] [Google Scholar]
- 28.Ryan LA, Zheng J, Brester M, Bohac D, Hahn F, Anderson J, et al. Plasma levels of soluble CD14 and tumor necrosis factor-alpha type II receptor correlate with cognitive dysfunction during human immunodeficiency virus type 1 infection. The Journal of infectious diseases 2001; 184(6):699–706. [DOI] [PubMed] [Google Scholar]
- 29.Imp BM, Rubin LH, Tien PC, Plankey MW, Golub ET, French AL, et al. Monocyte Activation Is Associated With Worse Cognitive Performance in HIV-Infected Women With Virologic Suppression. The Journal of infectious diseases 2017; 215(1):114–121. [DOI] [PMC free article] [PubMed] [Google Scholar]
- 30.Munoz-Nevarez LA, Imp BM, Eller MA, Kiweewa F, Maswai J, Polyak C, et al. Monocyte activation, HIV, and cognitive performance in East Africa. J Neurovirol 2019. [DOI] [PMC free article] [PubMed] [Google Scholar]
- 31.Kamkwalala AR, Wang X, Maki PM, Williams DW, Valcour VG, Damron A, et al. Higher peripheral monocyte activation markers are associated with smaller frontal and temporal cortical volumes in women with HIV. J Acquir Immune Defic Syndr 2020. [DOI] [PMC free article] [PubMed] [Google Scholar]
- 32.Sanford R, Ances BM, Meyerhoff DJ, Price RW, Fuchs D, Zetterberg H, et al. Longitudinal Trajectories of Brain Volume and Cortical Thickness in Treated and Untreated Primary Human Immunodeficiency Virus Infection. Clin Infect Dis 2018; 67(11):1697–1704. [DOI] [PMC free article] [PubMed] [Google Scholar]
- 33.Gonzalez-Scarano F, Martin-Garcia J. The neuropathogenesis of AIDS. Nat Rev Immunol 2005; 5(1):69–81. [DOI] [PubMed] [Google Scholar]
- 34.Andersen AB, Law I, Krabbe KS, Bruunsgaard H, Ostrowski SR, Ullum H, et al. Cerebral FDG-PET scanning abnormalities in optimally treated HIV patients. Journal of neuroinflammation 2010; 7:13. [DOI] [PMC free article] [PubMed] [Google Scholar]
- 35.Alakkas A, Ellis RJ, Watson CW, Umlauf A, Heaton RK, Letendre S, et al. White matter damage, neuroinflammation, and neuronal integrity in HAND. J Neurovirol 2019; 25(1):32–41. [DOI] [PMC free article] [PubMed] [Google Scholar]
- 36.Neuen-Jacob E, Arendt G, Wendtland B, Jacob B, Schneeweis M, Wechsler W. Frequency and topographical distribution of CD68-positive macrophages and HIV-1 core proteins in HIV-associated brain lesions. Clin Neuropathol 1993; 12(6):315–324. [PubMed] [Google Scholar]
- 37.Brew BJ, Rosenblum M, Cronin K, Price RW. AIDS dementia complex and HIV-1 brain infection: clinical-virological correlations. Ann Neurol 1995; 38(4):563–570. [DOI] [PubMed] [Google Scholar]
- 38.Lee DE, Reid WC, Ibrahim WG, Peterson KL, Lentz MR, Maric D, et al. Imaging dopaminergic dysfunction as a surrogate marker of neuropathology in a small-animal model of HIV. Mol Imaging 2014; 13. [DOI] [PMC free article] [PubMed] [Google Scholar]
- 39.Shah S, Maric D, Denaro F, Ibrahim W, Mason R, Kumar A, et al. Nitrosative Stress Is Associated with Dopaminergic Dysfunction in the HIV-1 Transgenic Rat. Am J Pathol 2019; 189(7):1375–1385. [DOI] [PMC free article] [PubMed] [Google Scholar]
- 40.Sinharay S, Hammoud DA. Brain PET Imaging: Value for Understanding the Pathophysiology of HIV-associated Neurocognitive Disorder (HAND). Curr HIV/AIDS Rep 2019; 16(1):66–75. [DOI] [PubMed] [Google Scholar]
- 41.Sinharay S, Lee D, Shah S, Muthusamy S, Papadakis GZ, Zhang X, et al. Cross-sectional and longitudinal small animal PET shows pre and post-synaptic striatal dopaminergic deficits in an animal model of HIV. Nucl Med Biol 2017; 55:27–33. [DOI] [PMC free article] [PubMed] [Google Scholar]
- 42.Czub S, Czub M, Koutsilieri E, Sopper S, Villinger F, Müller JG, et al. Modulation of simian immunodeficiency virus neuropathology by dopaminergic drugs. Acta Neuropathol 2004; 107(3):216–226. [DOI] [PubMed] [Google Scholar]
- 43.Czub S, Koutsilieri E, Sopper S, Czub M, Stahl-Hennig C, Müller JG, et al. Enhancement of central nervous system pathology in early simian immunodeficiency virus infection by dopaminergic drugs. Acta Neuropathol 2001; 101(2):85–91. [DOI] [PubMed] [Google Scholar]
- 44.Gaskill PJ, Yano HH, Kalpana GV, Javitch JA, Berman JW. Dopamine receptor activation increases HIV entry into primary human macrophages. PLoS One 2014; 9(9):e108232. [DOI] [PMC free article] [PubMed] [Google Scholar]
- 45.Nickoloff-Bybel EA, Mackie P, Runner K, Matt SM, Khoshbouei H, Gaskill PJ. Dopamine increases HIV entry into macrophages by increasing calcium release via an alternative signaling pathway. Brain Behav Immun 2019; 82:239–252. [DOI] [PMC free article] [PubMed] [Google Scholar]
- 46.Rottenberg DA, Moeller JR, Strother SC, Sidtis JJ, Navia BA, Dhawan V, et al. The metabolic pathology of the AIDS dementia complex. Ann Neurol 1987; 22(6):700–706. [DOI] [PubMed] [Google Scholar]
- 47.Hinkin CH, van Gorp WG, Mandelkern MA, Gee M, Satz P, Holston S, et al. Cerebral metabolic change in patients with AIDS: report of a six-month follow-up using positron-emission tomography. J Neuropsychiatry Clin Neurosci 1995; 7(2):180–187. [DOI] [PubMed] [Google Scholar]
- 48.Rottenberg DA, Sidtis JJ, Strother SC, Schaper KA, Anderson JR, Nelson MJ, et al. Abnormal cerebral glucose metabolism in HIV-1 seropositive subjects with and without dementia. J Nucl Med 1996; 37(7):1133–1141. [PubMed] [Google Scholar]
- 49.von Giesen HJ, Antke C, Hefter H, Wenserski F, Seitz RJ, Arendt G. Potential time course of human immunodeficiency virus type 1-associated minor motor deficits: electrophysiologic and positron emission tomography findings. Arch Neurol 2000; 57(11):1601–1607. [DOI] [PubMed] [Google Scholar]
- 50.Yoshizawa H, Gazes Y, Stern Y, Miyata Y, Uchiyama S. Characterizing the normative profile of 18F-FDG PET brain imaging: sex difference, aging effect, and cognitive reserve. Psychiatry Res 2014; 221(1):78–85. [DOI] [PubMed] [Google Scholar]
- 51.Ellis RJ, Badiee J, Vaida F, Letendre S, Heaton RK, Clifford D, et al. CD4 nadir is a predictor of HIV neurocognitive impairment in the era of combination antiretroviral therapy. Aids 2011; 25(14):1747–1751. [DOI] [PMC free article] [PubMed] [Google Scholar]
- 52.Thompson MA, Aberg JA, Hoy JF, Telenti A, Benson C, Cahn P, et al. Antiretroviral treatment of adult HIV infection: 2012 recommendations of the International Antiviral Society-USA panel. Jama 2012; 308(4):387–402. [DOI] [PubMed] [Google Scholar]
- 53.Han H, Agarwal R, Martel-Laferriere V, Dieterich DT. Antiretroviral and anti-hepatitis C virus direct-acting antiviral-related hepatotoxicity. Clin Liver Dis 2013; 17(4):657–670, ix. [DOI] [PubMed] [Google Scholar]
Associated Data
This section collects any data citations, data availability statements, or supplementary materials included in this article.
Supplementary Materials
Figure. 1S: Longitudinal changes in CD4 counts and plasma viral loads (VL) in the short-term (ST, n=22) and long-term (LT, n=11) follow-up after ART initiation.
Figure. 2S: Trajectories of change in subcortical and cortical relative SUV values in PLWH participants who developed non-CNS IRIS versus those who did not develop IRIS.
Figure. 3S: Trajectories of change in subcortical and cortical relative SUV values in male and female PLWH participants.
Table 1S: Demographic and clinical data of all PLWH participants.
Data Availability Statement
Anonymized data not published within this article will be made available by request from any qualified investigator.