

SUMMARY
Metazoan transcription factors typically regulate large numbers of genes. Here we identify via a CRISPR-Cas9 genetic screen ZNF410, a pentadactyl DNA-binding protein that in human erythroid cells directly activates only a single gene, the NuRD component CHD4. Specificity is conveyed by two highly evolutionarily conserved clusters of ZNF410 binding sites near the CHD4 gene with no counterparts elsewhere in the genome. Loss of ZNF410 in adult-type human erythroid cell culture systems and xenotransplantation settings diminishes CHD4 levels and derepresses the fetal hemoglobin genes. While previously known to be silenced by CHD4, the fetal globin genes are exposed here as among the most sensitive to reduced CHD4 levels. In vitro DNA binding assays and crystallographic studies reveal the ZNF410-DNA binding mode. ZNF410 is a remarkably selective transcriptional activator in erythroid cells, and its perturbation might offer new opportunities for treatment of hemoglobinopathies.
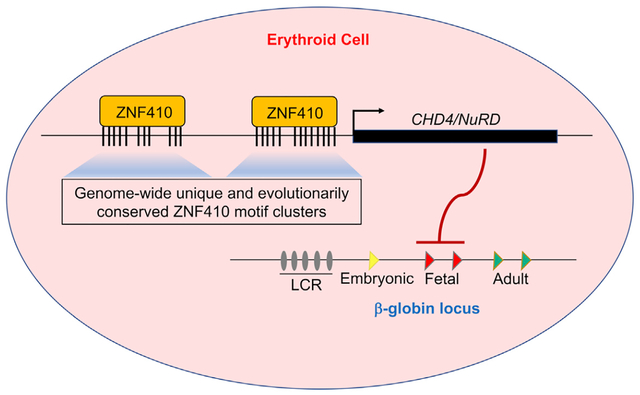
Graphical Abstract
In Brief
Lan et al. show that the transcription factor ZNF410 has a single direct target gene, the NuRD component CHD4, through which it silences the fetal-type β-globin genes in adult erythroid cells. The exquisite specificity of ZNF410 could be exploited therapeutically for treatment of hemoglobinopathies.
INTRODUCTION
In bacteria, one regulatory transcription factor (TF) often controls expression of a single gene or operon (Jacob et al., 1960). In contrast, the vast majority of mammalian TFs regulate many target genes. Spatiotemporal specificity of gene transcription is achieved by combinatorial deployment of TFs and their co-regulators. For example, the TF GATA1 cooperates with the TFs KLF1 and TAL1/SCL to regulate erythroid-specific gene expression (Love et al., 2014b), whereas GATA1, together with ETS-family TFs, regulates megakaryocyte-enriched genes (Wang et al., 2002). In erythroid cells, among the most highly expressed genes are those encoding the α and β subunits of the hemoglobin tetramer. The human β-globin gene cluster consists of one embryonic gene (HBE, also known as ε-globin), two fetal genes (HBG1 and HBG2, also known as Gγ-globin and Aγ-globin), and two adult genes (HBB and HBD, also known as β-globin and δ-globin). The ε-globin gene is transcribed in primitive erythroid cells in early development, and, during early gestation, is silenced concomitantly with the γ-globin genes turning on. Around the time of birth, a second switch occurs when β- and δ-globin transcription is activated at the expense of the γ-globin genes. Therefore, disease-causing alterations in the β-globin gene, such as those causing sickle cell disease (SCD) and some types of β-thalassemia, become symptomatic after birth, coincident with the γ-to-β-globin switch. Reversing the switch from β-globin back to γ-globin expression in developing erythroid cells has been a major endeavor for treating these diseases (Platt et al., 1994; Wienert et al., 2018).
Although lineage-restricted TFs such as GATA1 and TAL1 are essential for erythroid-specific transcription of the globin genes, two more widely expressed zinc-finger TFs, BCL11A and LRF (ZBTB7A), play a dominant role in the fetal-to-adult switch in globin gene transcription (Masuda et al., 2016; Menzel et al., 2007; Sankaran et al., 2008; Uda et al., 2008). Both of these factors bind at several locations along the β-globin gene cluster, including the promoter and upstream regions of the γ-globin genes, to silence γ-globin transcription (Liu et al., 2018; Martyn et al., 2018). Both factors interact with the CHD4/NuRD complex, and CHD4 and associated proteins are required for transcriptional repression of the γ-globin genes (HBG1/2) (Amaya et al., 2013; Masuda et al., 2016; Sher et al., 2019; Xu et al., 2013). Given that BCL11A contains a motif found in a variety of NuRD-associated molecules that is necessary and sufficient for NuRD binding (Hong et al., 2005; Lejon et al., 2011), the most parsimonious model is that BCL11A and LRF are direct links between NuRD and the γ-globin genes. Key unanswered questions are whether the expression of NuRD proteins themselves is regulated and whether control of NuRD expression might be part of the γ-globin regulatory circuitry.
To search for novel regulators of γ-globin expression, we screened a sgRNA library targeting the DNA-binding domains of most known human TFs using an optimized protein domain-focused CRISPR-Cas9 screening platform (Grevet et al., 2018; Shi et al., 2015). We found that zinc finger 410 (ZNF410, APA-1), a TF with five tandem canonical C2H2-type zinc fingers (ZFs) is required for maintenance of γ-globin silencing. RNA sequencing (RNA-seq), chromatin immunoprecipitation sequencing (ChIP-seq), and genetic perturbation led to the remarkable finding that ZNF410 regulates CHD4 as its sole direct target gene via two dense binding site clusters not found elsewhere in the genome. We further demonstrate that the γ-globin genes are exquisitely sensitive to CHD4 levels. DNA binding and crystallographic studies reveal the mode of ZNF410 interaction with DNA. To our knowledge, ZNF410 is the only known mammalian TF with a single regulatory target in erythroid cells.
RESULTS
A CRISPR-Cas9 Screen Identifies ZNF410 as a Candidate γ-Globin Repressor
To identify novel regulators of HbF expression, we screened a sgRNA library containing 6 sgRNAseach targeting the DNA-binding domain of most human TFs (1,436 total; on average, 6 sgRNAs each) (Huang et al., 2020). A lentiviral vector library encoding the sgRNAs was used to transfect the human adult-type erythroid cell line HUDEP-2 that stably expresses spCas9 (HUDEP-2-Cas9; Grevet et al., 2018). The top 10% and bottom 10% of HbF-expressing cells were purified via anti-HbF fluorescence-activated cell sorting (FACS), and representation of each sgRNA in the two populations was assessed by deep sequencing (Figure 1A; Table S1). As expected, control non-targeting sgRNAs were evenly distributed between the HbF-high and HbF-low populations. Positive control sgRNAs targeting the known γ-globin repressor genes BCL11A and LRF were enriched in the HbF-high population (Figure 1B), validating the screen. Six sgRNAs against a novel TF with no known prior role in globin gene regulation, ZNF410, were significantly enriched in the HbF-high population (Figure 1B), suggesting that ZNF410 may function as a direct or indirect repressor of γ-globin expression.
Figure 1. A Domain-Focused CRISPR-Cas9 Screen Identifies ZNF410 as a Novel γ-Globin Repressor.
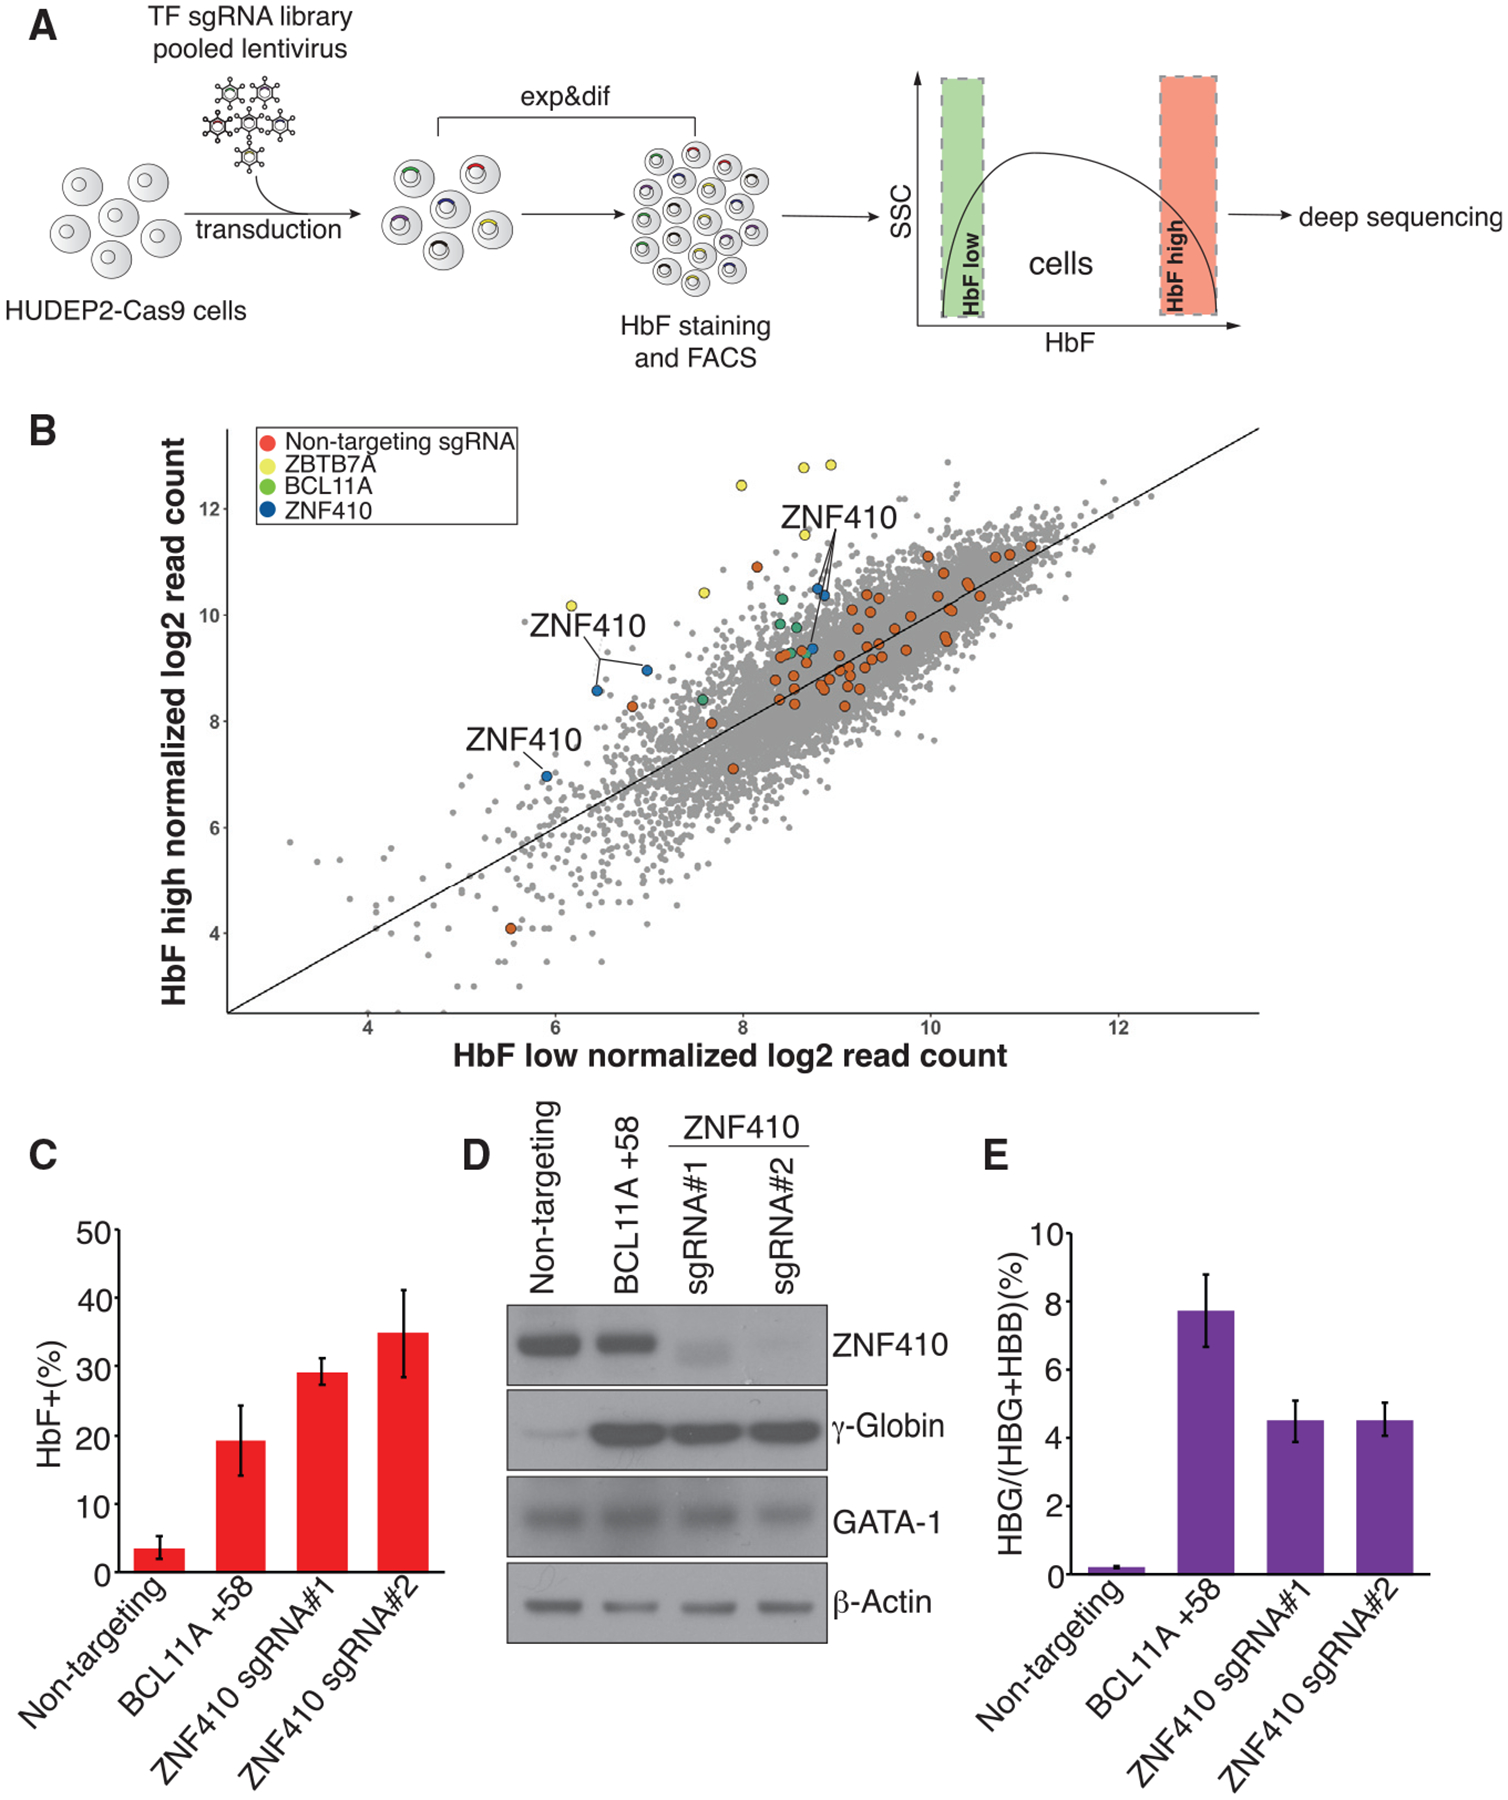
(A) Schematic of the screening strategy. TF, transcription factor; Exp&dif, expansion and differentiation; FACS, fluorescence-activated cell sorting.
(B) Scatterplot of the screen results. Each dot represents one sgRNA. Control sgRNAs (red dots) are scattered randomly across the diagonal. ZBTB7A (yellow) and BCL11A (green) represent positive control sgRNAs.
(C) Summary of HbF flow cytometry analyses. BCL11A +58, sgRNA targeting the +58-kb erythroid enhancer of the BCL11A gene, served as a positive control. Non-targeting sgRNA served as a negative control. Results are shown as mean ± SD (n = 3).
(D) Immunoblot analysis using whole-cell lysates from differentiated HUDEP-2 cell pools transduced with the indicated sgRNAs.
(E) γ-globin mRNA measured by RT-qPCR in differentiated HUDEP-2 cell pools; data are plotted as percentage of γ-globin over γ-globin+ β-globin levels. Results are shown as mean ± SD (n = 3).
Little is known about ZNF410. One report suggests that it functions as a transcriptional activator in human fibroblasts (Benanti et al., 2002). ZNF410 is widely expressed across human tissues (Database: Genotype-Tissue Expression). In blood, ZNF410 is highly expressed in the erythroid lineage (Database: BloodSpot), and its mRNA levels are similar in fetal and adult erythroblasts (Huang et al., 2017).
To validate the screening results, two independent sgRNAs targeting the DNA-binding domain of ZNF410 were stably introduced into HUDEP-2-Cas9 cells along with a positive control sgRNA (targeting the +58 erythroid enhancer of the BCL11A gene) and non-targeting negative control sgRNA. Depletion of ZNF410 strongly increased the fraction of HbF-expressing cells, as determined by flow cytometry using anti-HbF antibodies (Figures 1C and S1A). Western blotting revealed substantial elevation of γ-globin protein in ZNF410-depleted HUDEP-2 cells. The protein levels of GATA1 were unchanged, consistent with erythroid maturation being intact in these cells (Figure 1D). To assess whether ZFN410 affects transcription of the γ-globin gene, we carried out RT-qPCR. A robust increase in primary and mature γ-globin mRNA occurred upon ZFN410 depletion, suggesting transcriptional regulation (Figures 1E, S1B, and S1C). ZNF410 loss did not affect ε-globin mRNA levels, suggesting specificity for the fetal globin genes (Figure S1D). Importantly, there were no notable changes in α-globin, β-globin, and GATA1 mRNA levels (Figures S1E–S1G), suggesting that ZNF410 depletion did not overtly impair erythroid differentiation, an observation further supported by RNA-seq analysis (below; Figure S1H). In sum, our screen identified ZNF410 as novel repressor of γ-globin gene expression in HUDEP-2 cells
Depletion of ZNF410 Elevates γ-Globin Levels in Primary Human Erythroblasts
The repressive role of ZNF410 on HbF was tested further in primary human erythroblasts derived from a three-phase human CD34+ hematopoietic stem and progenitor cell (HSPC) culture system (Grevet et al., 2018). We depleted ZNF410 by electropo-rating ribonucleoprotein (RNP) Cas9:sgRNAs complexes using two independent sgRNAs. A sgRNA targeting the erythroid +58 enhancer of BCL11A was used as positive control. In line with findings in HUDEP-2 cells, ZNF410 depletion significantly elevated the proportion of HbF+ cells (Figures 2A and 2B), γ-globin protein levels (western blot; Figure 2C), HbF protein levels (high-performance liquid chromatography [HPLC]; Figure 2D), and γ-globin primary and mature mRNA (Figures 2E, S2A, and S2B). Moreover, ε-globin mRNA levels were unaffected (Figure S2C). α-Globin, β-globin, and GATA1 levels remained largely unchanged (Figures S2D–S2F), suggesting that ZNF410 loss did not adversely affect maturation of these cells. Cell surface marker phenotyping using anti-CD71 and anti-CD235a antibodies as well as examination of cell morphology (Figures S2G and S2H) indicated normal erythroid maturation in ZNF410-deficient cells.
Figure 2. ZNF410 Depletion Induces γ-Globin Expression in Primary Erythroblasts.
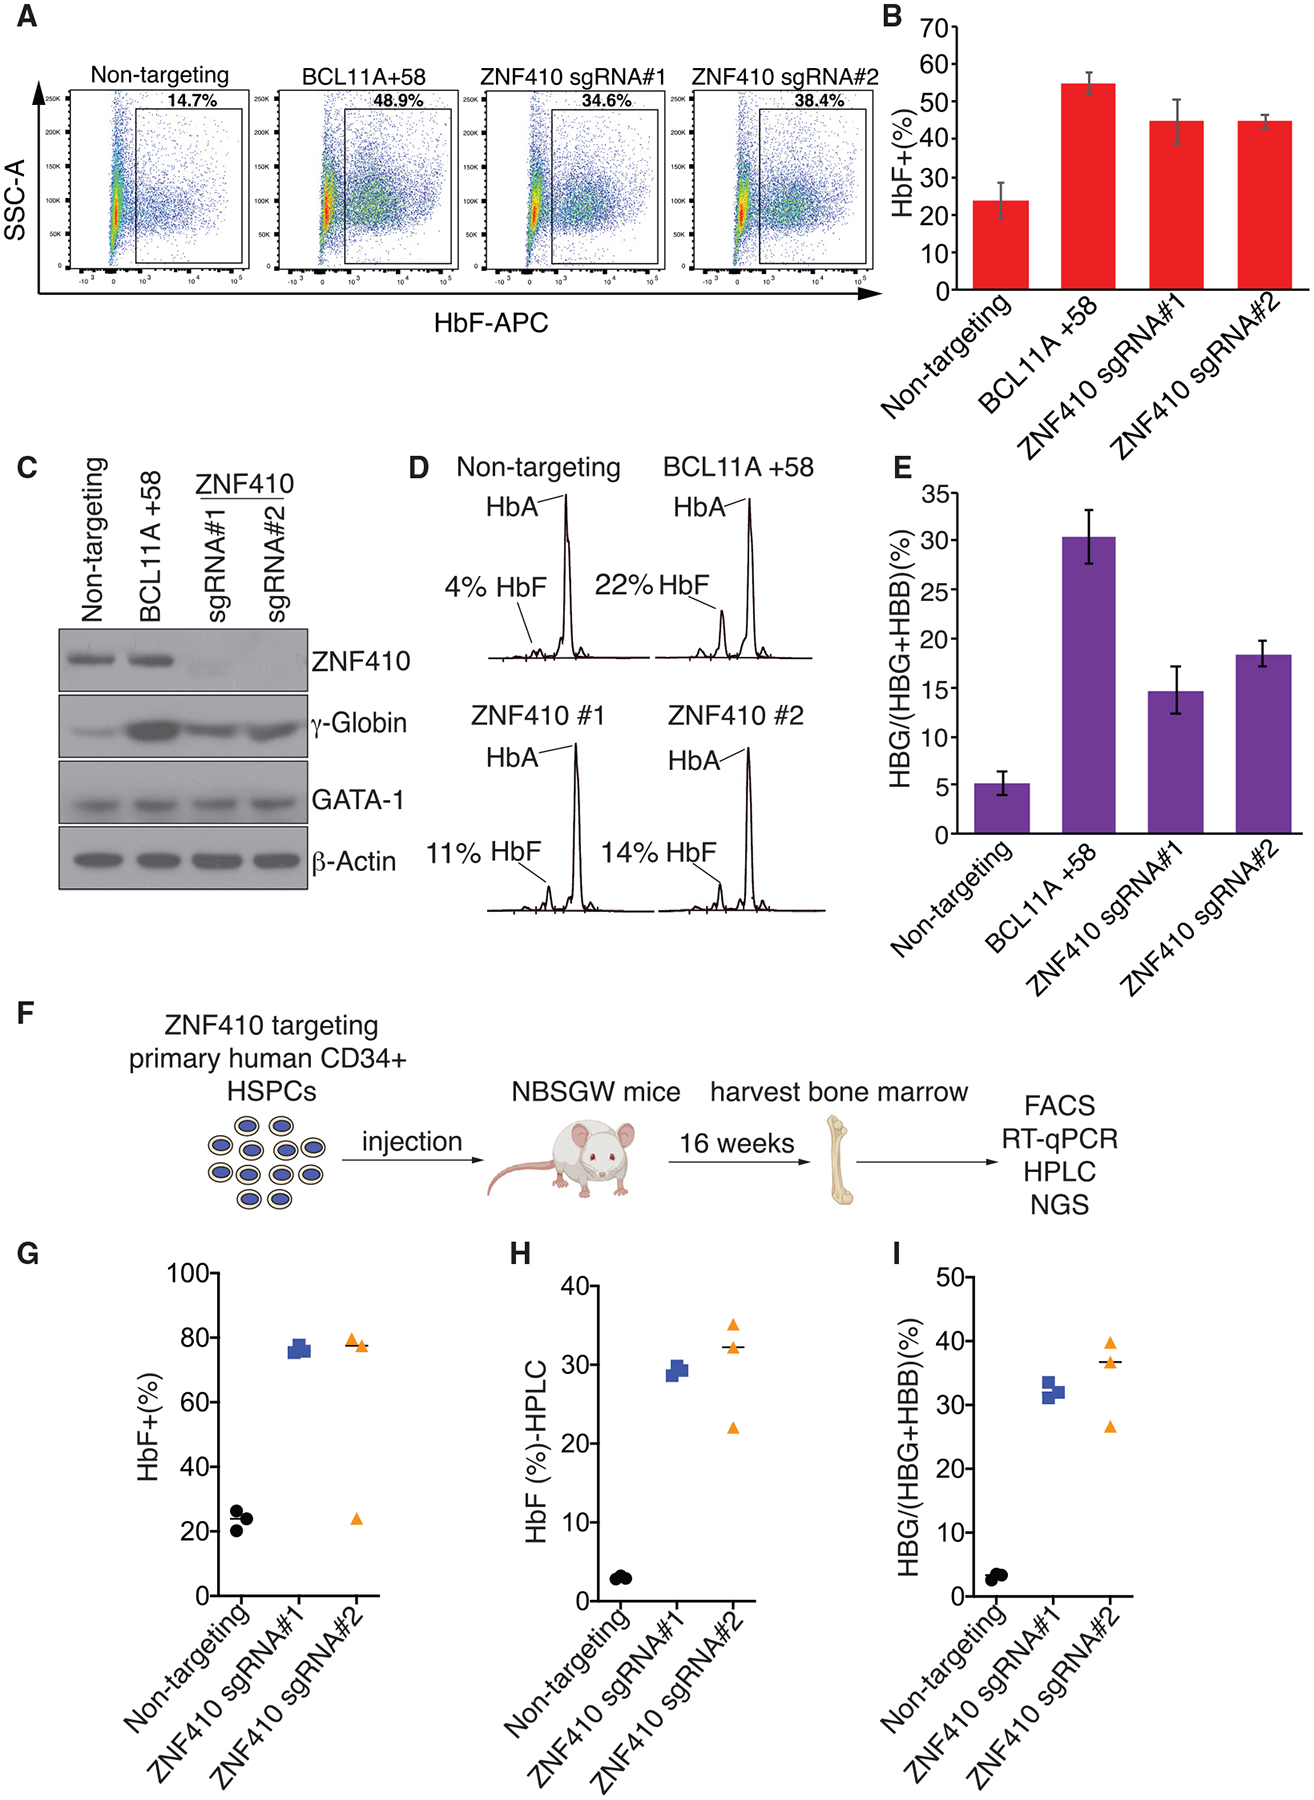
(A) Representative flow cytometry analysis of cells stained with anti-HbF antibody on day 15 of erythroid differentiation.
(B) Summary of HbF flow cytometry analyses. Results are shown as mean ± SD (n = 3 donors).
(C) Immunoblot analysis using whole-cell lysates from primary erythroblasts with the indicated sgRNAs on day 15 of differentiation.
(D) Representative HPLC analysis of cells with the indicated sgRNAs on day 15 of differentiation. HbA, hemoglobin A (adult form); HbF, fetal hemoglobin. The HbF peak area is shown as percent of total HbF+HbA.
(E) γ-Globin mRNA measured by RT-qPCR in primary erythroblasts on day 12 of differentiation; data are plotted as percentage of γ-globin over γ-globin+ β-globin levels. Results are shown as mean ± SD (n = 3 donors).
(F) Schematic of the experimental design.
(G–I) Summary of HbF flow cytometry analyses (G), HPLC analysis (H), and γ-globin mRNA measured by RT-qPCR (I) in human CD235a+ erythroblasts isolated from recipient bone marrow. Each dot represents a single recipient mouse. n = 3 mice per sgRNA.
In vitro cell culture systems may not always reflect the true biology of developing erythroid cells in vivo. Moreover, commonly used mouse models may, in some cases, not faithfully reproduce all regulatory features of human erythroid cells (Huang et al., 2020). Therefore, we used a human-to-mouse xenotransplantation model to further assess the role of ZNF410 in the regulation of γ-globin expression in vivo. We transfected healthy adult human donor CD34+ HSPCs with RNP complexes consisting of spCas9 and two sgRNAs against ZNF410, (analyzed separately) or a non-targeting sgRNA as a negative control, and then transplanted them into nonobese diabetic/severe combined immunodeficiency/Il2rγ−/−/KitW41/W41 (NBSGW) mice that support human erythropoiesis in the bone marrow (McIntosh et al., 2015). We measured the fraction of various en-grafted human lineages and their gene editing frequencies in recipient bone marrow 16 weeks after xenotransplantation (Figure 2F), a time when CD34+ progenitor cells are mainly derived from the human transplant (McIntosh et al., 2015). Donor chimerism of ZNF410-edited CD45+ hematopoietic cells was slightly lower than in control cells exposed to non-targeting sgRNA (Figure S2I). Chimerism levels and insertion or deletion (indel) frequencies were similar in all edited and nonedited lineages tested, including B, myeloid, erythroid, and progenitor cells (Figures S2J and S2K), indicating that ZNF410 depletion did not overtly affect hematopoietic development. Importantly, in the erythroid compartment (CD235+), we observed a robust increase in the fraction of HbF+ cells (from ~23% to ~78%), HbF protein levels (from ~3% to ~33%), and γ-globin mRNA levels (from ~3% to ~32%) (Figures 2G–2I), consistent with the results in HUDEP-2 cells and cultured primary human erythroblasts. Again, depletion of ZNF410 did not appear to impair erythroid maturation (Figure S2L). Collectively, these in vivo studies verify that ZNF410 functions as a robust repressor of HbF with little detrimental effect on hematopoietic development.
ZNF410 Represses HbF by Modulating CHD4 Expression
ZNF410 was previously reported to function as a transcriptional activator (Benanti et al., 2002). To understand how ZNF410 regulates transcription of γ-globin genes, we performed RNA-seq experiments in ZNF410-depleted differentiated HUDEP-2 cells and primary human erythroblasts. Upon ZNF410 depletion in HUDEP-2 cells, 70 genes were upregulated and 46 genes were downregulated, with a threshold setting of 1.5-fold (p < 0.05), only counting genes that incurred changes with both ZNF410 sgRNAs in each of the biological replicates (Figure S3A). In primary erythroid cultures, 83 genes were upregulated and 126 genes were downregulated upon ZNF410 depletion (Figure S3A). This includes 30 upregulated and 15 downregulated genes in both cell types (Figures S3B). Notably, γ-globin (HBG) mRNA levels stood out among the most strongly induced genes (Figures 3A, 3B, S3C, and S3D; Table S3).
Figure 3. CHD4 Mediates γ-Globin Repression by ZNF410.
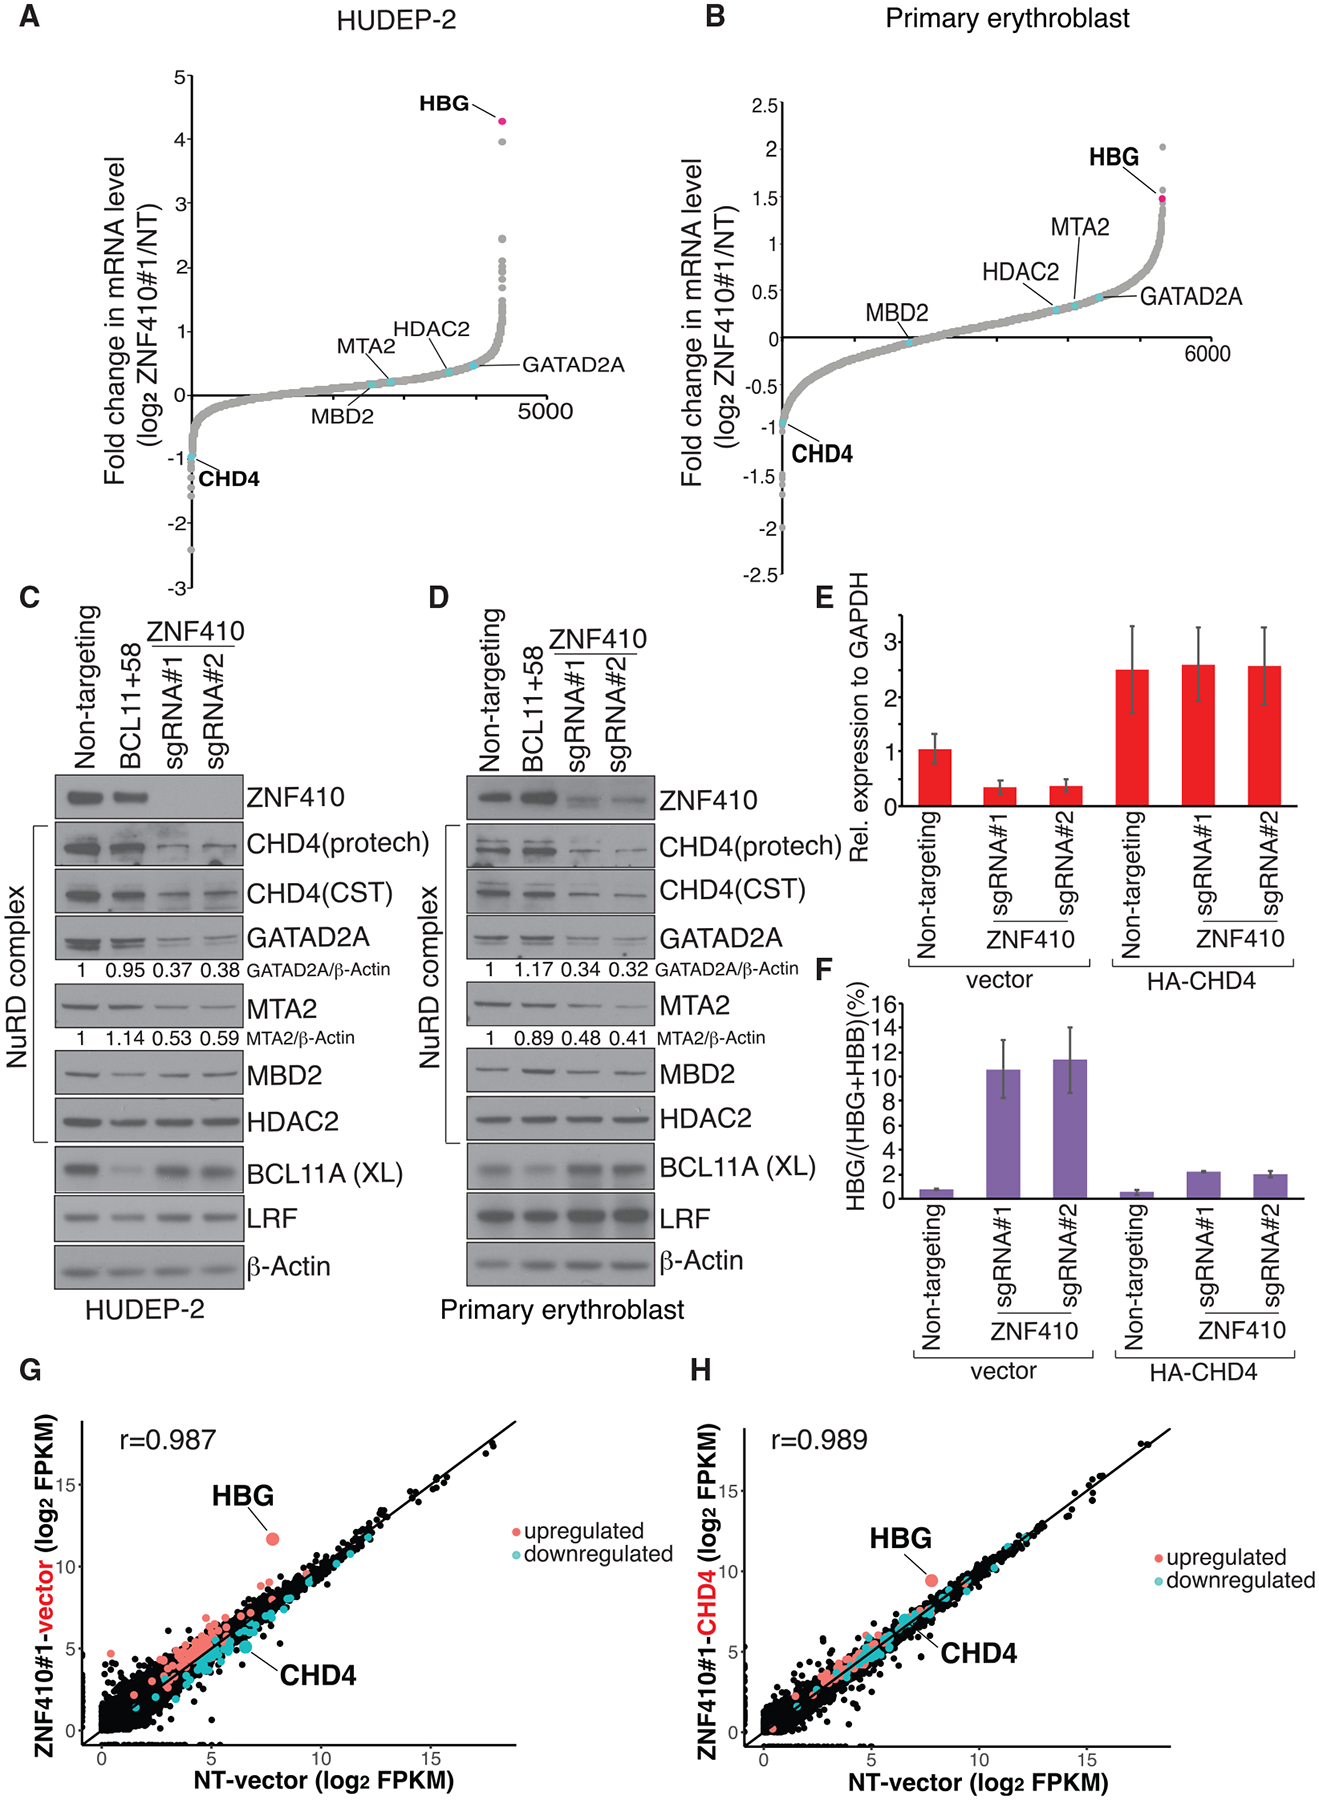
(A) RNA-seq analysis of HUDEP-2 cells transduced with ZNF410 sgRNA#1. Infected cells were sorted and differentiated for 7 days. Plotted is the average fold change in mRNA levels of two biological replicates. Genes encoding NuRD complex subunits and γ-globin (HBG) are indicated. Fragments per kilobase of transcript per million (FPKM) mapped reads were used to calculate fold change. NT, non-targeting. The x axis indicates the rank numbers of the genes.
(B) RNA-seq analysis of primary erythroblasts with ZNF410 depletion by sgRNA#1. Cells were differentiated for 12 days. Plotted is the average fold change in mRNA levels of two independent donors.
(C and D) Immunoblot analysis using whole-cell lysates from differentiated HUDEP-2 cells (C) and primary erythroblasts on day 15 of differentiation (D). BCL11A(XL) is the functional BCL11A isoform. ImageJ software was used for quantification.
(E) CHD4 mRNA levels measured by RT-qPCR in ZNF410-deficient HUDEP-2 cells transduced with a lentiviral vector containing CHD4 cDNA or empty vector. Results are shown as mean ± SD (n = 2).
(F) γ-Globin levels measured by RT-qPCR in ZNF410-deficient HUDEP-2 cells transduced with a lentiviral vector containing CHD4 cDNA or empty vector. Data are plotted as percentage of γ-globin over γ-globin+ β-globin levels. Results are shown as mean ± SD (n = 2).
(G) Scatterplot of RNA-seq analysis in ZNF410-deficient HUDEP-2 cells (by ZNF410 sgRNA#1) with empty vector. Cells with NT sgRNA and vector serve as a control. Each dot indicates a gene. Each gene is depicted according to the averaged FPKM value from 2 biological replicates. r, Pearson’s correlation coefficient.
(H) Scatterplot of RNA-seq analysis in ZNF410-deficient HUDEP-2 cells (by ZNF410 sgRNA#1) with re-introduction of CHD4 cDNA.
The CHD4 gene, which encodes a catalytic subunit of the NuRD complex, was among the most downregulated genes (Figures 3A, 3B, S3C, and S3D; Table S3). The NuRD complex contributes to the γ-globin-repressive functions of BCL11A and LRF in erythroid cells. In addition to CHD4, the GATAD2A, HDAC2, MBD2, and MTA2 subunits of the NuRD complex are required for γ-globin repression (Sher et al., 2019). However, the mRNA levels of these subunits were not diminished in ZNF410-depleted cells, suggesting that CHD4 is the only ZNF410-regulated NuRD subunit (Figures 3A, 3B, S3C, and S3D). We validated these results by RT-qPCR in HUDEP-2 cells, cultured primary erythroid cells, and ZNF410-depleted erythroid cells isolated from xeno-transplanted NBSGW mice (Figures S3E–S3G). Overall, the reduction in CHD4 transcript levels amounted to approximately 65% in all three cellular systems in all (Figures S3E–S3G). That ZNF410 might be limiting for CHD4 transcription is further supported by the strong correlation between ZNF410 and CHD4 transcript levels across 53 human tissues based on the Genotype-Tissue Expression database (Figure S3H). Lastly, neither ZNF410 nor CHD4 have any developmental stage specificity as their mRNA levels are comparable in fetal and adult erythroblasts (Huang et al., 2017).
In agreement with the mRNA analysis, CHD4 protein levels were significantly reduced upon ZNF410 depletion in HUDEP-2 and primary erythroblasts, whereas BCL11A, LRF, HDAC2, and MBD2 protein amounts remained unchanged (Figures 3C and 3D). Of note, although GATAD2A and MTA2 transcripts were unaltered, their protein levels were reduced upon ZNF410 depletion (Figures 3C, 3D, and S3E–S3G), which could also contribute to induction of γ-globin. We speculate that these subunits are destabilized in the absence of CHD4 (Torrado et al., 2017). No other genes known to regulate γ-globin silencing were altered by ZNF410 depletion, suggesting that CHD4 is the critical link between ZNF410 and γ-globin silencing.
CHD4 Is the Sole Mediator of ZNF410 Function
Our results so far implicate CHD4 as the key ZNF410-controlled regulator of γ-globin silencing. Therefore, we examined whether expression of CHD4 in ZNF410-depleted cells restored γ-globin silencing. We transduced ZNF410-deficient HUDEP-2 cells with a lentiviral vector encoding CHD4 cDNA linked to an IRES element and GFP expression cassette, followed by FACS purification of GFP+ cells. The transduced cells expressed CHD4 mRNA at a level approximately 2.0-fold above normal (Figure 3E). CHD4 expression almost completely restored the silencing of γ-globin without influencing the expression of other erythroid genes, such as α-globin, β-globin, and GATA1 (Figures 3F and S4A–S4E). To assess whether other transcriptional changes resulting from ZNF410 loss are also attributable to lower CHD4 levels, we performed replicate RNA-seq experiments in the CHD4-expressing- ZNF410-deficient HUDEP-2 cells. Notably, 69 out of 70 upregulated genes and 44 out of 46 downregulated genes in the ZNF410-deficient cells were expressed at normal levels following CHD4 “rescue” (Figures 3G, 3H, S4F, and S4G). Why the expression of three genes (RNU2-2P, RNU4-2, and VSIR) was incompletely restored upon CHD4 re-expression is unclear but might be due to imperfect levels of CHD4 restoration or a drift in gene expression profiles following gene knockout/rescue experiments in cell pools. None of the three genes whose expression remained unrestored to normal levels are associated with ZNF410 ChIP-seq peaks (see below), suggesting that they are not direct ZNF410 targets. Together, these results suggest that CHD4 is the only functionally relevant ZNF410 target gene and is responsible for the repression of γ-globin transcription. Another remarkable finding is that the γ-globin genes (HBG1/2) are among the most sensitive to CHD4 levels.
A Singular Enrichment of ZNF410 Binding Clusters at the CHD4 Gene
Our RNA-seq study identified numerous genes that were up- or downregulated after ZF410 depletion. To investigate which of these genes are direct ZF410 targets, we performed anti-ZNF410 ChIP-seq in HUDEP-2 cells and primary human erythroblasts, with ZNF410-deficient HUDEP-2 cells as a control. We detected only 8 high-confidence peaks corresponding to 7 genes total in HUDEP-2 and primary human erythroid cells (Figure 4A). To exclude the possibility that such unusually few called peaks are due to limitations in ZNF410 detection by ChIP, we overexpressed hemagglutinin (HA)-tagged ZNF410 or empty vector in HUDEP-2 cells (Figure S5A). Anti-HA ChIP-seq detected the same 8 ZNF410 peaks with comparable intensity profiles (Figure 4A). No ZNF410 binding was detected at the β-globin locus (Figure S5B), supporting a model in which ZNF410 indirectly regulates γ-globin transcription. Six of 8 ZNF410 ChIP-seq peaks were of modest magnitude. Most strikingly, two very strong peaks were located at the promoter-proximal (approximately 300 bp) and -distal (approximately 6 kb) CHD4 regulatory regions. These data suggest that ZNF410 directly regulates an unusually small number of genes and that suppression of ZNF410 may induce γ-globin transcription by downregulating the NuRD component CHD4.
Figure 4. ZNF410 Binding to the CHD4 Locus Occurs at Highly Conserved Motif Clusters.
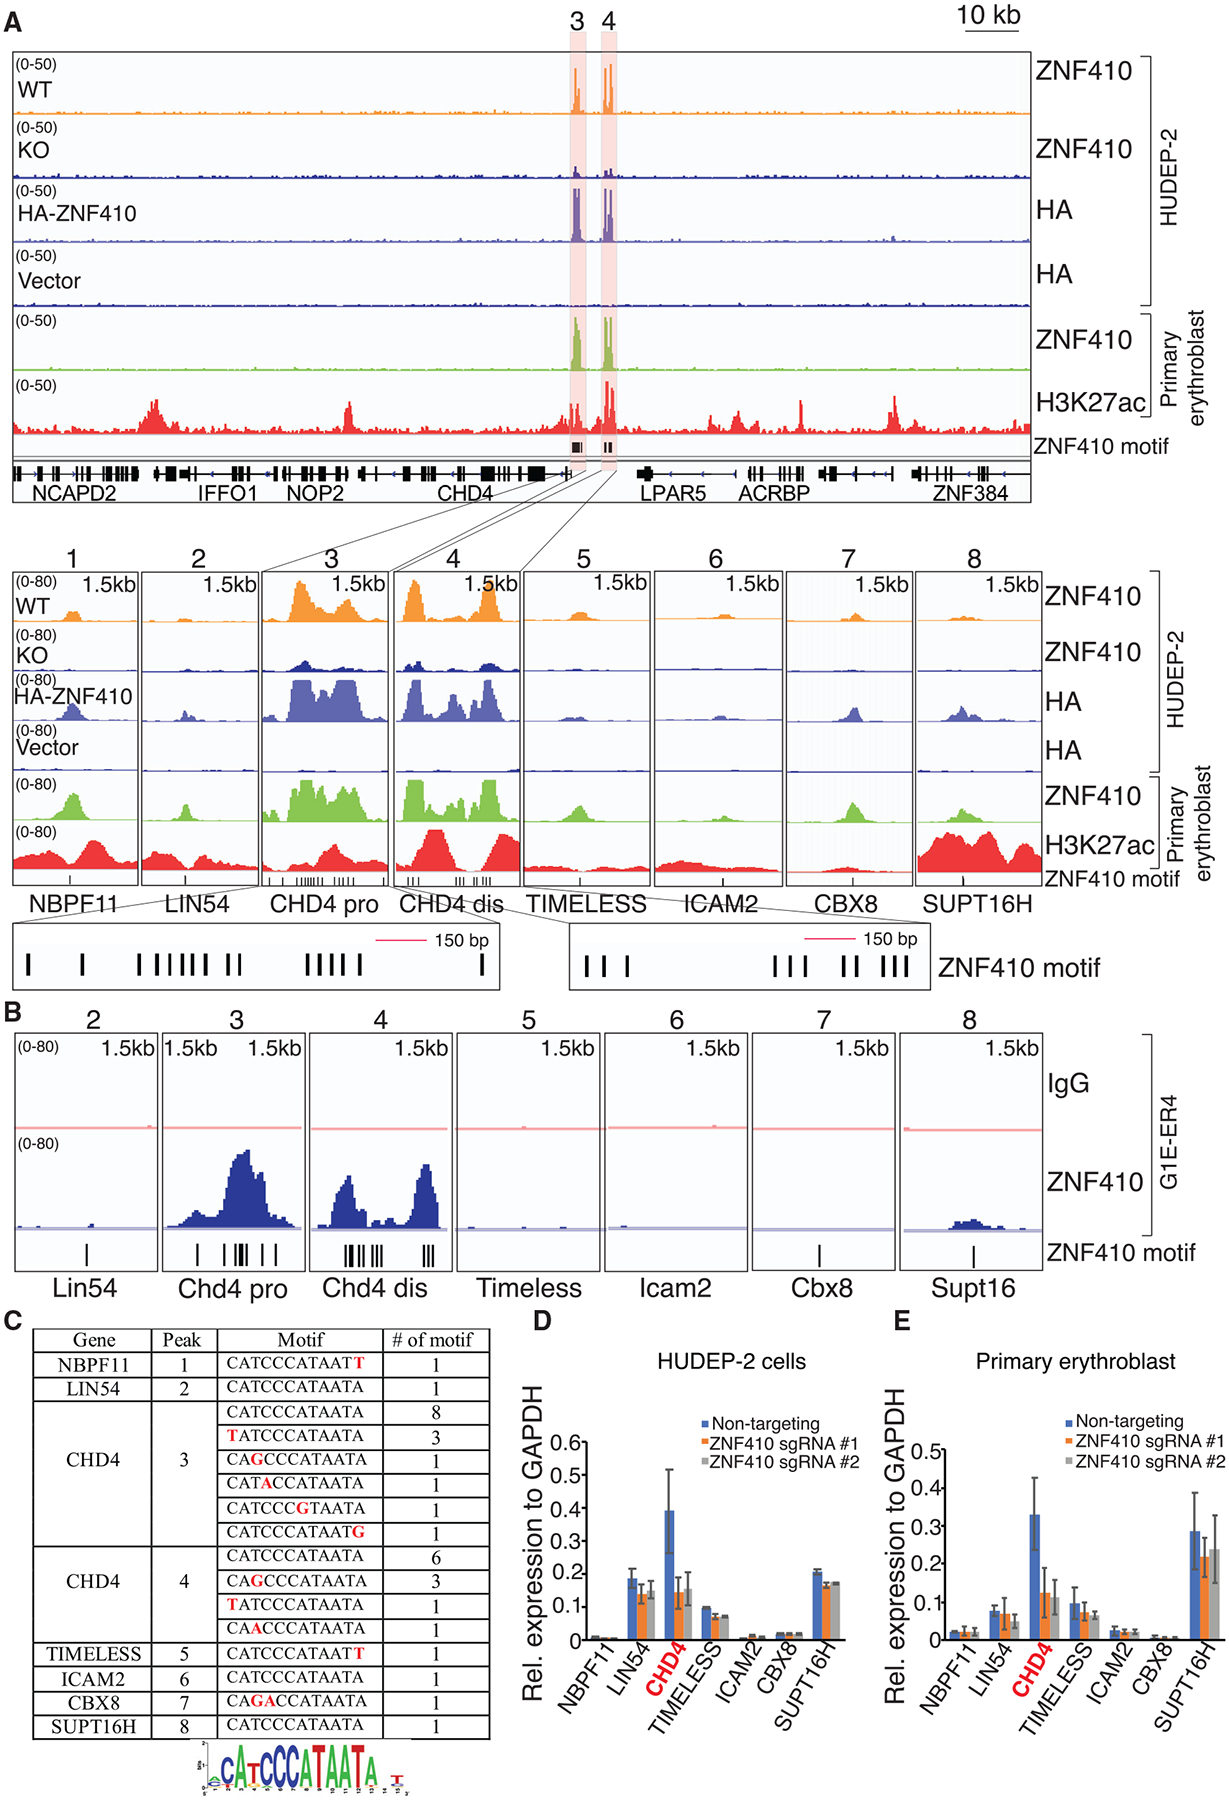
(A) ChIP-seq profiles of endogenous ZNF410, HA-ZNF410, and H3K27ac. The CHD4 promoter and enhancer are highlighted in orange. ZNF410 binding motifs are denoted by vertical black lines at the bottom. The 8 peak-associated genes are shown below the tracks. ZNF410 knockout (KO) cells and cells transduced with empty vector serve as negative controls. Pro, proximal; dis, distal; HA-ZNF410, N-terminal HA-tagged ZNF410; HA, hemagglutinin.
(B) Browser tracks of endogenous ZNF410 ChIP-seq occupancy at the 7 murine counterparts in differentiated mouse erythroid cells. ZNF410 binding motifs are shown at the bottom. The immunoglobulin G (IgG) track served as a negative control.
(C) Summary of ZNF410 binding motif counts at the 8 peaks and derived de novo motif logo in the human genome. Red font indicates the variants.
(D and E) mRNA levels of the 7 ZNF410-bound genes in HUDEP-2 cells transduced with the indicated sgRNAs (D) and primary erythroblasts electroporated with the indicated sgRNAs (E) by RT-qPCR (n = 2). Results are shown as mean ± SD.
HOMER motif analysis based on the 8 high-confidence binding sites from our ChIP-seq data generated the 12-nucleotide motif CATCCCATAATA (Figure 4C), which is almost identical to that found by in vitro systematic evolution of ligands by exponential enrichment (SELEX) experiments of human ZNF410 (Jolma et al., 2013). Utilizing EMBOSS fuzznuc, we found 434 of such motif instances and 3,677 instances when combining all the motifs found under ZNF410 ChIP-seq peaks. The overall frequency of these motifs is very low compared with those of most TF binding sites (Srivastava and Mahony, 2020). However, since the vast majority of these motifs had no measurable ChIP-seq signal, additional features must account for the rare in vivo binding events. The two strongest ZNF410 ChIP-seq peaks were at the promoter-proximal (approximately −300 bp) and -distal (approximately −6 kb) CHD4 regulatory regions, encompassing 15 and 11 motifs, respectively (each within a 1.5-kb window), whereas the remaining 6 modest peaks harbor only one motif each (Figures 4A and 4C). Importantly, the two peaks at the CHD4 locus are the only regions in the entire genome with a high density of ZNF410 motifs, likely explaining the exquisite target specificity.
To explore additional criteria that might account for the selectivity of ZNF410 binding to chromatin, we asked whether ZNF410 chromatin occupancy is associated with features of open chromatin. First we generated, in primary human erythroblasts, ChIP-seq profiles for H3K27ac, a histone mark associated with active chromatin, and complemented these data by mining chromatin accessibility (ATAC-seq) data from primary human erythroblasts (Ludwig et al., 2019). All 8 ZNF410 peaks, including the two strong peaks at the CHD4 promoter-proximal and -distal regions, fell into accessible chromatin (based on the ATAC-seq signal) that was also enriched in H3K27ac (Figures 4A and S5C). In contrast, the vast majority of the unbound consensus motif instances elsewhere in the genome were in regions devoid of H3K27ac or ATAC-seq signal (Table S4). Although the scarcity of ZNF410-bound sites precludes a reliable correlative analysis, we did find only a very modest positive correlation between signal strengths for ZNF410 binding with H3K27ac levels or ATAC-seq signal (Pearson’s correlation coefficient of 0.33 and 0.24, respectively, in primary erythroblasts; Figure S5C). However, the categorical association of ZNF410 binding with open, active chromatin was almost complete, suggesting that ZNF410 requires open chromatin and perhaps additional TFs, in addition to motif clustering, to enable its binding to chromatin.
The mere occupancy of a TF at a gene does not necessarily lead to regulatory influence. We examined and validated our RNA-seq data in ZNF410-deficient cells for expression of the seven genes bound by ZNF410. Importantly, among these genes, CHD4 was the only one with significantly reduced mRNA levels in ZNF410-depleted cells (Figures 4D, 4E, S5D, and S5E). Thus, ZNF410 directly and functionally regulates a single target gene, CHD4, in erythroid cells. Hence, the other gene expression changes that occur upon ZNF410 loss are likely due to diminished CHD4 levels. This model is supported by the restoration of transcriptome changes upon CHD4 expression in ZNF410-deficient cells (Figures 3G, 3H, S4F, and S4G).
ZNF410 Binding to Chromatin Occurs at Highly Conserved Motif Clusters
Highly conserved non-coding elements can function as enhancers and are associated with TF binding sites (Pennacchio et al., 2006). We assessed conservation of the ZNF410 binding regions at the CHD4 locus using the phastCons scores deduced from sequence similarities across 100 vertebrate species (Siepel et al., 2005). Both ZNF410 binding site clusters display a high degree of conservation comparable to that at the CHD4 exons (Figure S5F). Moreover, the human ZNF410 protein sequence is 94% identical to mouse protein, and the DNA binding ZF domain is nearly 100% identical (Figure S5G).
To examine whether ZNF410 binding selectivity for the CHD4 locus is conserved in the mouse, we carried out ZNF410 ChIP-seq in the erythroid cell line G1E-ER4 (Weiss et al., 1997). As in human cells, the Chd4 proximal and distal regulatory regions were by far the most strongly ZNF410-occupied sites genome wide (Figure 4B). Of the 6 human genes that exhibited modest ZNF410 ChIP-seq signals, no signal was detected at 4 orthologs in mice (Lin54, Timeless, Icam2, and Cbx8). A modest signal was detected at the mouse Supt16 gene, but its expression was not altered by loss of ZNF410. Further analysis confirmed that, among 1876 motif instances matching the most common motifs in the human genome, the Chd4 proximal and distal regulatory regions are also by far the most enriched locations in the mouse genome (Figure 4B). These findings indicate that regulation of the CHD4 gene by ZNF410 is mediated through unique, evolutionarily conserved motif clusters.
Characterization of DNA Binding by ZNF410
ZNF410 contains five tandem C2H2-type ZFs potentially involved in DNA binding (Figure 5A). However, as is the case for many ZF TFs, not all ZFs necessarily make direct DNA contacts. We assessed direct DNA binding by full-length (FL) ZNF410 to sequences found at the CHD4 gene by electrophoretic mobility shift assays (EMSAs). Using nuclear extracts from COS cells overexpressing FLAG-tagged ZNF410 constructs and radiolabeled probes containing the relevant motifs (Figure 5B), FL ZNF410 protein displayed comparable binding to each of the four DNA probes containing a single motif associated with the ChIP-seq signal at the CHD4 proximal and distal regions (Figure 5C). Addition of anti-FLAG antibody to the binding reaction led to a “supershift” (Figure 5C), confirming binding specificity.
Figure 5. The ZF Domain of ZNF410 Is Sufficient for DNA Binding In Vitro and In Vivo.
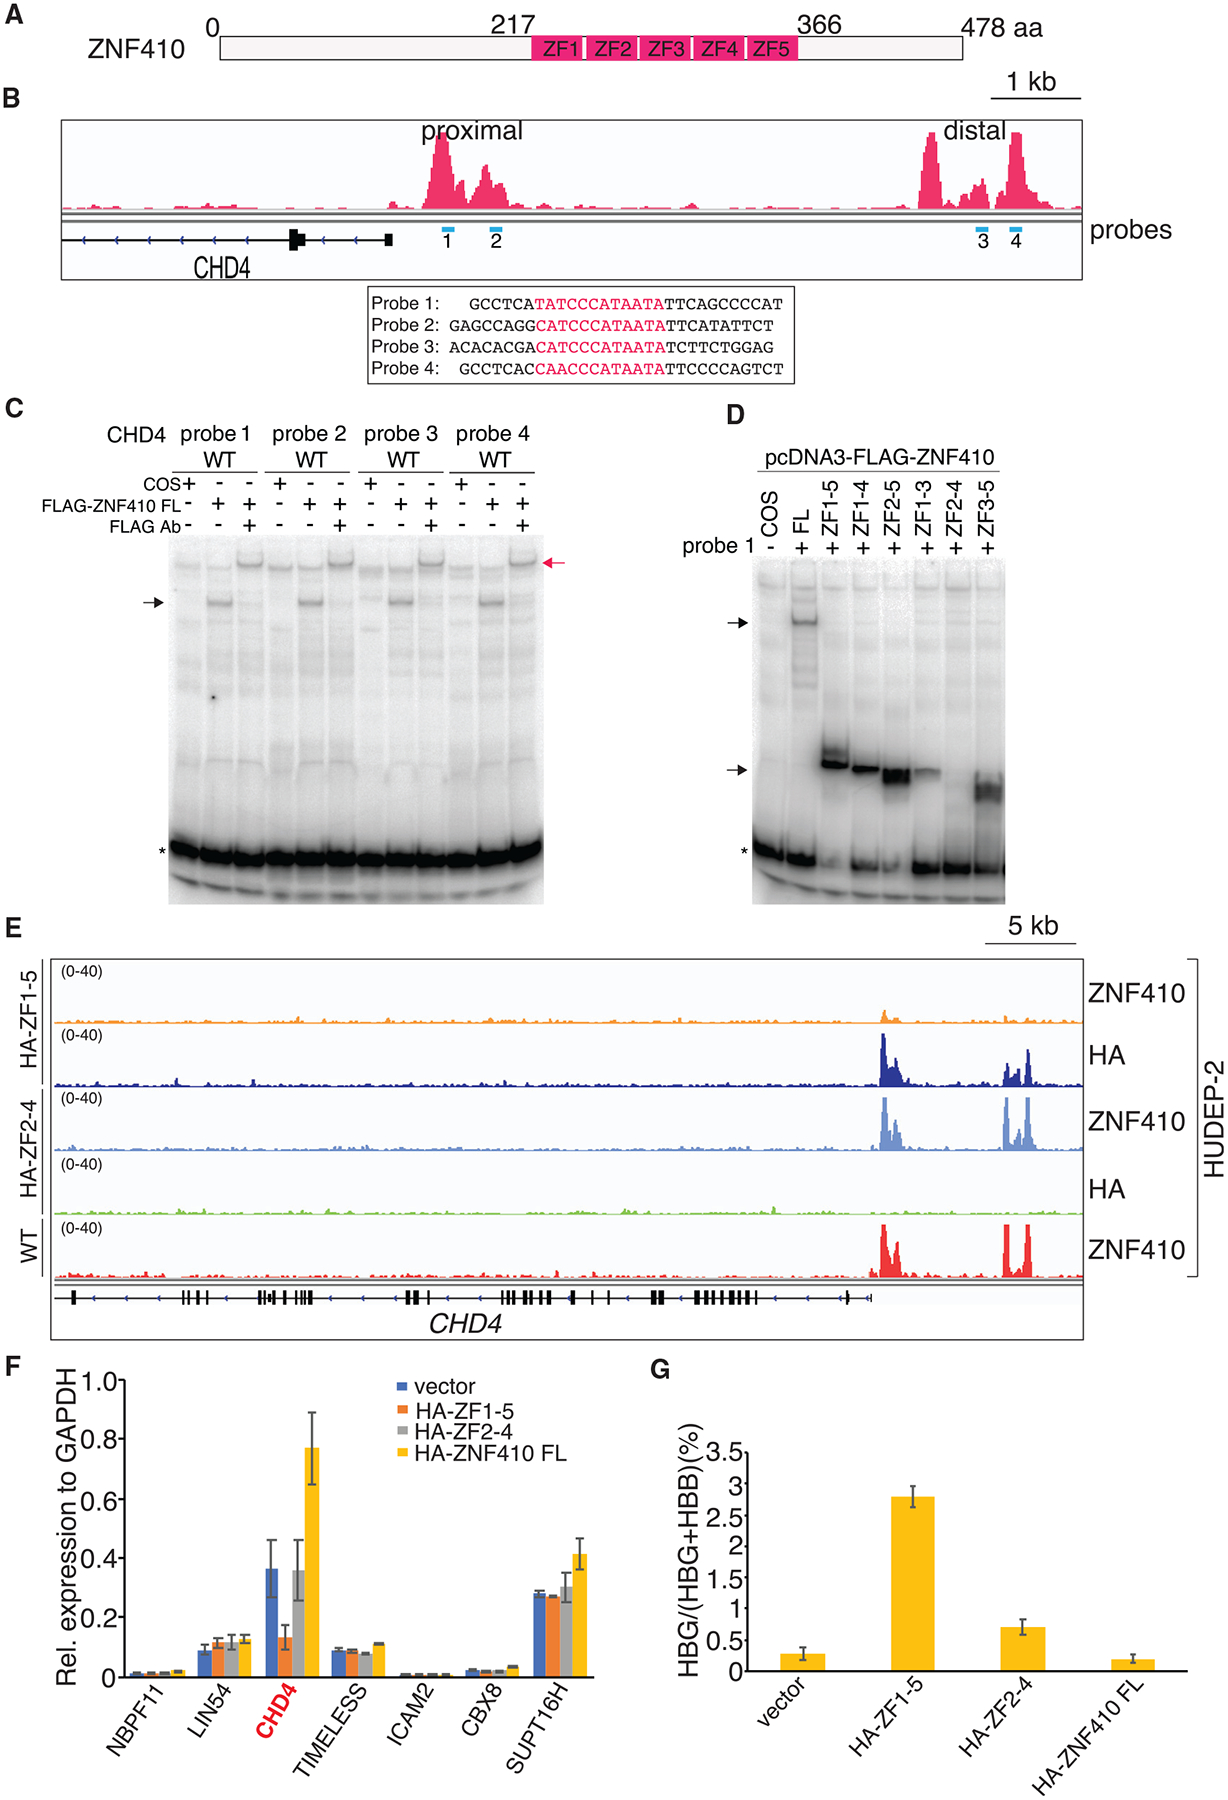
(A) Schematic of human ZNF410. ZNF410 contains 478 amino acids, with five C2H2-type zinc fingers (ZFs) between amino acids 217 and 366.
(B) ZNF410 ChIP-seq track with EMSA probes shown in blue under the peaks and probe sequences shown below. Motifs are highlighted in red.
(C) Full-length (FL) ZNF410 binds to the four motifs from the CHD4 promoter and enhancer sites. Black arrow, ZNF410-probe complex; red arrow, FLAG antibody-ZNF410-probe complex; *, free probes; Ab, antibody; FLAG-ZNF410, N-terminal FLAG-tagged ZNF410.
(D) The ZF domain of ZNF410 and its truncations bind to the motif except ZF2–ZF4. Black arrow, ZNF410 FL, ZF domain, or domain truncation-probe complex.
(E) Brower tracks of endogenous ZNF410, HA ChIP-seq occupancy at the CHD4 locus in wild-type (WT) or HUDEP-2 cells overexpressing HA-ZF1–ZF5 or HA-ZF2–ZF4.
(F) mRNA levels of the 7 ZNF410 bound genes by RT-qPCR in differentiated HUDEP-2 cells with HA-ZF1–ZF5, HA-ZF2–ZF4, or HA-ZF410 FL overexpression. Results are shown as mean ± SD (n = 2).
(G) γ-Globin levels measured by RT-qPCR in differentiated HUDEP-2 cells with HA-ZF1–ZF5, HA-ZF2–ZF4, or HA-ZF410 FL overexpression. Data are plotted as percentage of γ-globin over γ-globin+ β-globin levels. Results are shown as mean ± SD (n = 2).
The domain spanning all five ZFs was sufficient for DNA binding, and like FL ZNF410, displayed a similar binding intensity across the four probes (Figure S6A). Again, addition of anti-FLAG antibody caused a “supershift,” validating the specific interactions between the ZF domain and the probes (Figure S6A). The stronger signal generated by the ZF domain compared with that of FL ZNF410 (Figure 5D) is likely due to the higher expression level of the former (Figure S6B). To assess the contribution to DNA binding by each of the five ZFs, we generated versions containing various ZF combinations (Figure S6B). In EMSA, the central 3 ZFs (ZF2–ZF4) were insufficient for DNA binding; however, when ZF1 or ZF5 was present (ZF1–ZF4 and ZF2–ZF5, respectively), DNA binding was enabled (Figure 5D). Additionally, we observed DNA binding activity, albeit reduced, by ZF1–ZF3 and ZF3–ZF5 (Figure 5D). Thus, the central 3 ZFs (ZF2–ZF4) are insufficient for DNA binding, with a ZF at either end (ZF1 or ZF5) contributing to DNA contacts in this assay. These data support the view that each of the five ZFs of ZNF410 is involved in DNA binding.
According to the EMSAs, the ZF1–ZF5 domain displays strong DNA binding in vitro whereas ZF2–ZF4 does not (Figure 5D). We reasoned that overexpression of ZF1–ZF5, but not ZF2–ZF4, should compete with endogenous ZNF410 for chromatin binding, acting in a dominant-negative manner. To test this hypothesis, we introduced into HUDEP-2 cells, via lentiviral infection, a construct containing HA-tagged ZF1–ZF5 or ZF2–ZF4 driven by the EF1α promoter. As a control, we also forced expression of FL HA-tagged ZNF410. Overexpression of ZF1–ZF5 or ZF2–ZF4 did not influence endogenous ZNF410 expression (Figure S6C). ChIP-seq experiments demonstrated that overexpressed ZF1–ZF5 (roughly 20-fold compared with endogenous ZNF410 protein levels) bound to the CHD4 regulatory regions and to the other ZNF410 targets in a pattern very similar to endogenous ZNF410 (Figures 5E and S6C–S6E). Moreover, FL HA-ZNF410, when overexpressed at levels comparable to HA-ZF1–ZF5 (Figure S6C) also produced similar binding patterns (Figure 4A). This suggests that the ZF domain is sufficient for ZNF410 chromatin occupancy, and that regions outside of this domain contribute little, if anything, to chromatin binding. ZF2–ZF4 displayed no chromatin occupancy at all sites examined, consistent with in vitro DNA binding properties, but with the caveat that it was expressed at lower levels (Figures 5E and S6C–S6E). Accordingly, ZF1–ZF5 markedly interfered with endogenous ZNF410 binding, whereas ZF2–ZF4 was inert (Figures 5E and S6D–S6F). To assess the impact of interference with endogenous ZNF410 chromatin binding on CHD4 expression, we carried out RT-qPCR and found CHD4 mRNA levels to be reduced by approximately 70% compared with the control (Figure 5F), which is comparable to ZNF410 knockout (Figure 3E). In contrast, overexpression of ZF2–ZF4 did not influence CHD4 expression; however, overexpression of FL ZNF410 increased CHD4 expression (Figure 5F). Thus, the ZF region is sufficient for chromatin occupancy but insufficient for CHD4 gene activation. In agreement with the results from ZNF410 depletion experiments, overexpression of ZF1–ZF5 or ZF2–ZF4 did not affect expression of the other 6 ZNF410-bound genes (Figure 5F). Finally, we also measured the effect of ZNF410 expression on γ-globin levels. ZF1–ZF5 expression triggered a significant increase in γ-globin mRNA levels (Figures 5G and S6G), again comparable to that observed in ZNF410-depleted cells, whereas FL ZNF410 expression led to a slight decrease in the already low γ-globin mRNA levels (Figures 5G and S6G). We did note a modest increase in γ-globin mRNA levels upon ZF2–ZF4 expression; the reason for this is unknown. In sum, the ZF domain of ZNF410 is necessary and sufficient to bind to DNA in vitro and in vivo and does not seem to bear any transactivation function on its own.
Structural Basis of ZNF410-DNA Binding
To further gain insight into the molecular basis of how the ZNF410 tandem ZF domain recognizes its targeting DNA sequence, we performed crystallization of the ZNF410-DNA complex. We first quantified the binding affinity of the ZNF410 ZF domain (ZF1–ZF5) with the consensus motif by fluorescence polarization using a purified glutathione S-transferase (GST) fusion protein (Patel et al., 2016). The ZF domain displayed a dissociation constant (KD) of 22 nM for the oligonucleotide containing the consensus motif, whereas there was no measurable binding to the negative control (which shares 7 of 17 bp with the consensus motif) under the same conditions (Figure 6A). Using the same samples, we confirmed that the binding affinity between the ZF domain and the consensus oligonucleotide was between 10 and 20 nM by EMSA (Figure S6H). Next we determined the crystal structure of the ZF domain in complex with the same 17-bp oligonucleotide containing the consensus motif. The structure of the protein-DNA complex was solved by the single-wavelength anomalous diffraction (SAD) method (Hendrickson et al., 1990) at 2.75-Å resolution (Table S5). As in conventional C2H2 ZF proteins (Wolfe et al., 2000), each of five fingers of ZNF410 comprises two strands and a helix, with two histidine residues in the helix together with one cysteine in each strand coordinating a zinc ion, forming a characteristic tetrahedral C2-Zn-H2 structural unit that confers rigidity to the fingers. When bound to DNA, ZF1–ZF5 occupies the DNA major groove, with their α helices toward DNA and the strands and the C2-Zn-H2 units facing out (Figures 6B and 6C). Side chains from specific amino acids within the N-terminal portion of each helix and the preceding loop (i.e., the 7 residues prior to the first Zn-coordinating histidine; Figure 6D) make major groove contacts with primarily three adjacent DNA base pairs, which we call the “triplet element.” The oligonucleotide used for crystallization contains the 15-bp consensus sequence (numbered 1–15 from 5′ to 3′ of the top strand; colored magenta in Figure 6E) recognized by the five fingers, plus one additional base pair on each end of the DNA duplex. The protein sequence runs in the opposite direction of the top strand, from the carboxyl (COOH) to the amino (NH2) terminus, resulting in ZF5 recognizing the 5′ triplet (base pair position 1–3) and the ZF1 recognizing the 3′ triplet (base pair position 13–15) (Figure 6E).
Figure 6. Structural Basis of ZNF410-DNA Binding.
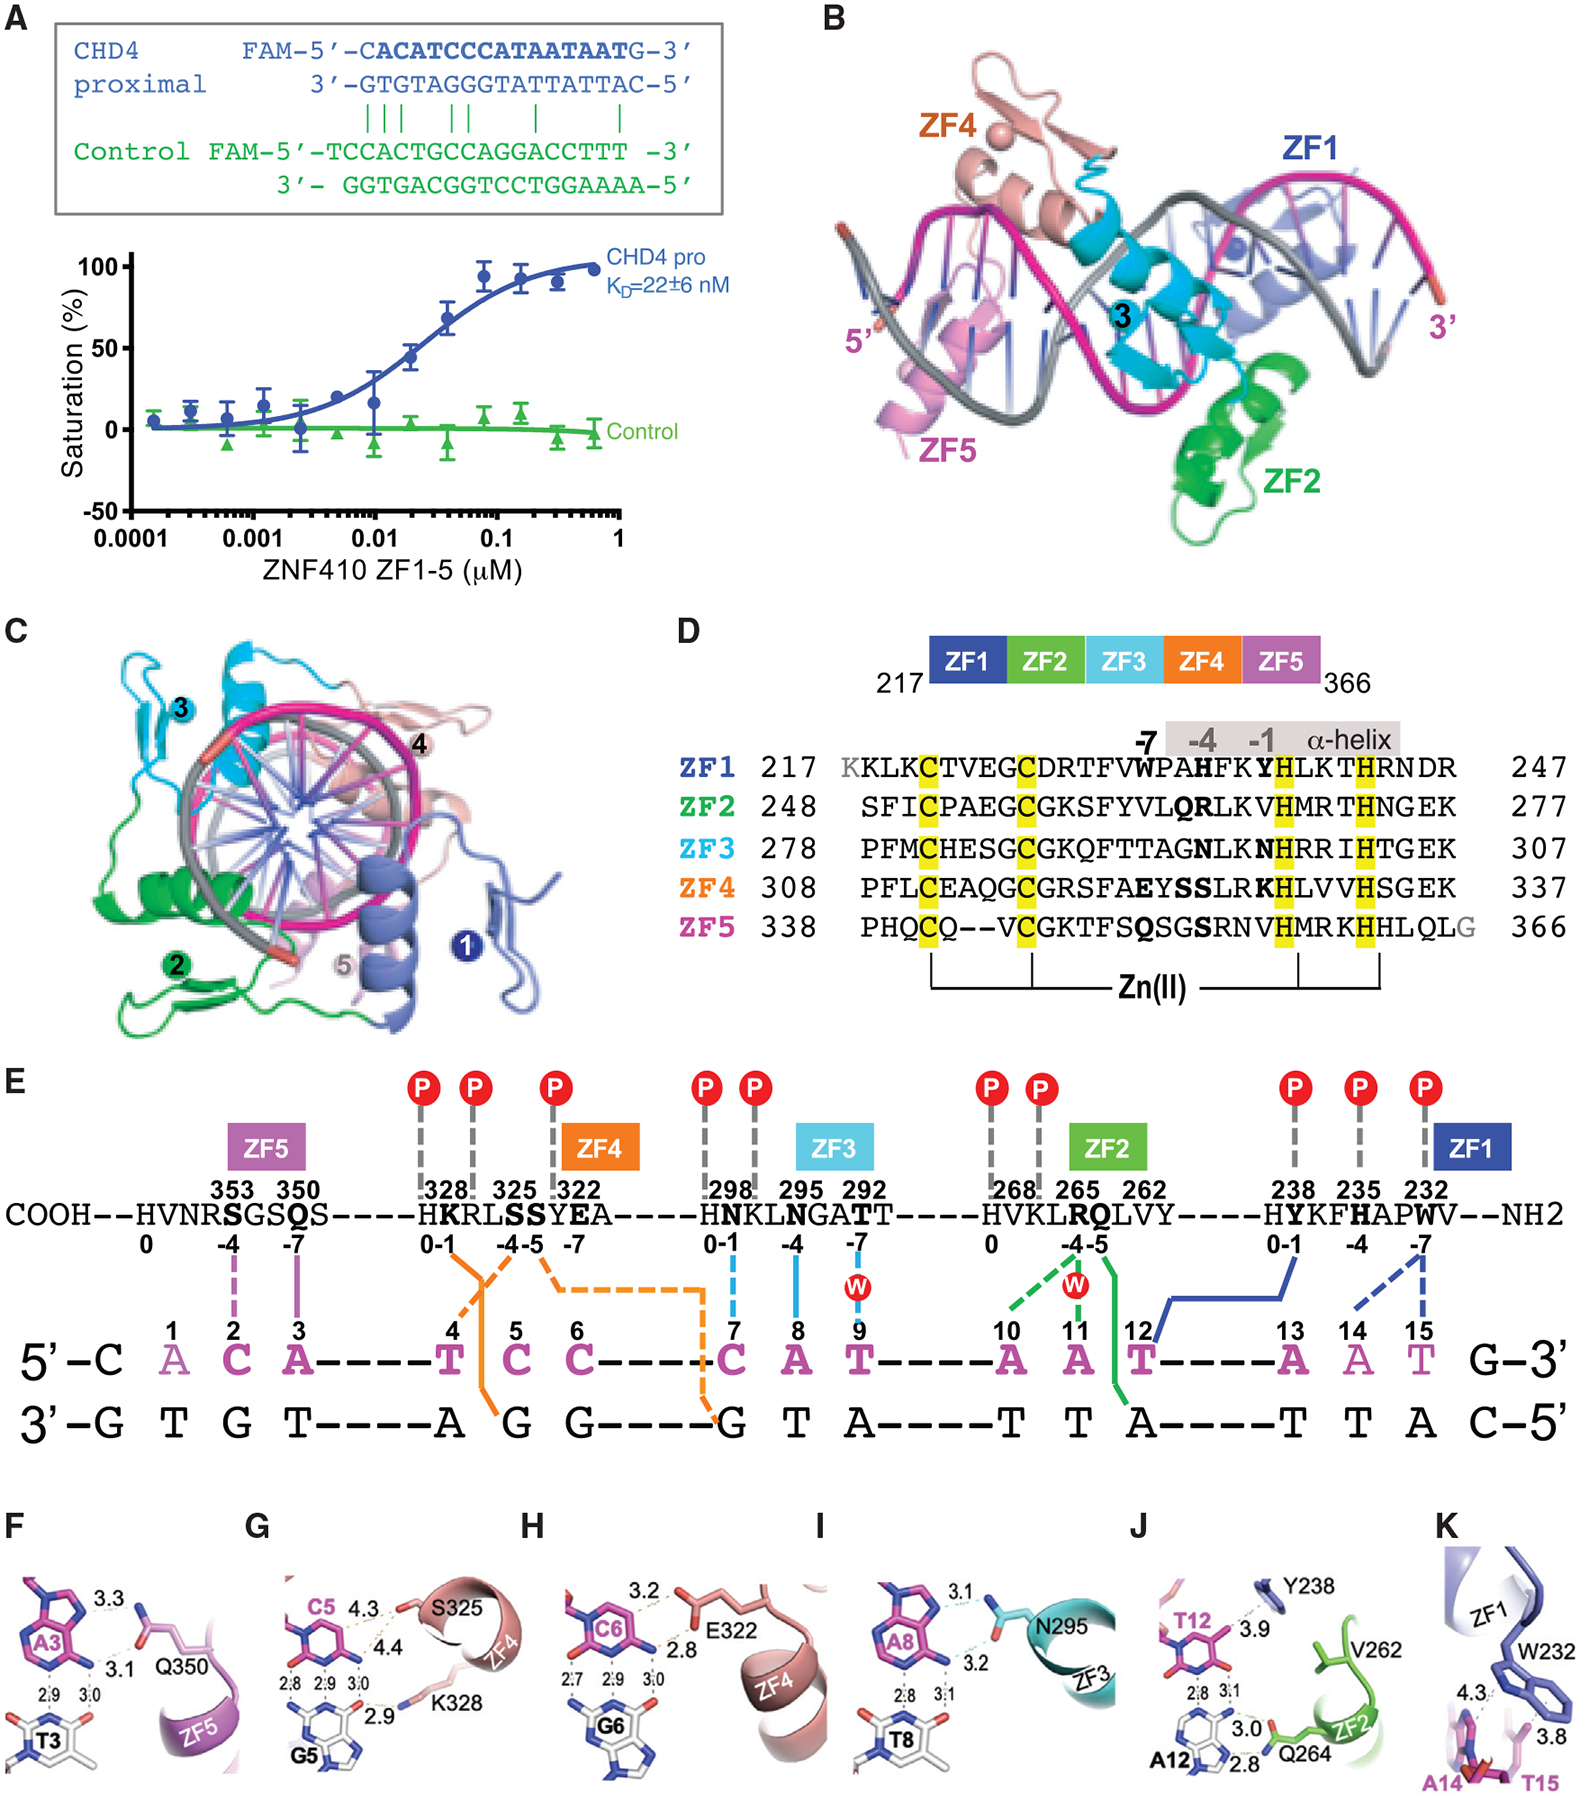
(A) Binding affinity measurements of the ZF domain against oligonucleotides by fluorescence polarization assays. Top: oligos used; x axis, concentration of purified GST-ZF1–ZF5 protein; y axis, percentage of saturation; Pro, promoter.
(B and C) Two ortholog views of a ZNF410 ZF1–ZF5 binding to DNA.
(D) Sequence alignment of the five ZFs of ZNF410 with DNA base-interacting positions −1, −4, and −7 shown in bold. The Zn-coordinating residues C2H2 of each finger are highlighted in yellow.
(E) General scheme of interactions between ZF1–ZF5 and DNA. The top line indicates amino acids of each finger from C to N terminus. The first zinc-coordination His in each finger is referenced as position 0, with residues before this, at sequence positions −1, −4, and −7, corresponding to the 5′-middle-3′ of each DNA triplet element. The bottom two lines indicate the sequence of the double-strand oligonucleotide used for crystallization. The base pairs matching the consensus sequence are numbered 1–15.
(F–K) Examples of base-specific contacts between each ZF and DNA.
(F) Q350 of ZF5 interacts with A3.
(G) S325 and K328 of ZF4 interact with the C:G base pair at position 5.
(H) E322 of ZF4 interacts with C6.
(I) N295 of ZF3 interacts with A8.
(J) Q264 of ZF2 and Y238 of ZF1 interact with the T:A base pair at position 12.
(K) W232 of ZF1 interacts with A14 and T15.
Each ZF contributes to specific DNA interactions. The most dominant direct base-specific interactions observed are the Ade-Gln and Ade-Asn contacts via three fingers; e.g., Q350 of ZF5 interaction with A3 (Figure 6F), N295 of ZF3 interaction with A8 (Figure 6I), and Q264 of ZF2 interaction with A12 (Figure 6J). In accordance with apposition of Gln/Asn with Ade as the most common mechanism for Ade recognition (Luscombe et al., 2001), the side-chain carboxamide moiety of glutamine and asparagine donates an H-bond to the O7 and accepts an H-bond from the N6 atoms of adenines, respectively, a pattern specific to Ade. ZF4 contacts two C:G base pairs at positions 5 and 6. K328 of ZF4 interacts with the O6 atom of G5 (Figure 6G), whereas E322 of ZF4 forms an H-bond with the N4 atom and a C-H⋯O-type H-bond (Horowitz and Trievel, 2012) with the C5 atom of cytosine at position 6 (Figure 6H). In addition, S325 of ZF4 forms a van der Waals contact with cytosine at position 5 (Figure 6G). ZF1 uses two aromatic residues (Tyr238 and Trp232) for interaction with the methyl group of thymine at position 12 and 15, respectively (Figures 6J and 6K). Among the base-specific interactions, the C:G base pair at position 5 and the T:A base pair at position 12 have direct protein interactions with both bases (Figures 6G and 6J). In sum, the base-specific interactions protect 10 bp (positions A3–T12 in Figure 6E) out of the 12-bp consensus sequence (Figure 4C).
In addition to the direct base interactions, the first four fingers (ZF1–ZF4) interact with DNA backbone phosphate groups, whereas ZF5 is devoid of such contact (Figure 6E). ZF2 and ZF3 have water-mediated contacts via R265 of ZF2 and T292 and N298 of ZF3 (Figures S6O, S6Q, and S6S). Arg is the most common mechanism for Gua recognition and Asn for Ade recognition (as shown above) (Luscombe et al., 2001; Patel et al., 2016, 2018). When N298 of ZF3 meets C:G at position 7 and R265 of ZF2 meets A:T at position 11, both side chains of N298 and R265 move away from DNA bases and allow water molecules to diffuse in. N298 forms an H-bond with R301 (Figure S6O), whereas R265 rotates its side-chain guanidine group bridging between two neighboring A10 and A11 (Figures S6R and S6S). Similarly, histidine is the next favorable residue for Gua recognition; when H235 of ZF1 meets an A:T base pair at position 14, H235 simply rotates its side-chain imidazole ring and forms a charge-charge interaction with a backbone phosphate group (Figure S6V). The smaller serine residues of ZF4 and ZF5 have non-specific contacts with C2 (via S353 of ZF5), T4 and C5 (via S325 of ZF4), and G7 (via S324 of ZF4) (Figures S6J, S6L, S6M, and S6O) because serine can act as an H-bond donor and acceptor and might accommodate alternative bases (Patel et al., 2017). Among the five ZFs, ZF5 has the least number of contacts with DNA, whereas ZF1 has only the van der Waals contacts with the bases, and two of them are outside of consensus (nucleotide positions 14 and 15 in Figure 6E). This observation might explain why DNA binding in vitro was still enabled when either outside finger (ZF1 or ZF5), but not both, is removed (Figure 5D). Our structure also revealed that the fingers in the middle (ZF2–ZF4) follow the “one-finger-three base” rule, each involving highly base-specific interactions, whereas the fingers in the ends vary from 2-base (ZF5) to 4-base contacts (ZF1).
DISCUSSION
By leveraging an improved CRISPR-Cas9 screening platform, we identified ZNF410, a pentadactyl ZF protein, as a novel regulator of fetal hemoglobin expression. ZNF410 regulates γ-globin expression through the selective activation of CHD4 transcription. CHD4 appears to be the only direct functional target of ZNF410 in erythroid cells. Two highly conserved clusters of ZNF410 binding sites at the CHD4 proximal and distal regulatory regions that appear to be unique in the human and mouse genomes account for selective accumulation of ZNF410 at the CHD4 locus. In the absence of ZNF410, CHD4 transcription is reduced but not entirely lost, which explains the modest effect on global gene expression and exposes the γ-globin genes as particularly sensitive to CHD4/NuRD levels. In vitro DNA binding assays and crystallography reveal the DNA binding modalities. This study thus illuminates a highly selective transcriptional pathway from ZNF410 to CHD4 to the γ-globin genes in erythroid cells.
Most TFs bind to thousands of genomic sites, of which a significant fraction trigger changes in gene transcription. ZNF410, however, directly activates just one gene in human erythroid cells. This is supported by the following observations. (1) ZNF410 chromatin binding, as measured by ChIP-seq, is only seen at a total of eight regions, with by far the strongest signals occurring in the form of two peak clusters near the CHD4 gene. Failure to detect more ChIP-seq peaks was not a consequence of overlooking potentially bound regions because of mappability issues, such as those presented by repetitive elements, since inclusion of reads that map to multiple locations did not reveal additional binding sites. (2) Clusters of ZNF410 motifs, such as those at the CHD4 locus, are not found elsewhere in the genome. (3) At the non-CHD4 ZNF410-bound sites, signals were not only much weaker but showed little or no signal in murine cells. Hence, ZNF410 chromatin occupancy is conserved only at the CHD4 locus. (4) Among the few ZNF410-bound genes, CHD4 was the only one whose expression was reduced upon ZNF410 loss or upon expression of dominant interfering ZNF410 constructs. (5) Forced expression of CHD4 almost completely restored γ-globin silencing and the transcriptome in ZNF410-deficient cells. This also suggests that indirect, motif-independent binding to chromatin, which might escape detection by ChIP, would not have significant regulatory influence.
When interrogating datasets from 53 tissues, the ZNF410 and CHD4 mRNA levels are highly correlated, suggesting that ZNF410 may be generally limiting for CHD4 expression across tissues and cell lines. Notably, in breast cancer cell lines, ZNF410 and CHD4 are the top co-essential genes, implying that they function in the same pathway (Depmap; https://depmap.org/portal). Loss of ZNF410 does not completely abrogate CHD4 gene transcription. Consequently, the requirement of ZNF410 for CHD4 transcription is not absolute, implicating involvement of other factors in regulation of the CHD4 gene. Whether ZNF410 has additional target genes in other tissues remains to be determined.
We are unaware of other transcriptional activators with single target genes, but there are cases of TFs with only very few target genes. For example, ZFP64 is an 11-ZF protein that binds most strongly to clusters of elements near the MLL gene, reminiscent of the ZNF410 motif clusters at the CHD4 locus (Lu et al., 2018). However, ZFP64 displays thousands of additional high-confidence ChIP-seq peaks even though it regulates only a small fraction of associated genes. The KRAB-ZFP protein Zfp568 is a transcriptional repressor that seems to only silence the expression of the Igf2 gene in embryonic and trophoblast stem cells even though it occupies dozens of additional sites in the genome (Yang et al., 2017). Remarkably, deletion of the Igf2 gene in mice rescues the detrimental effects on gastrulation incurred upon Zfp568 loss, but embryonic lethality persists, implying the presence of additional Zfp568-repressed genes. Extraordinarily high gene selectivity has also been reported for transcriptional co-factors. For example, TRIM33, a cofactor for the myeloid TF PU.1, has been shown to occupy only 31 genomic sites in murine B cell leukemia and appears to preferentially associate with enhancers containing a high density of PU.1 binding sites (Wang et al., 2015). TFs are normally employed at numerous genes, and spatiotemporal specificity is accomplished through combinatorial action with other TFs. However, the number of target genes for TFs and co-factors varies by three orders of magnitude (Database: ENCODE TF Targets). ZNF410 seems to have evolved to require motif clusters such as those found at the CHD4 locus to achieve such high levels of target gene specificity.
What accounts for the high selectivity of ZNF410 chromatin occupancy? (1) The human genome contains 434 perfect ZNF410 motif instances and 3,677 similar ones when adding up all motifs that are found under ZNF410 peaks, which is a much smaller number than for the great majority of TFs (Srivastava and Mahony, 2020). Thus, motif scarcity is likely one determinant of target selectivity but obviously insufficient as the sole explanation. (2) ZNF410 binding site clusters are uniquely found at the CHD4 gene. If ZNF410 requires a cooperative mechanism for chromatin binding, then this may explain lack of binding to the majority of single motifs. (3) The weak ZNF410 binding that is found at 6 sites containing a single motif is accompanied by the presence of active histone marks and signatures of open chromatin. It is possible that, when exposed, single motifs might allow access to ZNF410 even when it is functionally inconsequential. Indeed, ZNF410 depletion or the dominant interfering ZNF410 version elicited no transcriptional changes of the 6 ZNF410-bound genes with a single motif.
The ZF domain of ZNF410 is necessary and sufficient for DNA binding in vitro and in vivo. Crystallographic analysis of the ZF domain bound to DNA revealed a binding mode where ZF1–ZF5 contact the consensus sequence in a 3′ to 5′ orientation with all five ZFs contacting DNA. EMSA experiments suggest, however, that four ZFs (ZF1–ZF4 or ZF2–ZF5) are needed for efficient binding. Whether ZNF410 versions with fewer ZFs can achieve similar chromatin occupancy patterns as wild-type ZNF410 will be interesting to investigate in future experiments. Fluorescence polarization experiments measured the ZF domain-DNA interaction KD at 22 nM. However, this high-affinity interaction appears to be insufficient to enable chromatin occupancy at virtually all single elements in the genome. Hence, the clustering of motifs may be required to convey efficient and high-level chromatin binding. The molecular basis for binding co-operativity is unclear. Because the ZF domain displays no activation function on its own and, therefore, might not interact with co-activator complexes, binding cooperativity might derive from the inherently synergistic effects of DNA binding domains when displacing histone-DNA interactions in nucleosomes (Adams and Workman, 1995; Oliviero and Struhl, 1991; Polach and Widom, 1996). Whether the spacing of the ZNF410 motifs allows such synergistic behavior remains to be tested.
When overexpressed, the ZF domain acted in a dominant interfering manner by displacing endogenous ZNF410 from the CHD4 locus. The resulting reduction in CHD4 transcription was ~65%–70%, comparable with that observed upon ZNF410 knockout. Expression of the 6 other ZNF410-bound genes was unaffected, again illustrating ZNF410 specificity. One implication of this finding is that the transactivation function of ZNF410 resides outside of the ZF domain and that, by inference, the ZF domain may not be involved in co-activator recruitment. This contrasts with other ZF TFs, such as GATA1, where the ZF region can be multifunctional and not only bind DNA but also critical co-regulators (Campbell et al., 2013). Finally, according to our ChIP-seq experiments, the ZF domain binding profiles are very similar to FL ZNF410, suggesting that ZNF410 chromatin binding specificity and affinity are determined solely by the ZF domain and that other domains and associated cofactors contribute little, if at all, to ZNF410 binding.
Sequence variants at binding sites for the γ-globin repressors BCL11A and LRF (ZBTB7A) are linked to persistence of γ-globin expression into adulthood (Liu et al., 2018; Martyn et al., 2018). We interrogated genome-wide association study (GWAS) central databases as well as a sequencing database we generated (unpublished data) for SNPs within the CHD4 regulatory regions that might be linked to elevated HbF levels but found none. Given the large number of ZNF410 elements at the CHD4 locus, multiple elements would need to be lost to significantly affect CHD4 transcription. It is thus possible that motif clustering at the CHD4 locus provides robustness for the maintenance of CHD4 expression.
Complete CHD4 loss severely compromises hematopoiesis and erythroid cell growth (Sher et al., 2019; Xu et al., 2013; Yoshida et al., 2008). However, depletion of ZNF410 is well tolerated in erythroid cells and other hematopoietic lineages, which is likely due to the fact that CHD4 is not completely extinguished. This partial CHD4 reduction was sufficient to robustly de-repress the γ-globin genes, consistent with a prior study (Amaya et al., 2013). Notably, given the very limited global transcriptional changes upon ZNF410 depletion, this suggests that the γ-globin genes are especially sensitive to CHD4/NuRD levels.
In sum, we identified ZNF410 as a highly specific regulator of CHD4 expression and γ-globin silencing. It might be possible to exploit this high transcriptional selectivity and target ZNF410 to raise fetal hemoglobin expression for treatment of hemoglobinopathies.
Limitations
When scanning the human genome for ZNF410 motif clusters, such as those found at the CHD4 gene, we used the consensus sequence derived from the 8 ChIP-seq peaks. This failed to identify any additional motif clusters. However, considering that there are numerous possible sequence variants of the ZNF410 motif, we cannot rule out with certainty that other clusters exist that contain combinations of such variants.
ChIP using antibodies against endogenous ZNF410 as well as antibodies against a tagged version of ZNF410 revealed only 8 peaks. However, it remains possible that additional ZNF410-occupied sites might be missed when chromatin binding occurs indirectly via association with another DNA-binding protein. Such indirect interactions can escape detection by ChIP because of less efficient crosslinking, lower binding affinity, or increased sensitivity to sonication.
When examining the correlations between ZNF410 binding and histone acetylation levels (H3K27ac) and ATAC signal intensities, we were limited by the low number of ZNF410 peaks. Therefore, the correlations we did observe are limited in their statistical power.
NBSGW mice are a powerful system to study human erythropoiesis in a whole-animal model. However, it remains possible that differences between this model and normal human erythropoiesis might affect the interpretation of our results.
EMSAs, or gel shifts, are useful for comparing DNA binding by different truncation mutations but rest on the assumption that such truncations or deletions do not alter the overall folding of the protein. When considering arrays of ZFs, when positive binding is observed, the assumption is usually reasonable. The assays also depend on exact buffer and temperature conditions. Again, when binding is observed, comparisons of mutants are usually reliable but it is possible for mutants to have different solubility or behavior in different buffers.
Our current structural work is limited to the DNA binding domain. It will be essential to understand the protein conformation of FL ZNF410 and whether domains outside of the ZF domain affect the structure and DNA binding of the ZF domain.
STAR★METHODS
RESOURCE AVAILABILITY
Lead Contact
Requests for further information, resources, and reagents should be directed to and will be fulfilled by the Lead Contact, Gerd A. Blobel (blobel@email.chop.edu).
Materials Availability
All plasmids, cell lines, and reagents generated in this study are available from the Lead Contact with a completed Materials Transfer Agreement.
Data and Code Availability
The X-ray structures (coordinates and structure factor files) of the ZNF410 ZF domain with bound DNA have been submitted to PDB:::6WMI.
The RNA-seq and ChIP-seq data have been deposited to the GEO database :GSE154963. Original immunoblot data and microscopic images have been deposited to Mendeley Data: https://doi.org/10.17632/xhzk993nhh.1
EXPERIMENTAL MODEL AND SUBJECT DETAILS
Mouse Models
All animal procedures and studies were approved by the St. Jude Children’s Research Hospital Animal Care and Use committee in accordance with IACUC rules and regulations.
Cell lines
HUDEP-2 cells were cultured and differentiated as described (Kurita et al., 2013). Briefly, StemSpan SFEM supplemented with 50ng/ml human SCF, 10 μM dexamethasone, 1 μg/ml doxycycline, 3IU/ml erythropoietin and 1% penicillin/streptomycin was utilized for routine cell maintenance. Cell density was kept at 0.1–1×10^6/ml. HUDEP-2 cells were differentiated for 6–7 days in IMDM supplemented with 50ng/ml human SCF, 3IU/ml erythropoietin, 2.5% fetal bovine serum, 250 μg/ml holo-transferrin, 10ng/ml heparin, 10 μg/ml insulin, 1 μg/ml doxycycline and 1% penicillin/streptomycin.
Primary human CD34+ HSPCs from mobilized peripheral blood were purchased from the Fred Hutchinson Cancer Research Center. Human CD34+ HSPCs were differentiated using a three-phase culture system as described (Grevet et al., 2018). Briefly, IMDM supplemented with 3IU/ml erythropoietin, 2.5% human male AB serum, 10ng/ml heparin, and 10 μg/ml insulin was used as base medium. For phase I medium, 100ng/ml human SCF, 5ng/ml IL-3, and 250 μg/ml holo-transferrin were supplemented. For phase II medium, 100ng/ml human SCF and 250 μg/ml holo-transferrin were added. For phase III medium, 1.25mg/ml holo-transferrin was supplemented.
HEK293T cells were grown in DMEM supplemented with 10% fetal bovine serum, 2% penicillin/streptomycin, 1% L-glutamine and 100 μM sodium pyruvate according to standard protocol.
G1E-ER4 cells is a sub-line of G1E cells, (derived from GATA1 KO murine embryonic stem cells (Weiss et al., 1997)), which expresses GATA1 fused to the ligand binding domain of the estrogen receptor (GATA1-ER) (Weiss et al., 1997). GATA1 activation and erythroid differentiation are induced by the addition of 100 nM estradiol to the media for 24 hours. Cells were cultured in IMDM supplemented with 15% FBS, 1% penicillin/streptomycin, Kit ligand, monothioglycerol and erythropoietin.
COS-7 cells were cultured in DMEM supplemented with 10% fetal bovine serum and 1% penicillin-streptomycin-glutamine (PSG). For passage, adherent cells were dislodged after a 2-min incubation at 37°C with PBS-EDTA (5 mM).
METHOD DETAILS
Vector construction
SgRNAs were cloned into a lentiviral U6-sgRNA-EFS-GFP/mCherry expression vector (LRG, Addgene: #65656) by BsmBI digestion. The ZNF410 cDNA (clone ID: OHu10535), CHD4 cDNA (clone ID: OHu28780) were purchased from GenScript and were sub-cloned into a lentiviral vector pSDM101-IRES-GFP (from Dr. Patrick Grant lab). ZNF410 variants were sub-cloned into pSDM101-IRES-GFP vector. The N-terminal HA tag was introduced by PCR. For EMSA, the ZNF410 full length or different ZF versions were sub-cloned into mammalian expression vector pcDNA3.
Lentiviral transduction
Lentivirus was produced as described (Grevet et al., 2018). Briefly, 10–20 ug of expression vectors, 5–10ug of pVSVG (pMD2.G) and 7.5–15 ug of psPAX2 package plasmids, and 80 ul of 1 mg/ml polyethylenimine (PEI) were mixed, incubated for 15–20 mins and added to HEK293T cells grown in 10 cm plates to above 90% confluence. Media were replaced 6–8 hr post transfection, virus was collected 24 hours and 48 hours post-transfection and pooled. For infection, virus-containing supernatant was mixed with the indicated cell lines with 8 ug/ml polybrene and 10 mM HEPES, and then spun at 2250 rpm for 1.5 hr at room temperature.
Infected HUDEP-2 cells were selected for mCherry+ or GFP+ cell sorting at 48 hours post-infection.
RNP electroporation
Commercial sgRNAs were purchased from IDT or Synthego. To assemble the RNP complexes, 100 pmol sgRNA and 50 pmol SpCas9 protein (from IDT) were incubated at room temperature for 15 mins. CD34+ HSPCs (50k-100k) at Day 3–4 of phase I culture were electroporated using P3 Primary Cell 4D NucleofectorTM X Kit (from Lonza) with the program DZ100 (Bak et al., 2018).
RT-qPCR
Total RNA was purified using the RNeasy Plus Mini Kit (QIAGEN), including an on-column DNase treatment using RNase-free DNase set (QIAGEN) to remove genomic DNA. Reverse transcription was accomplished using iScript Supermix (Bio-Rad). qPCR reactions were prepared with Power SYBR Green (ThermoFisher Scientific). Quantification was performed using the ΔΔCT method. Primers used for RT-qPCR are listed in Table S2.
COS cell transfections and nuclear extractions
Nuclear extracts were prepared from COS-7 cells transiently transfected with ZNF410 full-length and ZNF410 ZF1–5 plasmids. Fu-gene 6 (Promega) was used to transfect 5 μg of vector into 100 mm plates of COS-7 cells. A pcDNA3 empty vector was used as control. Cells were harvested 48 h after transfection and nuclear extracts prepared as previously described (Andrews and Faller, 1991).
In vivo transplantation of CD34+ HSPCs
Xenotransplantation experiments were carried out as previously described (Métais et al., 2019). Briefly, ZNF410 edited or control CD34+ HSPCs were administered at a dose of 0.4 million per NBSGW mouse (The Jackson Laboratory) by tail-vain injection at aged 8–12 weeks. Chimerism post-transplantation was assessed by flow analysis at 8 weeks in the periphery and at 16 weeks in the bone marrow at the time of euthanasia. Cell linage composition was determined in the bone marrow using human-specific antibodies, and different lineages were sorted by a FACSAria III cell sorter. CD34+ HSPCs were isolated with magnetic beads using the human-specific CD34 MicroBead Kit UltraPure, human (Miltenyi Biotec Inc).
Indel analysis
Next-generation sequencing (NGS) was used for indel analysis as previously described (Métais et al., 2019). Briefly, NGS libraries were prepared with a 2-step PCR protocol. In the first step, the targeted genomic sites were amplified by PCR with Phusion Hot Start Flew 2x Master Mix (New England BioLabs) and primers with partial Illumina sequencing adaptors. In the second step, PCR was performed with a KAPA HiFi HotStart ReadyMix PCR Kit (Roche) to add Illumina sequencing adapters (P5-dual-index and P7-dual-index) to the purified PCR product from the first step. The Illumina MiSeq platform was used to generate FASTQ sequences with 150 bp paired-end reads, and these reads were analyzed by joining paired reads and analyzing amplicons, using CRISPResso for indel measurement.
EMSAs
EMSAs were carried out as described (Crossley et al., 1996). The sense oligonucleotide was labeled with [γ-32P]-adenosine triphosphate (Perkin Elmer) and boiled at 100°C for 1 min before addition of the antisense oligonucleotide and annealing of probe via slow cooling from 100°C to room temperature. Probes were purified using Quick Spin Columns for radio-labeled DNA Purification (Roche). Nuclear extracts were harvested from COS-7 cells and samples and loaded on a 6% native polyacrylamide gel in TBE buffer (45 mM Tris, 45 mM boric acid, 1 mM EDTA). A ‘COS empty’ control lane was included to show binding of any background endogenous protein to the probe. Recognition and super-shifting of FLAG-ZNF410 overexpression constructs was achieved with an anti-FLAG monoclonal antibody (Sigma). Gels were run at 250 V for 1h 45 min at 4°C then dried under vacuum. Gels were exposed overnight with a FUJIFILM BAS CASETTE2 2025 phosphor screen and imaged using the Typhoon FLA 9500 Laser Scanner.
HbF staining and flow cytometry
Briefly, 2–5 million cells were fixed in 0.05% glutaraldehyde for 10min, washed 3 times with 1xPBS/0.1%BSA, and permeabilized with 0.1% Triton X-100 for 5 minutes. After one wash with PBS/0.1% BSA, cells were stained with HbF-APC conjugate antibody for 15–30 minutes in the dark at room temperature. Cells were washed twice with PBS/0.1%BSA. Flow cytometry was carried out on a BD FACSCanto and cell sorting on a BD FACSJazz at the Children’s Hospital of Philadelphia flow cytometry core.
CRISPR sgRNA library generation and screen
SgRNA library targeting human transcription factors and the screening protocol were performed as described previously (Huang et al., 2020; Grevet et al., 2018). Briefly, HUDEP2-Cas9 cells were transduced with the transcription factor library at a low multiplicity of infection (MOI 0.3–0.5). ~30 million cells were infected in total to yield 1000x coverage of the sgRNA library in the GFP+ population. Transduced cells were sorted by GFP+ FACS on day 2 post-infection. Transduced cells were cultured in HUDEP2 media for an additional 6 days (total 8 days post-infection). On day 8 post-infection, cells were switched to differentiation media and cultured for 7 days. On day 15 post-infection, cells were stained for HbF, and sorted into HbF high and HbF low populations (see Figure 1A).
Genomic DNA was extracted from these samples by phenol/chloroform extractions per standard methods. sgRNAs were amplified with Phusion Flash High Fidelity Master Mix Polymerase per manufacturer specifications. PCR reactions were then pooled for each sample and column purified with QIAGEN PCR purification kit. PCR products were subjected to Illumina MiSeq library construction and sequencing. sgRNA library concentrations were quantified on a 2100 Bioanalyzer (Agilent). The barcoded libraries were pooled at an equal molar ratio and subjected to massively parallel sequencing through a MiSeq instrument (Illumina) using 75-bp paired-end sequencing (MiSeq Reagent Kit v3; Illumina MS-102-3001).
The sequencing data were de-barcoded and trimmed to contain only the sgRNA sequence, and subsequently mapped to the reference sgRNA library without allowing any mismatches. The read counts were calculated for each individual sgRNA and normalized to total read counts. Normalized read counts of sgRNAs in HbF high and HbF low populations were log2 transformed in RStudio software.
Immunoblot analysis
Cells were lysed in RIPA buffer containing protease inhibitors (Sigma) and PMSF for 20–30 mins on ice. Cell lysates were mixed with 5x Lammli sample buffer, and then boiled at 95 degree for 5–10 mins. ~15–30 μg whole cell lysates per sample were loaded on NuPAGE 4%–12% Bis-Tris protein Gels (Thermofisher). After transfer, nitrocellulose membrane was first blocked by 5% nonfat milk in TBST, and incubated with primary antibody in 5% milk at 4°C overnight. Membranes were washed 3 times with 1xTBST, followed by incubation with secondary antibody for 1 hour at room temperature, and then incubated with chemiluminescent HRP substrate (Thermofisher).
RNA-Seq
Total RNAs were purified as described above. Sequencing libraries were then constructed using 100 ng of purified total RNA using the ScriptSeq Complete Kit (Illumina cat# BHMR1224) according to manufacturer’s protocol. RNA was subjected to rRNA depletion using the Ribo-Zero removal reagents and fragmented. First strand cDNA was synthesized using a 5′ tagged random hexamer, and reversely transcribed, followed by annealing of a 5′ tagged, 3′ end blocked terminal-tagged oligo for second strand synthesis. The Di-tagged cDNA fragments were purified, barcoded, and PCR-amplified for 15 cycles.
The size and quality of each library were evaluated by Bioanalyzer 2100 (Agilent Techniologies, Santa Clara, CA), and quantified using qPCR. Libraries were sequenced in paired-end mode on a NextSeq 500 instrument to generate 2 × 76 bp reads using Illumina-supplied kits. The sequence reads were processed using the ENCODE3 long RNA-seq pipeline (https://www.encodeproject.org/pipelines/ENCPL002LPE/). In brief, reads were mapped to the human genome (hg38 assembly) using STAR, followed by RSEM for gene quantifications.
RNA-Seq data analysis
The normalized FPKM (fragments per kilo base per million mapped reads) for each gene was averaged in 2 replicates and then filtered to keep those with average FPKM at least 10 in both HUDEP-2 cells and primary erythroblasts, resulting in ~5000 high abundant genes each cell type for further analysis. Log2 fold-change was calculated from FPKM of sgRNA targeting ZNF410 compared to control sgRNA (non-targeting sgRNA) using the DESeq2 method, and top changed genes were selected with fold-change at least 1.5 and p value < 0.05. Commonly changed genes in both independent sgRNAs were considered to be significant. Scatterplots were generated using ggplot2 in RStudio for all expressed genes (FPKM > 5).
ChIP-seq
HUDEP-2 cells at Day 3 of differentiation, primary human CD34+ cells at Day 9 differentiation (similar to the polychromatic stage) and G1E-ER4 cells at 24 hours differentiation were crosslinked with 1% formaldehyde at room temperature for 10 min and quenched by the addition of glycine. ChIP experiments were performed as described (Hsu et al., 2017). ZNF410 (Proteintech, Cat. # 14529-1-AP), HA (Sigma, Cat. # 11815016001) and H3K27ac (Abcam, Cat. # ab4729) antibodies were used for ChIP. ChIP-seq libraries were prepared using TruSeq ChIP-seq Sample preparation Kit (part# IP-202-1012) according to the manufacturer’s instructions. Reads were aligned with Bowtie2 local alignment to allow the mapping of indels (Langmead and Salzberg, 2012). All ChIP-seq experiments were performed in two biological replicates. ChIP-qPCR was performed with Power SYBR Green (ThermoFisher).
ZNF410 ChIP-Peak calling and de novo motif analysis
Reads were aligned against reference genome hg38 for human and genome mm10 for mouse using Bowtie2 (v2.2.9) and the default parameters. Alignments with MAPQ score lower than 10 and PCR duplicates were removed using Samtools (v0.1.19). Reads aligned to mitochondria, random contigs and ENCODE blacklisted regions were also removed for downstream analysis. Genome coverage files were generated and normalized to 1 million reads per library using bedtools (v2.25.0), and then converted to bigwig format for visualization using the UCSC Toolkit. Peaks were called using MACS2 (v2.1.0) and a 0.05 q-value cutoff. The final peaks were those overlapped by both ZNF410 replicates but not in control replicates (empty vector and knock-out samples), then manually filtered to exclude peaks near centromere/telomere regions that did not look like peaks on genome browser (total number reduced from 38 to 8). The final peaks were extended by 1kb on both ends for de novo motif analysis using the HOMER tool, and the top hit motif was scanned across the entire genome using HOMER. We also scanned the human and mouse genome for motif pattern of CATCCCATAATA and other similar motifs using EMBOSS fuzznuc (v6.5.7.0). Read density plot and heatmap around selected peaks were generated using Deeptools (version 2.5.7, “computeMatrix” and “plotHeatmap”).
HPLC
~1 million primary erythroblasts (at the orthochromatic stage) were lysed in water for 10 mins, vertex 10 s every 5 mins at RT. Hemolysates were then cleared by centrifugation at 15,000 rpm, 10 mins and analyzed for identity and levels of hemoglobin variants (HbF and HbA) by cation-exchange high-performance liquid chromatography (HPLC). Hitachi D-7000 Series (Hitachi Instruments, Inc., San Jose, CA), and weak cation-exchange column (Poly CAT A: 35 mm × 4.6 mm, Poly LC, Inc., Columbia, MD) were used. Hemoglobin isotype peaks were eluted with a linear gradient of phase B from 0% to 80% at A410nm (Mobile Phase A: 20 mM Bis-Tris, 2 mM KCN, pH 6.95; Phase B:20 mM Bis-Tris, 2 mM KCN, 0.2 M sodium chloride, pH 6.55). Cleared lysates from normal human cord blood samples (high HbF content), as well as a commercial standard containing approximately equal amounts of HbF, A, S and C (Helena Laboratories, Beaumont, TX), were utilized as reference isotypes.
Wright-Giemsa staining
~100,000 cells were spun onto glass slides with Cytospin4 (ThermoFisher Scientific) at 1,200rpm for 3 min. Slides were allowed to dry for 5 minutes at RT, followed by staining with May Grünwald (Sigma Aldrich) for 2 minutes and then by 1:20 diluted Giemsa stain (Sigma Aldrich) for 10 minutes. The stained slides were rinsed twice in water and then allowed to dry for 10 minutes before a coverslip was sealed on the preparation with Cytoseal 60 (Thermo Scientific). The images were captured with Olympus BX60 microscope at 10X resolution using Infinity software (Lumenera corporation).
Protein expression and purification
The fragment of Human ZNF410 (NP_001229855.1) comprising of five zinc finger domains ZF1–5 (residues 217–366) was cloned into pGEX-6P-1 vector with a GST fusion tag (pXC2180). The plasmid was transformed into Escherichia coli strain BL21-Codon-plus(DE3)-RIL (Stratagene). Bacteria was grown in LB broth in a shaker at 37°C until reaching the log phase (A600nm between 0.4 and 0.5), the shaker temperature was then set to 16°C and 25 μM ZnCl2 was added to the cell culture. When the shaker temperature reached 16°C and A600nm reached ~0.8, the protein expression was induced by the addition of 0.2 mM isopropyl-β-D-thiogalactopyranoside with subsequent growth for 20 h at 16°C. Cell harvesting and protein purification were carried out at 4°C through a three-column chromatography protocol (Patel et al., 2016), conducted in a BIO-RAD NGC™ system. Cells were collected by centrifugation and pellet was suspended in the lysis buffer consisting of 20 mM Tris-HCl, pH 7.5, 500 mM NaCl, 5% glycerol, 0.5 mM tris(2-carboxyethl)phosphine (TCEP) and 25 μM ZnCl2. Cells were lysed by sonication and 0.3% (w/v) polyethylenimine was slowly titrated into the cell lysate before centrifugation (Patel et al., 2016). Cell debris was removed by centrifugation for 30 min at 47,000 xg and the supernatant was loaded onto a 5 mL GSTrap column (GE Healthcare). The resin was washed by the lysis buffer and bound protein was eluted with elution buffer of 100 mM Tris-HCl, pH 8.0, 500 mM NaCl, 5% glycerol, 0.5 mM TCEP and 20 mM reduced form glutathione. The GST fusion were digested with PreScission protease (produced in-house) to remove the GST fusion tag. The cleaved protein was loaded onto a 5 mL Heparin column (GE Healthcare). The protein was eluted by a NaCl gradient from 0.25 to 1 M in 20 mM Tris-HCl, pH 7.5, 5% glycerol and 0.5 mM TCEP. The peak fractions were pooled, concentrated and loaded onto a HiLoad 16/60 Superdex S200 column (GE Healthcare) equilibrated with 20 mM Tris-HCl, pH 7.5, 250 mM NaCl, 5% glycerol and 0.5 mM TCEP. The protein was frozen and stored at −80°C.
DNA binding assays
Fluorescence polarization (FP) method was used to measure the binding affinity using a Synergy 4 Microplate Reader (BioTek). Aliquots (5 nM) of 6-carboxy-fluorescein (FAM)-labeled DNA duplex (FAM-5′-CACA TCC CAT AAT AATG-3′ and 3′-GTGT AGG GTA TTA TTAC-5′) and control (FAM-5′-TCC ACT GCC AGG ACC TTT-3′ and 3′-GGT GAC GGT CCT GGA AAA-5′) was incubated with varied amount of proteins (0 to 2.5 μM) in 20 mM Tris-HCl, pH 7.5, 300 mM NaCl, 5% glycerol and 0.5 mM TCEP for 10 min at room temperature. The data were processed using Graphpad Prism (version 8.0) with equation [mP] = [maximum mP] × [C] / (KD +[C]) + [baseline mP], in which mP is millipolarization and [C] is protein concentration. The KD value for each protein–DNA interaction was derived from two replicated experiments.
Electrophoretic mobility shift assay (EMSA) was performed with the same set of samples used in the FP assay for 10min at room temperature. Aliquots of 10 μL of reactions were loaded onto an 8% native 1x TBE polyacrylamide gel and run at 150V for 20 min in 0.5x TBE buffer. The gel was imaged using a ChemiDoc Imaging System (BIO-RAD).
Crystallography
The ZF-DNA complex was prepared by mixing 0.9 mM ZF1-5 fragment and double-stranded DNA oligo (annealed in buffer containing 10 mM Tris-HCl, pH 7.5, and 50 mM NaCl) with molar ratio 1:1.2 of protein to DNA on ice for 30 min incubation. The protein-DNA complex crystals were grown using the sitting drop vapor diffusion method via an Art Robbins Gryphon Crystallization Robot at 19°C with a well solution of 0.2 M ammonium formate and 20% polyethylene glycol 3350. Crystals were flash frozen using 20% (v/v) ethylene glycol as the cryo-protectant. The X-ray diffraction data were collected at SER-CAT 22-ID beamline of the Advanced Photon Source at Argonne National Laboratory utilizing a X-ray beam at 1.0 Å wavelength and processed by HKL2000 keeping Friedel mates separate (Otwinowski et al., 2003).
The resultant dataset for ab initio phasing was examined using the PHENIX Xtriage module (Adams et al., 2002) which reported a very good anomalous signal to 5.6 Å. The PHENIX AutoSol module (Terwilliger et al., 2009) identified the space group being P62 and found all 10 zinc atom positions (5 per each of two molecules in asymmetric unit) with a Figure-Of-Merit of 0.48 and gave a density modified map with an R-factor of 0.34 at 5 Å data. Insertion of these zinc positions into AutoSol and utilizing the full resolution of the dataset gave a Figure-Of-Merit of 0.28 and a density modified map with an R-factor of 0.34. DNA duplex and zinc fingers bound in the major groove could easily be identified for the resultant map. The AutoBuild module of PHENIX was utilized for model building, and manual fitting of the protein and the DNA duplex was completed with COOT (Emsley and Cowtan, 2004), which was also utilized for corrections between PHENIX refinement rounds. Structure quality was analyzed during PHENIX refinements and finally validated by the PDB validation server. Molecular graphics were generated by using PyMol (Schrödinger, LLC).
QUANTIFICATION AND STATISTICAL ANALYSIS
ImageJ software was used for the quantification of immunoblots.
Statistical calculations were done using Prism (GraphPad). Unpaired two-tailed Student’s t test was used to determine statistical significance as indicated in the figure legends. All experiments were performed at least twice (biological replicates) unless otherwise indicated, and p values and samples sizes are indicated in the figures and/or figure legends.
Supplementary Material
KEY RESOURCES TABLE
| REAGENT or RESOURCE | SOURCE | IDENTIFIER |
|---|---|---|
| Antibodies | ||
| Rabbit Anti-ZNF410 Polyclonal Antibody | Proteintech | Cat#: 14529-1-AP; RRID:AB_2257520 |
| Rabbit Anti-CHD4 Polyclonal Antibody | Proteintech | Cat#: 14173-1-AP; RRID:AB_2080046 |
| Rabbit Anti-CHD4 Polyclonal Antibody | Cell signaling technology | Cat#: 11912; RRID:AB_2751014 |
| Rabbit p66alpha Polyclonal Antibody | Thermo Fisher Scientific | Cat#:A302-358A-M; RRID:AB_2780491 |
| Rabbit HDAC2 Polyclonal Antibody | Thermo Fisher Scientific | Cat#:A300-705A-M; RRID:AB_2779403 |
| Rabbit MBD2 Polyclonal Antibody | Thermo Fisher Scientific | Cat#:A301-633A-M; RRID:AB_2780025 |
| Rabbit MTA2 Polyclonal Antibody | Thermo Fisher Scientific | Cat#:A300-395A-M; RRID:AB_2779193 |
| Rabbit Anti-HA-Tag Monoclonal Antibody | Cell signaling technology | Cat#: 3724; RRID:AB_1549585 |
| Monoclonal ANTI-FLAG® M2 antibody | Sigma-Aldrich | Cat#: F1804; RRID:AB_262044 |
| Ctip1 antibody [14B5] | Abcam | Cat#: ab19487; RRID:AB_444947 |
| Pokemon (LRF) Monoclonal Antibody (13E9) | Thermo Fisher Scientific | Cat#:14-3309-80; RRID:AB_2043857 |
| GATA-1 (N6) antibody | Santa Cruz Biotechnology | Cat#: sc-265; RRID:AB_627663 |
| Hemoglobin gamma (51-7) antibody | Santa Cruz Biotechnology | Cat#: sc-21756; RRID:AB_2295004 |
| β-Actin Antibody | Santa Cruz Biotechnology | Cat#: sc-47778; RRID:AB_626632 |
| Donkey Anti-Rabbit IgG, Whole Ab ECL Antibody, HRP Conjugated | GE Healthcare | Cat#: NA934; RRID:AB_772206 |
| Sheep Anti-Mouse IgG - Horseradish Peroxidase antibody | GE Healthcare | Cat#: NA931; RRID:AB_772210 |
| Goat anti-Rat IgG (H+L) Secondary Antibody, HRP | Thermo Fisher Scientific | Cat#: 31470; RRID:AB_228356 |
| Goat anti-Armenian Hamster IgG (H+L) Secondary Antibody, HRP | Thermo Fisher Scientific | Cat#: PA1-32045; RRID:AB_10985178 |
| PE anti-human CD49d antibody | BioLegend | Cat#: 304304; RRID:AB_314430 |
| PE/Cy7 anti-human CD71 antibody | BioLegend | Cat#: 334112; RRID:AB_2563119 |
| Fetal Hemoglobin Monoclonal Antibody (HBF-1), APC | Thermo Fisher Scientific | Cat#: MHFH05; RRID:AB_10374595 |
| CD45 antibody | BD Biosciences | Cat#: 560367; RRID:AB_1645573 |
| FITC anti-human CD235a (Glycophorin A) antibody | BioLegend | Cat#: 349104; RRID:AB_10613463 |
| PE anti-human CD33 antibody | BioLegend | Cat#:366608; RRID:AB_2566107 |
| APC anti-human CD19 antibody | BioLegend | Cat#:302212; RRID:AB_314242 |
| Bacterial and Virus Strains | ||
| Stbl3 | Thermo Fisher Scientific | Cat#:C737303 |
| Chemicals, Peptides, and Recombinant Proteins | ||
| Hexadimethrine bromide (polybrene) | Sigma-Aldrich | H9268 |
| Polyethylenimine, Linear, MW 25,000 (PEI 25000) | Polysciences | 23966-1 |
| Puromycin dihydrochloride | Sigma-Aldrich | P8833 |
| Agencourt AMPure XP | Beckman Coulter | A63880 |
| Dynabeads Protein A | Thermo Fisher Scientific | 10002D |
| Dynabeads Protein G | Thermo Fisher Scientific | 10004D |
| Formaldehyde, 37% solution | Thermo Fisher Scientific | F79-500 |
| Glycine | Fisher Scientific | BP381-1 |
| Proteinase K | New England Biolabs | P8107S |
| Ribonuclease A from bovine pancreas | Sigma-Aldrich | R4875 |
| T4 DNA polymerase | New England Biolabs | M0203L |
| Phusion Flash High-Fidelity PCR Master Mix | Thermo Fisher Scientific | F548S |
| iScript Reverse Transcription Supermix | Bio-Rad | 1708841 |
| Power SYBR Green Master Mix | Thermo Fisher Scientific | 4367659 |
| 2-Mercaptoethanol | Sigma-Aldrich | M6250 |
| Penicillin/Streptomycin | Thermo Fisher Scientific | 15140122 |
| Recombinant Human SCF | Peprotech | 300-07 |
| EPOETIN ALFA | AMGEN | 55513-144-10 |
| Critical Commercial Assays | ||
| MinElute Gel Extraction Kit | QIAGEN | 28604 |
| QIAquick PCR Purification Kit | QIAGEN | 28104 |
| QIAprep Spin Miniprep Kit (250) | QIAGEN | 27106 |
| Deposited Data | ||
| ChIP-seq and RNA-seq data | This study | GSE154963 |
| X-ray structures | This study | PDB: 6WMI |
| Human reference genome GRCh38/hg38 | Genome Reference Consortium | https://www.ncbi.nlm.nih.gov/assembly/GCF_000001405.26/ |
| Mouse reference genome GRCm38/mm10 | Genome Reference Consortium | https://www.ncbi.nlm.nih.gov/assembly/GCF_000001635.20/ |
| ATAC-seq data | Ludwig et al., 2019 | N/A |
| Experimental Models: Cell Lines | ||
| Human: HUDEP-2 | Kurita et al., 2013 | N/A |
| Human: HEK293T | ATCC | CRL-3216 |
| Human: CD34+ cells | Fred Hutch | https://sharedresources.fredhutch.org/products/cd34-cells |
| Mouse: G1E-ER4 cells | Weiss et al., 1997 | N/A |
| African green monkey: COS-7 cells | ATCC | CRL-1651 |
| Experimental Models: Organisms/Strains | ||
| Mouse: NOD.Cg-KitW-41J Tyr+ Prkdcscid Il2rgtm1Wjl/ThomJ (NBSGW) | Jackson Laboratory | 026622 |
| Oligonucleotides | ||
| RT-qPCR primers see Table S2 | This study | N/A |
| sgRNA sequence: Non-targeting control: GACCGGAACGATCTCGCGTABCL11A +58:CTAACAGTTGCTTTTATCACZNF410 sgRNA#1:GAACCACCAGATGTTTTCGGZNF410 sg RNA#2:CTCATCAGTGCCAAGTCTGT |
This study | N/A |
| Primers for NGS sequencing: ZNF410 sgRNA#1:F: GCCTCATATCCCATAATATTCAGCCCCATR: GAGCCAGGCATCCCATAATATTCATATTCTZNF410 sgRNA#2:F: ACACACGACATCCCATAATATCTTCTGGAGR: GCCTCACCAACCCATAATATTCCCCAGTCT |
This study | N/A |
| Primers for ChIP-qPCR: CHD4 promoter: F: GCAGACCTTTTGCAACTAACC R: GGGGTGCTTATTATGGGATG CHD4 enhancer: F: AGCAGCCATCCCATAATAGC R: CTCCATTTCCTCTCCAGCTC HBG2: F: TCACACACACACAAACACACG R: AGATGGGGGCAAAGTATGTC |
This study | N/A |
| Recombinant DNA | ||
| LRG2.1T | Tarumoto et al., 2018 | Addgene:108098 |
| pSDM101 | McCullough et al., 2012 | N/A |
| pSDM-HA-ZNF410 | This study | N/A |
| pSDM-HA-CHD4 | This study | N/A |
| pSDM-HA-ZF(1–5) | This study | N/A |
| pSDM-HA-ZF(2–4) | This study | N/A |
| pcDNA3-FLAG-ZNF410 full length | This study | N/A |
| pcDNA3-FLAG ZNF410 ZF (1–5) | This study | N/A |
| pcDNA3-FLAG ZNF410 ZF (1–4) | This study | N/A |
| pcDNA3-FLAG ZNF410 ZF (2–5) | This study | N/A |
| pcDNA3-FLAG ZNF410 ZF (1–3) | This study | N/A |
| pcDNA3-FLAG ZNF410 ZF (2–4) | This study | N/A |
| pcDNA3-FLAG ZNF410 ZF (3–5) | This study | N/A |
| pGEX-6P-1 | N/A | Millipore Sigma: GE28-9546-48 |
| pGEX-6P-ZF (1–5) | This study | N/A |
| Software and Algorithms | ||
| Bowtie2 | Langmead and Salzberg, 2012 | http://bowtie-bio.sourceforge.net/bowtie2/index.shtml |
| MACS2 | Feng et al., 2012 | https://github.com/macs3-project/MACS |
| UCSC Genome Browser | UCSC | http://genome.ucsc.edu/ |
| HOMER v.4.9 | Heinz et al., 2010 | http://homer.ucsd.edu/homer/ |
| FlowJo V9.7.6 | Tree Star | https://www.flowjo.com/ |
| Fuzznuc | EMBOSS | https://www.bioinformatics.nl/cgi-bin/emboss/fuzznuc |
| Deseq2 | Love et al., 2014a | http://www.bioconductor.org/packages/release/bioc/html/DESeq2.html |
| IGV v2.4.16 | The Broad Institute | https://software.broadinstitute.org/software/igv/download |
Highlights.
A CRISPR screen implicates ZNF410 in fetal globin gene repression
The CHD4 gene is the singular direct ZNF410 target in erythroid cells
Fetal globin genes are exquisitely sensitive to CHD4 levels
Five C2H2 zinc fingers of ZNF410 recognize the major groove of a 14-bp sequence
ACKNOWLEDGMENTS
We thank Dr. Shaun Mahony at Penn State University, Dr. Xing Zhang at the University of Texas MD Anderson, and members of the Blobel laboratory for helpful comments and discussions. We acknowledge Drs. Ryo Kurita and Yukio Nakamura for sharing HUDEP-2 cells. We thank the CHOP flow cytometry core for help with cell sorting. We also thank Richard Ashmun, Jonathan Laxton, and Stacie Woolard at St. Jude Children’s Research Hospital for assistance with flow cytometry; Chandra Savage and Kalin Mayberry for animal husbandry; and Shondra Miller and Shaina Porter for help with gene editing. This work was supported by NIH grants R24DK106766 (to G.A.B. and R.C.H.), R01HL119479 (to G.A.B.), and R35GM134744 (to X.C.); CPRIT RR160029 (to X.C.), Australian National Health and Medical Research Council APP1164920 (to M.C.), a scholarship from the Australian Government Research Training Program (to L.C.L.), the St. Jude-sponsored CRC Consortium, and a fellowship from Cooley’s Anemia Foundation (to X.L.). We thank the Di Gaetano family for their generous support.
Footnotes
SUPPLEMENTAL INFORMATION
Supplemental Information can be found online at https://doi.org/10.1016/j.molcel.2020.11.006.
DECLARATION OF INTERESTS
X.J., J.S., and G.A.B. are contributors to a patent filed on behalf of the Children’s Hospital of Philadelphia.
REFERENCES
- Adams CC, and Workman JL (1995). Binding of disparate transcriptional activators to nucleosomal DNA is inherently cooperative. Mol. Cell. Biol 15, 1405–1421. [DOI] [PMC free article] [PubMed] [Google Scholar]
- Adams PD, Grosse-Kunstleve RW, Hung LW, Ioerger TR, McCoy AJ, Moriarty NW, Read RJ, Sacchettini JC, Sauter NK, and Terwilliger TC (2002). PHENIX: building new software for automated crystallographic structure determination. Acta Crystallogr. D Biol. Crystallogr 58, 1948–1954. [DOI] [PubMed] [Google Scholar]
- Amaya M, Desai M, Gnanapragasam MN, Wang SZ, Zu Zhu S, Williams DC Jr., and Ginder GD (2013). Mi2β-mediated silencing of the fetal γ-globin gene in adult erythroid cells. Blood 121, 3493–3501. [DOI] [PMC free article] [PubMed] [Google Scholar]
- Andrews NC, and Faller DV (1991). A rapid micropreparation technique for extraction of DNA-binding proteins from limiting numbers of mammalian cells. Nucleic Acids Res. 19, 2499. [DOI] [PMC free article] [PubMed] [Google Scholar]
- Bak RO, Dever DP, and Porteus MH (2018). CRISPR/Cas9 genome editing in human hematopoietic stem cells. Nat. Protoc 13, 358–376. [DOI] [PMC free article] [PubMed] [Google Scholar]
- Benanti JA, Williams DK, Robinson KL, Ozer HL, and Galloway DA (2002). Induction of extracellular matrix-remodeling genes by the senescence-associated protein APA-1. Mol. Cell. Biol 22, 7385–7397. [DOI] [PMC free article] [PubMed] [Google Scholar]
- Campbell AE, Wilkinson-White L, Mackay JP, Matthews JM, and Blobel GA (2013). Analysis of disease-causing GATA1 mutations in murine gene complementation systems. Blood 121, 5218–5227. [DOI] [PMC free article] [PubMed] [Google Scholar]
- Crossley M, Whitelaw E, Perkins A, Williams G, Fujiwara Y, and Orkin SH (1996). Isolation and characterization of the cDNA encoding BKLF/TEF-2, a major CACCC-box-binding protein in erythroid cells and selected other cells. Mol. Cell. Biol 16, 1695–1705. [DOI] [PMC free article] [PubMed] [Google Scholar]
- Emsley P, and Cowtan K (2004). Coot: model-building tools for molecular graphics. Acta Crystallogr. D Biol. Crystallogr 60, 2126–2132. [DOI] [PubMed] [Google Scholar]
- Feng J, Liu T, Qin B, Zhang Y, and Liu XS (2012). Identifying ChIP-seq enrichment using MACS. Nat. Protoc 7, 1728–1740. [DOI] [PMC free article] [PubMed] [Google Scholar]
- Grevet JD, Lan X, Hamagami N, Edwards CR, Sankaranarayanan L, Ji X, Bhardwaj SK, Face CJ, Posocco DF, Abdulmalik O, et al. (2018). Domain-focused CRISPR screen identifies HRI as a fetal hemoglobin regulator in human erythroid cells. Science 361, 285–290. [DOI] [PMC free article] [PubMed] [Google Scholar]
- Heinz S, Benner C, Spann N, Bertolino E, Lin YC, Laslo P, Cheng JX, Murre C, Singh H, and Glass CK (2010). Simple combinations of lineage-determining transcription factors prime cis-regulatory elements required for macrophage and B cell identities. Mol. Cell 38, 576–589. [DOI] [PMC free article] [PubMed] [Google Scholar]
- Hendrickson WA, Horton JR, and LeMaster DM (1990). Selenomethionyl proteins produced for analysis by multiwavelength anomalous diffraction (MAD): a vehicle for direct determination of three-dimensional structure. EMBO J. 9, 1665–1672. [DOI] [PMC free article] [PubMed] [Google Scholar]
- Hong W, Nakazawa M, Chen YY, Kori R, Vakoc CR, Rakowski C, and Blobel GA (2005). FOG-1 recruits the NuRD repressor complex to mediate transcriptional repression by GATA-1. EMBO J. 24, 2367–2378. [DOI] [PMC free article] [PubMed] [Google Scholar]
- Horowitz S, and Trievel RC (2012). Carbon-oxygen hydrogen bonding in biological structure and function. J. Biol. Chem 287, 41576–41582. [DOI] [PMC free article] [PubMed] [Google Scholar]
- Hsu SC, Gilgenast TG, Bartman CR, Edwards CR, Stonestrom AJ, Huang P, Emerson DJ, Evans P, Werner MT, Keller CA, et al. (2017). The BET Protein BRD2 Cooperates with CTCF to Enforce Transcriptional and Architectural Boundaries. Mol. Cell 66, 102–116.e7. [DOI] [PMC free article] [PubMed] [Google Scholar]
- Huang P, Keller CA, Giardine B, Grevet JD, Davies JOJ, Hughes JR, Kurita R, Nakamura Y, Hardison RC, and Blobel GA (2017). Comparative analysis of three-dimensional chromosomal architecture identifies a novel fetal hemoglobin regulatory element. Genes Dev. 31, 1704–1713. [DOI] [PMC free article] [PubMed] [Google Scholar]
- Huang P, Peslak SA, Lan X, Khandros E, Yano JA, Sharma M, Keller CA, Giardine B, Qin K, Abdulmalik O, et al. (2020). The HRI-regulated transcription factor ATF4 activates BCL11A transcription to silence fetal hemoglobin expression. Blood 135, 2121–2132. [DOI] [PMC free article] [PubMed] [Google Scholar]
- Jacob F, Perrin D, Sanchez C, and Monod J (1960). [Operon: a group of genes with the expression coordinated by an operator]. C. R. Hebd. Seances Acad. Sci 250, 1727–1729. [PubMed] [Google Scholar]
- Jolma A, Yan J, Whitington T, Toivonen J, Nitta KR, Rastas P, Morgunova E, Enge M, Taipale M, Wei G, et al. (2013). DNA-binding specificities of human transcription factors. Cell 152, 327–339. [DOI] [PubMed] [Google Scholar]
- Kurita R, Suda N, Sudo K, Miharada K, Hiroyama T, Miyoshi H, Tani K, and Nakamura Y (2013). Establishment of immortalized human erythroid progenitor cell lines able to produce enucleated red blood cells. PLoS ONE 8, e59890. [DOI] [PMC free article] [PubMed] [Google Scholar]
- Langmead B, and Salzberg SL (2012). Fast gapped-read alignment with Bowtie 2. Nat. Methods 9, 357–359. [DOI] [PMC free article] [PubMed] [Google Scholar]
- Lejon S, Thong SY, Murthy A, AlQarni S, Murzina NV, Blobel GA, Laue ED, and Mackay JP (2011). Insights into association of the NuRD complex with FOG-1 from the crystal structure of an RbAp48·FOG-1 complex. J. Biol. Chem 286, 1196–1203. [DOI] [PMC free article] [PubMed] [Google Scholar]
- Liu N, Hargreaves VV, Zhu Q, Kurland JV, Hong J, Kim W, Sher F, Macias-Trevino C, Rogers JM, Kurita R, et al. (2018). Direct Promoter Repression by BCL11A Controls the Fetal to Adult Hemoglobin Switch. Cell 173, 430–442.e17. [DOI] [PMC free article] [PubMed] [Google Scholar]
- Love MI, Huber W, and Anders S (2014a). Moderated estimation of fold change and dispersion for RNA-seq data with DESeq2. Genome Biol. 15, 550. [DOI] [PMC free article] [PubMed] [Google Scholar]
- Love PE, Warzecha C, and Li L (2014b). Ldb1 complexes: the new master regulators of erythroid gene transcription. Trends Genet. 30, 1–9. [DOI] [PMC free article] [PubMed] [Google Scholar]
- Lu B, Klingbeil O, Tarumoto Y, Somerville TDD, Huang YH, Wei Y, Wai DC, Low JKK, Milazzo JP, Wu XS, et al. (2018). A Transcription Factor Addiction in Leukemia Imposed by the MLL Promoter Sequence. Cancer Cell 34, 970–981.e8. [DOI] [PMC free article] [PubMed] [Google Scholar]
- Ludwig LS, Lareau CA, Bao EL, Nandakumar SK, Muus C, Ulirsch JC, Chowdhary K, Buenrostro JD, Mohandas N, An X, et al. (2019). Transcriptional States and Chromatin Accessibility Underlying Human Erythropoiesis. Cell Rep 27, 3228–3240.e7. [DOI] [PMC free article] [PubMed] [Google Scholar]
- Luscombe NM, Laskowski RA, and Thornton JM (2001). Amino acid-base interactions: a three-dimensional analysis of protein-DNA interactions at an atomic level. Nucleic Acids Res. 29, 2860–2874. [DOI] [PMC free article] [PubMed] [Google Scholar]
- Martyn GE, Wienert B, Yang L, Shah M, Norton LJ, Burdach J, Kurita R, Nakamura Y, Pearson RCM, Funnell APW, et al. (2018). Natural regulatory mutations elevate the fetal globin gene via disruption of BCL11A or ZBTB7A binding. Nat. Genet 50, 498–503. [DOI] [PubMed] [Google Scholar]
- Masuda T, Wang X, Maeda M, Canver MC, Sher F, Funnell AP, Fisher C, Suciu M, Martyn GE, Norton LJ, et al. (2016). Transcription factors LRF and BCL11A independently repress expression of fetal hemoglobin. Science 351, 285–289. [DOI] [PMC free article] [PubMed] [Google Scholar]
- McCullough SD, Xu X, Dent SY, Bekiranov S, Roeder RG, and Grant PA (2012). Reelin is a target of polyglutamine expanded ataxin-7 in human spinocerebellar ataxia type 7 (SCA7) astrocytes. Proc. Natl. Acad. Sci. USA 109, 21319–21324. [DOI] [PMC free article] [PubMed] [Google Scholar]
- McIntosh BE, Brown ME, Duffin BM, Maufort JP, Vereide DT, Slukvin II, and Thomson JA (2015). Nonirradiated NOD,B6.SCID Il2rγ−/− Kit(W41/W41) (NBSGW) mice support multilineage engraftment of human hematopoietic cells. Stem Cell Reports 4, 171–180. [DOI] [PMC free article] [PubMed] [Google Scholar]
- Menzel S, Garner C, Gut I, Matsuda F, Yamaguchi M, Heath S, Foglio M, Zelenika D, Boland A, Rooks H, et al. (2007). A QTL influencing F cell production maps to a gene encoding a zinc-finger protein on chromosome 2p15. Nat. Genet 39, 1197–1199. [DOI] [PubMed] [Google Scholar]
- Métais JY, Doerfler PA, Mayuranathan T, Bauer DE, Fowler SC, Hsieh MM, Katta V, Keriwala S, Lazzarotto CR, Luk K, et al. (2019). Genome editing of HBG1 and HBG2 to induce fetal hemoglobin. Blood Adv. 3, 3379–3392. [DOI] [PMC free article] [PubMed] [Google Scholar]
- Oliviero S, and Struhl K (1991). Synergistic transcriptional enhancement does not depend on the number of acidic activation domains bound to the promoter. Proc. Natl. Acad. Sci. USA 88, 224–228. [DOI] [PMC free article] [PubMed] [Google Scholar]
- Otwinowski Z, Borek D, Majewski W, and Minor W (2003). Multiparametric scaling of diffraction intensities. Acta Crystallogr. A 59, 228–234. [DOI] [PubMed] [Google Scholar]
- Patel A, Hashimoto H, Zhang X, and Cheng X (2016). Characterization of How DNA Modifications Affect DNA Binding by C2H2 Zinc Finger Proteins. Methods Enzymol. 573, 387–401. [DOI] [PMC free article] [PubMed] [Google Scholar]
- Patel Anamika, Yang Peng, Tinkham Matthew, Pradhan Mihika, Sun Ming-An, Wang Yixuan, Hoang Don, Wolf Gernot, Horton John R., Zhang Xing, Macfarlan Todd, and Cheng Xiaodong (2018). DNA Conformation Induces Adaptable Binding by Tandem Zinc Finger Proteins. Cell 173, 221–233.e12. [DOI] [PMC free article] [PubMed] [Google Scholar]
- Patel Anamika, Zhang Xing, Blumenthal Robert, and Cheng Xiaodong (2017). Structural basis of human PR/SET domain 9 (PRDM9) allele C-specific recognition of its cognate DNA sequence. J. Biol. Chem 292, 15994–16002. [DOI] [PMC free article] [PubMed] [Google Scholar]
- Pennacchio LA, Ahituv N, Moses AM, Prabhakar S, Nobrega MA, Shoukry M, Minovitsky S, Dubchak I, Holt A, Lewis KD, et al. (2006). In vivo enhancer analysis of human conserved non-coding sequences. Nature 444, 499–502. [DOI] [PubMed] [Google Scholar]
- Platt OS, Brambilla DJ, Rosse WF, Milner PF, Castro O, Steinberg MH, and Klug PP (1994). Mortality in sickle cell disease. Life expectancy and risk factors for early death. N. Engl. J. Med 330, 1639–1644. [DOI] [PubMed] [Google Scholar]
- Polach KJ, and Widom J (1996). A model for the cooperative binding of eukaryotic regulatory proteins to nucleosomal target sites. J. Mol. Biol 258, 800–812. [DOI] [PubMed] [Google Scholar]
- Sankaran VG, Menne TF, Xu J, Akie TE, Lettre G, Van Handel B, Mikkola HK, Hirschhorn JN, Cantor AB, and Orkin SH (2008). Human fetal hemoglobin expression is regulated by the developmental stage-specific repressor BCL11A. Science 322, 1839–1842. [DOI] [PubMed] [Google Scholar]
- Sher F, Hossain M, Seruggia D, Schoonenberg VAC, Yao Q, Cifani P, Dassama LMK, Cole MA, Ren C, Vinjamur DS, et al. (2019). Rational targeting of a NuRD subcomplex guided by comprehensive in situ mutagenesis. Nat. Genet 51, 1149–1159. [DOI] [PMC free article] [PubMed] [Google Scholar]
- Shi J, Wang E, Milazzo JP, Wang Z, Kinney JB, and Vakoc CR (2015). Discovery of cancer drug targets by CRISPR-Cas9 screening of protein domains. Nat. Biotechnol 33, 661–667. [DOI] [PMC free article] [PubMed] [Google Scholar]
- Siepel A, Bejerano G, Pedersen JS, Hinrichs AS, Hou M, Rosenbloom K, Clawson H, Spieth J, Hillier LW, Richards S, et al. (2005). Evolutionarily conserved elements in vertebrate, insect, worm, and yeast genomes. Genome Res. 15, 1034–1050. [DOI] [PMC free article] [PubMed] [Google Scholar]
- Srivastava D, and Mahony S (2020). Sequence and chromatin determinants of transcription factor binding and the establishment of cell type-specific binding patterns. Biochim. Biophys. Acta. Gene Regul. Mech 1863, 194443. [DOI] [PMC free article] [PubMed] [Google Scholar]
- Tarumoto Y, Lu B, Somerville TDD, Huang YH, Milazzo JP, Wu XS, Klingbeil O, El Demerdash O, Shi J, and Vakoc CR (2018). LKB1, Salt-Inducible Kinases, and MEF2C Are Linked Dependencies in Acute Myeloid Leukemia. Mol. Cell 69, 1017–1027.e6. [DOI] [PMC free article] [PubMed] [Google Scholar]
- Terwilliger TC, Adams PD, Read RJ, McCoy AJ, Moriarty NW, Grosse-Kunstleve RW, Afonine PV, Zwart PH, and Hung LW (2009). Decision-making in structure solution using Bayesian estimates of map quality: the PHENIX AutoSol wizard. Acta Crystallogr. D Biol. Crystallogr 65, 582–601. [DOI] [PMC free article] [PubMed] [Google Scholar]
- Torrado M, Low JKK, Silva APG, Schmidberger JW, Sana M, Sharifi Tabar M, Isilak ME, Winning CS, Kwong C, Bedward MJ, et al. (2017). Refinement of the subunit interaction network within the nucleosome remodelling and deacetylase (NuRD) complex. FEBS J. 284, 4216–4232. [DOI] [PMC free article] [PubMed] [Google Scholar]
- Uda M, Galanello R, Sanna S, Lettre G, Sankaran VG, Chen W, Usala G, Busonero F, Maschio A, Albai G, et al. (2008). Genome-wide association study shows BCL11A associated with persistent fetal hemoglobin and amelioration of the phenotype of beta-thalassemia. Proc. Natl. Acad. Sci. USA 105, 1620–1625. [DOI] [PMC free article] [PubMed] [Google Scholar]
- Wang X, Crispino JD, Letting DL, Nakazawa M, Poncz M, and Blobel GA (2002). Control of megakaryocyte-specific gene expression by GATA-1 and FOG-1: role of Ets transcription factors. EMBO J. 21, 5225–5234. [DOI] [PMC free article] [PubMed] [Google Scholar]
- Wang E, Kawaoka S, Roe JS, Shi J, Hohmann AF, Xu Y, Bhagwat AS, Suzuki Y, Kinney JB, and Vakoc CR (2015). The transcriptional cofactor TRIM33 prevents apoptosis in B lymphoblastic leukemia by deactivating a single enhancer. eLife 4, e06377. [DOI] [PMC free article] [PubMed] [Google Scholar]
- Weiss MJ, Yu C, and Orkin SH (1997). Erythroid-cell-specific properties of transcription factor GATA-1 revealed by phenotypic rescue of a gene-targeted cell line. Mol. Cell. Biol 17, 1642–1651. [DOI] [PMC free article] [PubMed] [Google Scholar]
- Wienert B, Martyn GE, Funnell APW, Quinlan KGR, and Crossley M (2018). Wake-up Sleepy Gene: Reactivating Fetal Globin for β-Hemoglobinopathies. Trends Genet. 34, 927–940. [DOI] [PubMed] [Google Scholar]
- Wolfe SA, Nekludova L, and Pabo CO (2000). DNA recognition by Cys2His2 zinc finger proteins. Annu. Rev. Biophys. Biomol. Struct 29, 183–212. [DOI] [PubMed] [Google Scholar]
- Xu J, Bauer DE, Kerenyi MA, Vo TD, Hou S, Hsu YJ, Yao H, Trowbridge JJ, Mandel G, and Orkin SH (2013). Corepressor-dependent silencing of fetal hemoglobin expression by BCL11A. Proc. Natl. Acad. Sci. USA 110, 6518–6523. [DOI] [PMC free article] [PubMed] [Google Scholar]
- Yang P, Wang Y, Hoang D, Tinkham M, Patel A, Sun MA, Wolf G, Baker M, Chien HC, Lai KN, et al. (2017). A placental growth factor is silenced in mouse embryos by the zinc finger protein ZFP568. Science 356, 757–759. [DOI] [PMC free article] [PubMed] [Google Scholar]
- Yoshida T, Hazan I, Zhang J, Ng SY, Naito T, Snippert HJ, Heller EJ, Qi X, Lawton LN, Williams CJ, and Georgopoulos K (2008). The role of the chromatin remodeler Mi-2beta in hematopoietic stem cell self-renewal and multilineage differentiation. Genes Dev. 22, 1174–1189. [DOI] [PMC free article] [PubMed] [Google Scholar]
Associated Data
This section collects any data citations, data availability statements, or supplementary materials included in this article.
Supplementary Materials
Data Availability Statement
The X-ray structures (coordinates and structure factor files) of the ZNF410 ZF domain with bound DNA have been submitted to PDB:::6WMI.
The RNA-seq and ChIP-seq data have been deposited to the GEO database :GSE154963. Original immunoblot data and microscopic images have been deposited to Mendeley Data: https://doi.org/10.17632/xhzk993nhh.1