

SUMMARY
We have performed an in-depth single-cell phenotypic characterization of high-grade serous ovarian cancer (HGSOC) by multiparametric mass cytometry (CyTOF). Using a CyTOF antibody panel to interrogate features of HGSOC biology, combined with unsupervised computational analysis, we identified noteworthy cell types co-occurring across the tumors. In addition to a dominant cell subset, each tumor harbored rarer cell phenotypes. One such group co-expressed E-cadherin and vimentin (EV), suggesting their potential role in epithelial mesenchymal transition, which was substantiated by pairwise correlation analyses. Furthermore, tumors from patients with poorer outcome had an increased frequency of another rare cell type that co-expressed vimentin, HE4, and cMyc. These poorer-outcome tumors also populated more cell phenotypes, as quantified by Simpson’s diversity index. Thus, despite the recognized genomic complexity of the disease, the specific cell phenotypes uncovered here offer a focus for therapeutic intervention and disease monitoring.
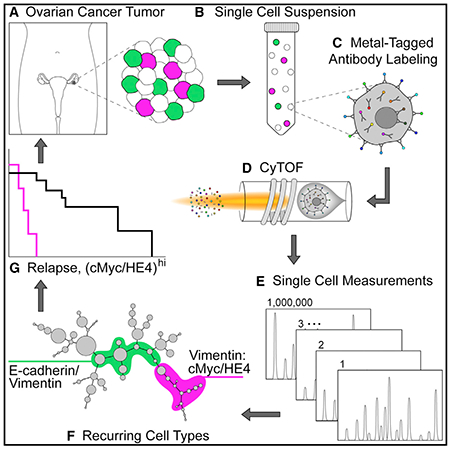
Graphical Abstract
In Brief
Although genetic and proteomic data from bulk-processed HGSOC tumors exist, critical information about rare cell subsets is lost. Using multiparametric CyTOF analysis of viable single cells from HGSOC tumors, Gonzalez et al. uncover cell types recurring across tumors with potential roles in metastasis and disease progression.
INTRODUCTION
High-grade serous ovarian cancer (HGSOC) is the most prevalent and lethal gynecological malignancy, characterized by TP53 mutations, inherited inactivating mutations in BRCA genes, defects in homologous recombination repair, and overall chromosomal instability (Bowtell et al., 2015; Ciriello et al., 2013; Matulonis et al., 2016). Using large-scale, high-throughput technologies, HGSOC primary tumors have also been characterized by RNA and miRNA expression signatures and promoter methylation status (Konecny et al., 2014; Krzystyniak et al., 2016; Cancer Genome Atlas Research Network, 2011; Tothill et al., 2008). Conclusions from these and other studies characterized HGSOC as a heterogeneous disease, with the term “heterogeneity” implying poor prognosis. Despite multiple studies linking molecularly based subtypes of HGSOC tumors to clinical outcomes, the findings have proved difficult to confirm in independent patient cohorts, partly because of the use of different algorithms (Chen et al., 2017; Konecny et al., 2014; Krzystyniak et al., 2016; Cancer Genome Atlas Research Network, 2011; Tothill et al., 2008; Wang et al., 2012). To date, however, aside from determining a patient’s BRCA status, none of the molecular features reported have been incorporated into routine clinical practice for HGSOC patients.
Studies in cancer showed that genomic complexity converges upon a more limited set of phenotypes (Krogan et al., 2015; Vogelstein et al., 2013), implying that the well-recognized diversity of HGSOC may be more circumscribed at the proteomic level. In-depth proteomic analyses by mass spectrometry of HGSOC tumor cell lysates provided insight into how genetic and molecular changes affect the proteome of ovarian tumors (Coscia et al., 2016; Zhang et al., 2016). Although these datasets were linked to clinical outcomes, they only provide a valuable resource and await translation into clinical practice.
As an alternative proteomic approach, we applied multiparameter CyTOF to dissect HGSOC at the single-cell level, with the goal of identifying clinically relevant cell subsets implicated in tumor development and drug resistance and with the potential to offer new therapeutic targets. CyTOF permits detailed characterization of subtly differing cell populations (large or small) that are lost within tumor cell lysates. With a panel of antibodies, each conjugated to a distinct stable metal isotope, CyTOF enables simultaneous detection of up to 50 parameters per cell (Bjornson et al., 2013; Spitzer and Nolan, 2016). Here, we present a detailed single-cell phenotypic characterization of more than 800,000 tumor cells dissociated from 17 newly diagnosed HGSOC tumors, simultaneously measuring expression of surface markers, intracellular signaling proteins, transcription factors, and cell-cycle proteins.
RESULTS
CyTOF Assay Optimization for Ovarian Tumors
Of 22 newly diagnosed ovarian tumors received (median follow-up post-surgery 26 months), 17 were confirmed as HGSOC and were the focus of this study (Table 1). Tumors were disaggregated using stringent protocols, generating more than 800,000 viable single-cells for analysis (Experimental Procedures). To evaluate the overall quality of the tumor tissue and any significant tumor necrosis, immunohistochemistry was performed on tissue sections that had been prepared within 30 min of tumor resection (Experimental Procedures; Figure S1; Table S1). Pathogenic mutations in TP53, a known molecular hallmark of HGSOC (Ahmed et al., 2010; Köbel et al., 2016) were confirmed by sequencing (Table S2).
Table 1.
Clinical Characteristics of Patient Samples
| Case No. | Patient ID | Age at Case Start (year) | Weight (kg) | BMI | Description | Localization | Histological Type | Stage | Radicality | Grade | Morphology | MUC16/CA-125 (U/mL) |
|---|---|---|---|---|---|---|---|---|---|---|---|---|
| 1 | X2617 | 63 | 79.0 | 29.0 | malignant neoplasm of ovary | ovary | ovarian carcinoma, serous type | III C | R2 | G3 | serous cystadenocarcinoma, NOS | 2,418.7 |
| 2 | X2619 | 57 | 100.0 | 35.4 | malignant neoplasm of ovary | ovary | ovarian carcinoma, serous type | IIC | R0 | G2 | serous cystadenocarcinoma, NOS | NA |
| 3 | Z289 | 79 | 65.0 | 25.4 | malignant neoplasm of ovary | ovary | ovarian carcinoma, serous papillary type | III C | RX | G3 | papillary serous cystadenocarcinoma | 355.5 |
| 4 | X2648a | 67 | 78 | 27 | malignant neoplasm of ovary | peritoneum | ovarian carcinoma, serous papillary type | III C | R1 | G3 | serous cystadenocarcinoma, NOS (C56.9) | 461 |
| 5 | Z378 | 71 | 77.0 | 26.6 | malignant neoplasm of ovary | ovary | ovarian carcinoma, serous papillary type | III C | R0 | G3 | serous cystadenocarcinoma, NOS (C56.9) | 44.4 |
| 6 | X2643 | 53 | 77.0 | 24.3 | malignant neoplasm of ovary | peritoneum | ovarian carcinoma, serous papillary type | III B | R0 | G3 | serous cystadenocarcinoma, NOS (C56.9) | 614.2 |
| 7 | Z403 | 82 | 71.0 | 27.1 | malignant neoplasm of ovary | ovary | ovarian carcinoma | III C | RX | G3 | serous surface papillary carcinoma (C56.9) | 129.7 |
| 8 | X2638 | 72 | 80.0 | 32.0 | malignant neoplasm of ovary | ovary | adenocarcinoma | IV | R2 | G3 | adenocarcinoma, NOS | 318 |
| 9 | Z377b | 56 | 108.0 | 35.7 | malignant neoplasm of ovary | ovary | ovarian carcinoma, serous papillary type | IV | R0 | G3 | serous surface papillary carcinoma | 541.5 |
| 10 | Z467 | 48 | 72 | 24.3 | malignant neoplasm of ovary | omentum | ovarian carcinoma, serous papillary type | III C | R0 | G3 | serous cystadenocarcinoma, NOS (C56.9) | 135.1 |
| 11 | R1116 | 67 | 72 | 27.4 | malignant neoplasm of ovary | ovary | ovarian carcinoma, serous papillary type | III C | R1 | G3 | serous surface papillary carcinoma (C56.9) | 481.6 |
| 12 | R1118 | 84 | 53 | 19.2 | malignant neoplasm of ovary | ovary | ovarian carcinoma, serous type | III A | RX | G3 | serous cystadenocarcinoma, NOS (C56.9) | 360.3 |
| 13 | Z500 | 58 | 85 | 30.1 | malignant neoplasm of ovary | ovary | ovarian carcinoma, serous papillary type | III C | R0 | G3 | serous surface papillary carcinoma (C56.9) | NA |
| 14 | X2661a | 74 | 63 | 24.6 | malignant neoplasm of ovary | peritoneum | ovarian carcinoma, serous papillary type | III C | R2 | G3 | serous surface papillary carcinoma (C56.9) | 813.5 |
| 15 | R1153 | 88 | 47 | 19.6 | malignant neoplasm of ovary | ovary | ovarian carcinoma, serous papillary type | III C | R2 | G3 | papillary serous cystadenocarcinoma (C56.9) | 90.4 |
| 16 | Z536 | 82 | 56 | 19.8 | malignant neoplasm of ovary | omentum | ovarian carcinoma, serous papillary type | III C | RX | G3 | serous cystadenocarcinoma, NOS (C56.9) | 1124 |
| 17 | X2667 | 69 | 61 | 22.4 | malignant neoplasm of ovary | ovary | ovarian carcinoma, serous papillary type | III C | R0 | G3 | serous surface papillary carcinoma (C56.9) | 159.1 |
Chemo-naive tumors used in this study were all diagnosed as malignant neoplasms of the ovary. Most were late stage, and all patients underwent surgical debulking followed by a platinum-based chemotherapeutic regimen. See also Table S2.
Clinical follow-up information was unavailable for patients X2648 and X2661.
Patient Z377 died during surgery.
Single-cell suspensions of HGSOC tumors were analyzed by CyTOF, which detects antibodies bound to cells via metal isotopes to which the antibodies are conjugated (Bjornson et al., 2013; Spitzer and Nolan, 2016). A panel of 41 antibodies was assembled that included 4 antibodies to allow for manual gating of viable tumor cells, with the remaining 37 (selected after an extensive review of the literature) used to interrogate HGSOC tumor biology (Figure 1; Experimental Procedures; Table S3) (Baldwin et al., 2014; Bowtell et al., 2015; Davidson et al., 2012; Lu et al., 2012; Matulonis et al., 2016; Stewart et al., 2011; Ye and Weinberg, 2015; Zhang et al., 2014). The final choice of antibodies relied upon the availability of high-quality antibody clones. Antibody performance and reproducibility of our methodology was demonstrated by analysis of CyTOF data from technical and biological replicates (Experimental Procedures; Figure S2).
Figure 1. Antibody Panel for CyTOF.
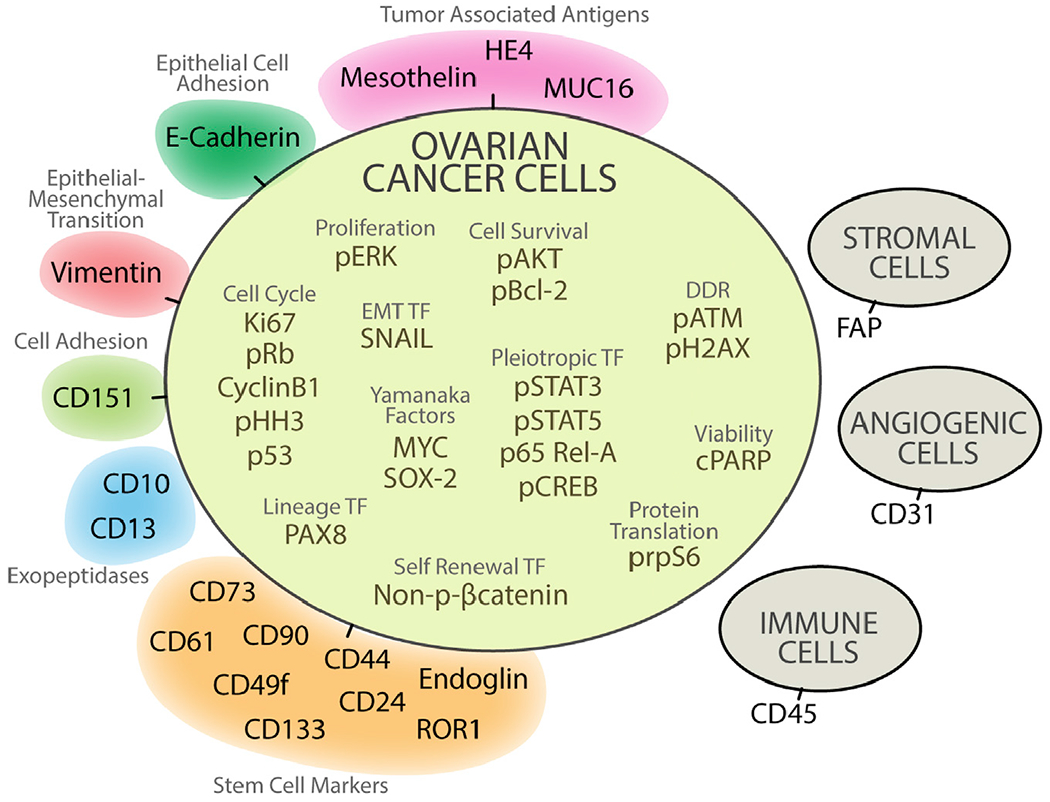
To detect proteins expressed by individual cells in ovarian tumor samples, 37 of 41 antibodies were selected. Colors indicate different categories of proteins. Because no prior cell sorting was undertaken before CyTOF, CD45, FAP, and CD31 were added to this panel to identify and subsequently exclude by manual gating, immune, angiogenic, and stromal cells. To select for viable cells, an antibody to cleaved PARP (cPARP) was also included in the panel (Experimental Procedures). See also Figure S3 and Table S3.
Phenotypic Characterization of Ovarian Tumor Cell Subsets by Unsupervised Clustering
This study measured 37 proteins (surface and intracellular) simultaneously in more than 800,000 single cells to identify specific cell phenotypes and their recurrence across HGSOC tumors. Manual gating using CD45, FAP, and CD31 excluded immune, stromal, and blood vessel cells, respectively, from the analysis. An antibody against cleaved PARP (cPARP) was used to gate out nonviable tumor cells (Figure 1; Experimental Procedures; Figure S3). Initially, single-cell readouts for the tumor cells from all 17 samples were computationally merged without input of any biological or clinical features. These readouts were then clustered with a non-parametric, density-based algorithm called X-shift (Samusik et al., 2016). Markers for clustering were chosen to delineate cell identity, based on co-expression patterns for E-cadherin, CD73, CD61, CD90, CD151, CD49f, CD133, ROR1, CD10, CD13, endoglin, CD24, CD44, MUC16 (CA125), mesothelin, vimentin, and HE4. The 56 X-shift clusters generated by the X-shift algorithm were then visualized computationally along a minimum spanning tree (MST) such that neighboring clusters had similar marker co-expression patterns (Anchang et al., 2016; Samusik et al., 2016) (Figure S4). These MSTs enabled the visualization of a detailed substructure of component cell phenotypes within the tumors (Figures 2A and 2B).
Figure 2. Mean Protein Expression Levels across 56 X-Shift Cell Clusters.
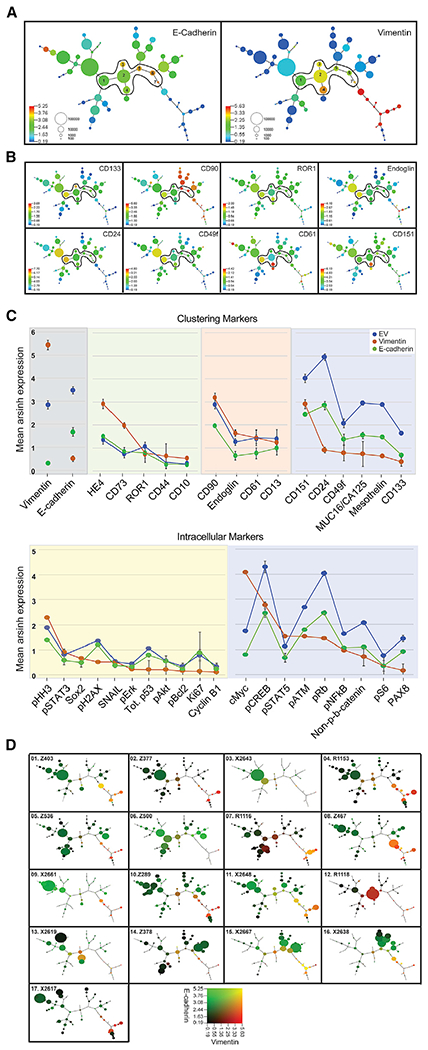
(A) Composite MST of 17 HGSOC tumors shows mean expression of E-cadherin (E) (left-hand panel) and vimentin (V) (right-hand panel). Seven cell clusters co-expressing both E and V(EV clusters) are numbered and encircled. Scale shows cell frequency per bubble.
(B) Composite MST as in (A), showing expression levels of putative stem cell markers and CD151, a cell adhesion protein.
(C) Ranked mean protein expression levels with SEM shown for EV (blue), E-cadherin (green), and vimentin (orange) cell clusters (upper plot, clustering proteins; lower plot, intracellular proteins). Panels for the clustering markers show subgroups of EV proteins with expression levels that are comparable to E-cadherin (green background) or vimentin (orange background) or differ significantly from those in the E-cadherin or vimentin clusters. Panels for the intracellular markers show a subgroup of EV proteins with expression levels comparable to either E-cadherin or to both E-cadherin and vimentin (yellow background). The second subgroup of EV proteins have differing expression levels to both E-cadherin and vimentin (blue background).
(D) Cell distribution within the 56 clusters reveal different degrees of tumor diversity. Individual MSTs for each of the 17 tumor samples show co-expression of E-cadherin (green) and vimentin (red). Bubble sizes reflect the number of cells in each cluster (). Scales represent median arsinh-transformed protein expression (Experimental Procedures). Blue (A and B) and black (D) represent a signal < 0.19 arcsinh-transformed and 1.0 in raw CyTOF counts. Range of expression > 0.19 up to the 99th percentile colored by quantile increases. See also Figures S5 and S6 and Tables S5 and S6.
Each composite MST representing the merged data of 800,000 cells is colored protein by protein (Figures 2A and 2B; Figure S5). Most cell clusters expressed E-cadherin, which was usually mutually exclusive of those expressing vimentin (Figure 2A). E-cadherin clusters co-expressed PAX8, CA125, and mesothelin, known tumor-associated antigens for HGSOC (Figure S5D) (Bowtell et al., 2015; Matulonis et al., 2016). However, expression patterns of putative stem cell markers differed throughout the MST, suggesting stem-progenitor plasticity and adaptation to the dynamic host microenvironment (Figure 2B) (McAllister and Weinberg, 2014).
Notably, seven cell clusters co-expressed E-cadherin and vimentin (EV), forming a bridge between the E-cadherin and vimentin branches of the MST and varying from low to high frequencies across individual tumors (Figure 2A; Table S6). Data support the link between transit through epithelial mesenchymal transition (EMT) and the acquisition of stem cell-like properties (Shibue and Weinberg, 2017; Ye and Weinberg, 2015). Consistent with this, EV cells expressed differing patterns of the putative cancer stem cell markers included in this study (CD24, CD13, CD10, CD73, CD61, CD49f, CD90, CD44, CD133, endoglin, and ROR1), as well as signaling proteins involved in conferring stemness (Sox-2, pSTAT3, pSTAT5, NFκB, pCREB, and β-catenin) (Ye and Weinberg, 2015). As described for E-cadherin and vimentin clusters, differing co-expression patterns for putative stem cell markers in EV cells are also consistent with cellular plasticity (Figures 2B and 2C; Figure S5; Table S4).
Further analysis of EV cell clusters revealed that expression levels of a subgroup of proteins mirrored either those in E-cadherin or vimentin clusters, emphasizing the hybrid properties of the EV cells (Figure 2C, upper plot with clustering markers and lower plot with intracellular markers). Of proteins expressed at increased levels in EV cells, compared to the E-cadherin or vimentin cells, five (CD24, CD49f, CD133, ROR, and β-catenin) are consistent with a stem cell phenotype (Davidson, 2016; Shibue and Weinberg, 2017; Stewart et al., 2011; Zhang et al., 2014), while three (pRb, cyclin B1, and pS6) are consistent with a dysregulated cell cycle as previously reported (Au-Yeung et al., 2017; Etemadmoghadam et al., 2010). Also observed in EV clusters were elevated levels of CD151, a metastasis-promoting protein implicated in ovarian cancer EMT (Baldwin et al., 2014; Hemler, 2014; Medrano et al., 2017).
Although detected in E-cadherin and EV clusters, HE4 and cMyc had significantly greater co-expression in the vimentin branch of the MST (Figure S5). HE4, an ovarian tumor-associated protein with a presumptive role in promoting invasion, metastasis, and drug resistance, is often used as a biomarker for the management of HGSOC (Li et al., 2017; Lu et al., 2012; Moore et al., 2014). MYC and WFDC2 (HE4) gene amplification in HGSOC is well documented (Jiang et al., 2013; Li et al., 2013; Lu et al., 2012; Cancer Genome Atlas Research Network, 2011), but co-expression of cMyc and HE4 with vimentin is revealed here and suggests a prominent role for these proteins in HGSOC metastasis.
Co-occurring Cell Subsets across Tumors
Reflecting the composite MST, MSTs for individual samples were enriched for cell clusters expressing E-cadherin, with differing expression patterns for individual proteins (Figure 2D; Figures S6 and S7). Both within and across the tumors, cluster sizes (denoting cell frequency) differed and defined the diversity of each tumor (Figure 2D; Tables S5 and S6).
Examination of the relative cell frequency distribution across all clusters revealed that each sample had a dominant cluster (DC) but that its relative cell frequency ranged from 16% to 83% (Figures 3A–3C; Tables S5 and S6). DC1 was present in all samples but was dominant in samples 1–6 (Figures 3B and 3C). DC2–DC10 were found across the remaining eleven samples. Of the ten DCs, seven resided within the E-cadherin part of the MST. DC4 and DC8 were within the EV and vimentin MST branches, respectively (Figures 2D and 3B). Comparing the phenotypic profiles across the DCs showed significant differences in the expression of clustering markers. This contrasts with the lower variability in the expression of the intracellular proteins and highlights their importance for tumor survival (Figure 3D).
Figure 3. Novel and Dominant Cell Clusters across Individual HGSOC Tumors.
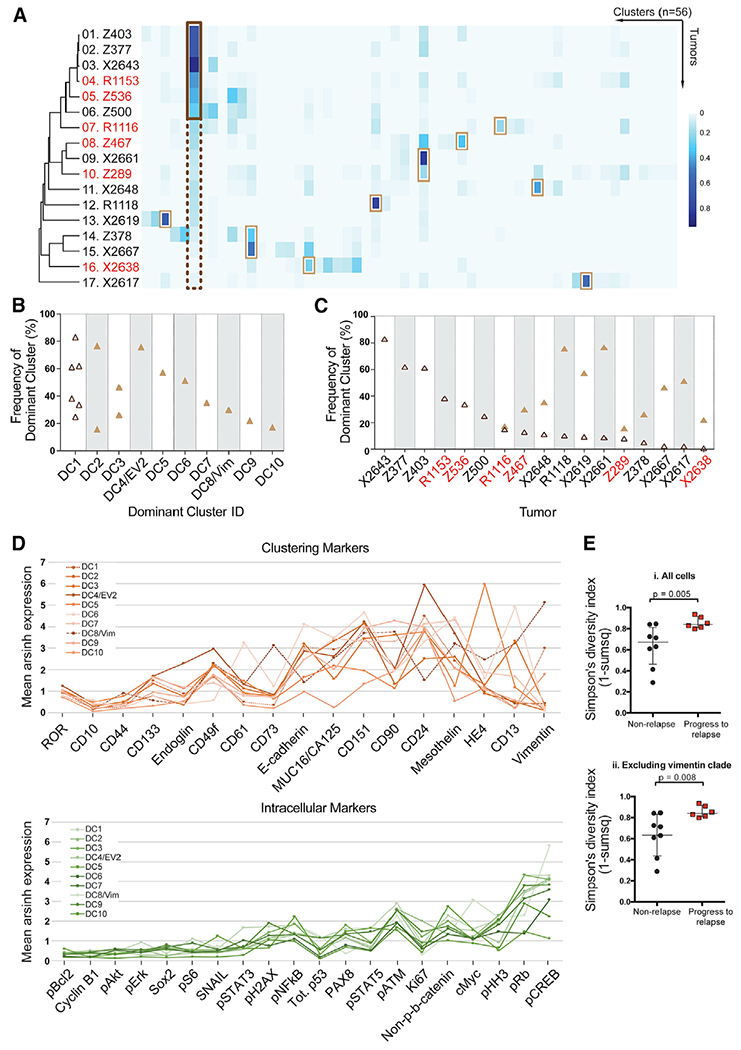
(A) Heatmap depicting the cell frequency distribution within 56 clusters (columns) from each HGSOC sample (rows). Red font denotes relapse samples. Each tumor has a dominant cluster (DC), defined as a cluster with the highest frequency of cells for an individual sample. On the left-hand side, a dark brown box highlights that DC1 is dominant in tumors 1 to 6 (cell frequency > than 20%, outlined by a solid dark brown line) and is present, but not dominant, in the remaining tumors (cell frequency < 20%, outlined by a dotted dark brown line). Light brown boxes highlight DC2–DC10. DC1–DC3, DC5–DC7, DC9, and DC10 reside within the E-cadherin part of the tumor, whereas DC4 is also EV2 and DC8 is a vimentin-expressing cluster.
(B) Size (cell frequency) of DCs per tumor arranged in decreasing order. Size and co-occurrence for each DC are shown. DC1 (open dark brown triangles) occurs in six samples. DC2-DC10 are depicted by filled light brown triangles.
(C) Distribution of DCs across samples. DC1 (open triangle) is present in all tumors. DC2–DC10 (filled triangles) are present in tumors 7–17.
(D) Average mean expression levels for each of the ten DCs are shown for the 17 clustering proteins (upper panel) and 20 intracellular proteins (lower panel). The ordering of the proteins is based on the increase in variance across the DCs.
(E) Simpson’s diversity index was significantly greater for patients that proceeded to relapse (n = 6) versus those that did not (n = 8). p = 0.005 or p = 0.008, including or excluding cells in the vimentin clade, respectively. Medians and interquartile ranges are shown.
Quantification of Heterogeneity by Simpson’s Diversity Index
To determine whether the differences in cell frequency distribution across the 56 cell clusters (Figure 3A) were predictive of outcome, we performed a Simpson’s diversity analysis, an algorithm used for determining the number of species and their abundance in eco-systems and applied to a CyTOF study of natural killer (NK) cells (Horowitz et al., 2013). A higher Simpson’s diversity index, indicating greater tumor diversity, correlated with relapse within a year irrespective of whether vimentin-expressing cells were included (p = 0.005) or excluded (p = 0.008) from the computation (Figure 3D) and indicates that the diversity resides principally in the E-cadherin-expressing tumor cells.
Identification of Pre-existing Cell Subsets Associated with Relapse
After surgery, all HGSOC patients in this cohort were treated with a platinum-based therapeutic regimen. Within a year, six patients relapsed, but none of the DC or EV clusters correlated with this outcome (Figure 3A). However, tumor samples from relapse patients contained more vimentin-expressing cells (vimentin clade), consistent with poor prognosis (p = 0.014) (Figure S8). Furthermore, analysis of the vimentin clade uncovered a subpopulation of cells associated with relapse that co-expressed cMyc and HE4. This was corroborated by manual gating (p = 0.01) (Figures 4A and 4B). Kaplan-Meier analysis was performed to determine whether the pre-existing vimentin/cMyc/HE4 cells were linked to patient survival. Patients’ tumors were divided into two groups based on the presence of vimentin/cMyc/HE4 cells above and below a 3% cell frequency threshold computed by k-means clustering. The plots showed that patients with tumors having a frequency of vimentin/HE4/cMyc cells > 3% were more likely to proceed to relapse after carboplatin treatment (p = 0.002, hazard ratio [HR] = 0.17) (Figure 4C).
Figure 4. Novel Cell Phenotype Co-expressing Vimentin/cMyc/HE4, and Prognosis in HGSOC.
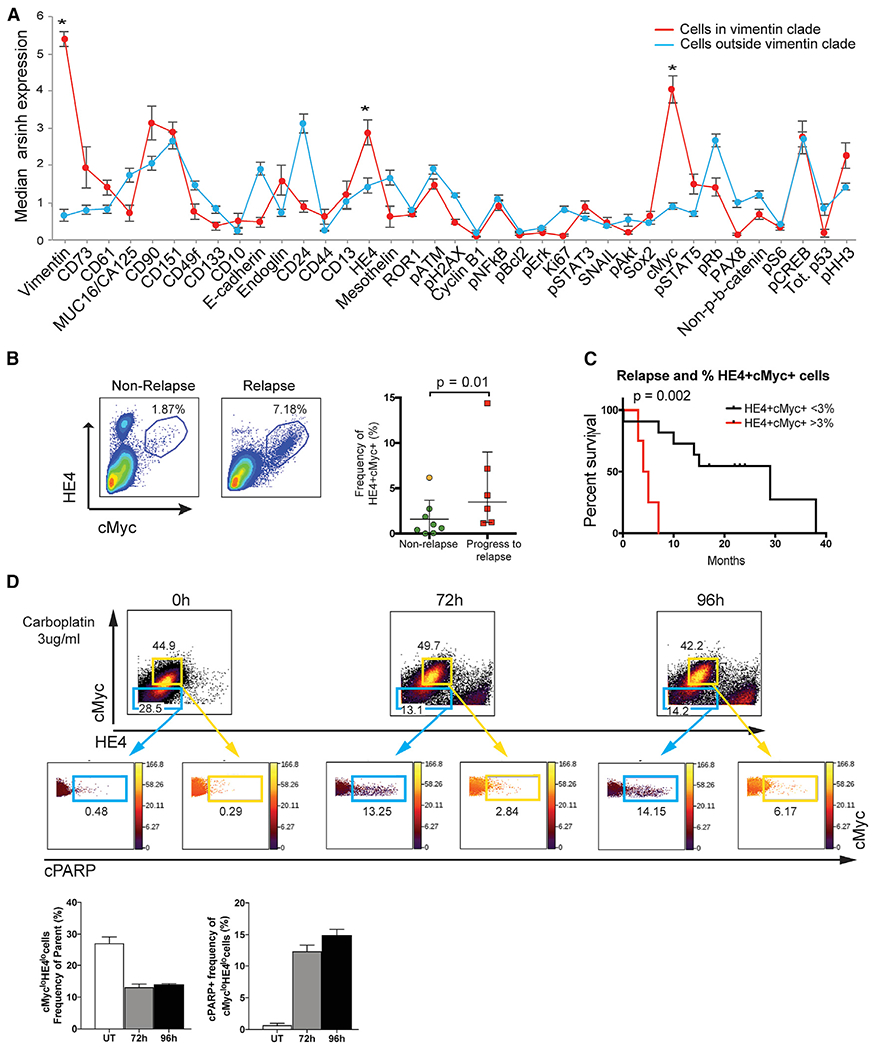
(A) Median protein expression levels (95% confidence intervals) for cells inside and outside the vimentin clade (red and blue plots, respectively). Vimentin (p = 1.62 × 10⁻³⁰), HE4 (p = 0.0007), and cMyc (p = 2.3 × 10⁻¹⁰) were expressed at significantly greater levels in the vimentin clade (asterisks) compared to all other tumor cells.
(B) Manual gating (representative samples shown) from the tumor cell parent population confirmed the presence of more cells co-expressing HE4 and cMyc in samples from patients that relapsed within 1 year (n = 6) versus those that did not (n = 8). The plot shows median and interquartile range for frequency of cell co-expressing HE4 and cMyc. The orange dot indicates a patient that relapsed in 13 months.
(C) Kaplan-Meier curves depict differences in time to relapse for HGSOC samples with >3% cMyc/HE4 cells (log rank test, p = 0.0005).
(D) TYK-nu cells were plated in 10 cm dishes and were untreated (UT) or exposed continuously to carboplatin (3 μg/mL) for 72 or 96 hr, respectively. Each 10 cm dish of cells was processed for CyTOF as described in Experimental Procedures. Flow plots show cells gated as cMyclo/HE4lo and cMychi/HE4hi populations (blue and yellow out lines, respectively). Levels of cPARP are shown for each of these populations. The bar charts depict the mean frequency of cMyclo/HE4locells after carboplatin exposure (left) and their concomitant increases in cPARP (right). SDs are shown.
See also Figure S8.
Evaluating the Role of HE4 and cMyc in Carboplatin Resistance
To evaluate further a mechanistic role for carboplatin resistance in cells co-expressing vimentin, HE4, and cMyc, the TYK-nu HGSOC cell line was selected. It bore strictly mesenchymal traits, based on expression of vimentin and lack of detectable E-cadherin, and co-expressed high levels of cMyc and HE4. TYK-nu cells were cultured in the continuous presence of carboplatin for 72 or 96 hr (Experimental Procedures). After CyTOF analysis and traditional flow cytometry gating, two main subpopulations of TYK-nu cells were revealed that co-expressed vimentin with either low (lo) cMyclo/HE4lo or high (hi) cMychi/HE4hi (Figure 4D, blue and yellow gates, respectively). In the absence of carboplatin treatment, the mean frequency of cMyclo/HE4lo cells was 27%, and it fell to 13% and 14% after continuous exposure to carboplatin for 72 and 96 hr, respectively. Concomitantly, levels of cPARP increased in this subpopulation from 0.5% in the absence of carboplatin to 12% and 14% at 72 and 96 hr continuous exposure, respectively, demonstrating a drug-responsive apoptotic trajectory in cMyclo/HE4lo cells (Figure 4D). By contrast, the mean frequency of cMychi/HE4hi cells after carboplatin exposure did not change significantly (range of 42%–50% for untreated and treated). Their lack of drug responsiveness was further demonstrated by the low frequency of cells expressing cPARP (mean frequency of 0.33% with the absence of carboplatin to 2.5% and 7% at 72 and 96 hr continuous exposure, respectively). These data are consistent with our patient tumor data, in which the frequency of cells co-expressing vimentin with high levels of cMyc and HE4 is correlated with early relapse, presumably attributable to carboplatin resistance.
Correlation Analyses between HGSOC Clusters
Our unsupervised CyTOF data analysis allowed us to identify cell subsets that were present across multiple tumors. To gain a greater understanding of their relationships to one another and the changes a cell needs to undergo for metastatic conversion, we performed a network analysis to compare changes in correlations between specific cell types occurring in non-relapse and relapse samples (Hotson et al., 2016; Ideker and Krogan, 2012; Spitzer et al., 2017). Pairwise Spearman correlation co-efficients were calculated, hierarchically clustered, and organized on a heatmap using the following parameters for every sample: (1) cell frequency in the 56 X-shift clusters, (2) cell frequency in the vimentin clade, (3) cell frequency in the HE4/cMyc manual gate, (4) total tumor cell frequency, and (5) Simpson’s diversity index (Figure 5A). Although many correlations between the tumor cell types were interspersed within the non-relapse and relapse heatmaps, co-ordinated modules of correlations were evident. Specifically, pairwise correlations were predominantly negative for non-relapse samples (Figure 5B, block I) but overall were positive for the relapse samples (Figure 5C, block I). Pairwise positive correlations (rs > 0.75) for relapse samples in block I were observed between cell frequencies in EV clusters 1–4, with a subgroup of E-cadherin-expressing (including DC5–DC7) and vimentin-expressing clusters. The frequency of cells in EV3 and EV4 was positively correlated with the frequency of cells in the vimentin clade. Thus, a switch from negative (non-relapse) to positive (relapse) correlations between E-cadherin clusters and vimentin clusters involves EV cells, which suggests a change in the tumor microenvironment where the metastatic trajectory in the EV cells is facilitated. By contrast, for block II, there were minimal differences in the correlations between the two patient outcomes and a notable absence of EV cluster correlations.
Figure 5. Correlations Heatmaps between Non-relapse and Relapse Patients.
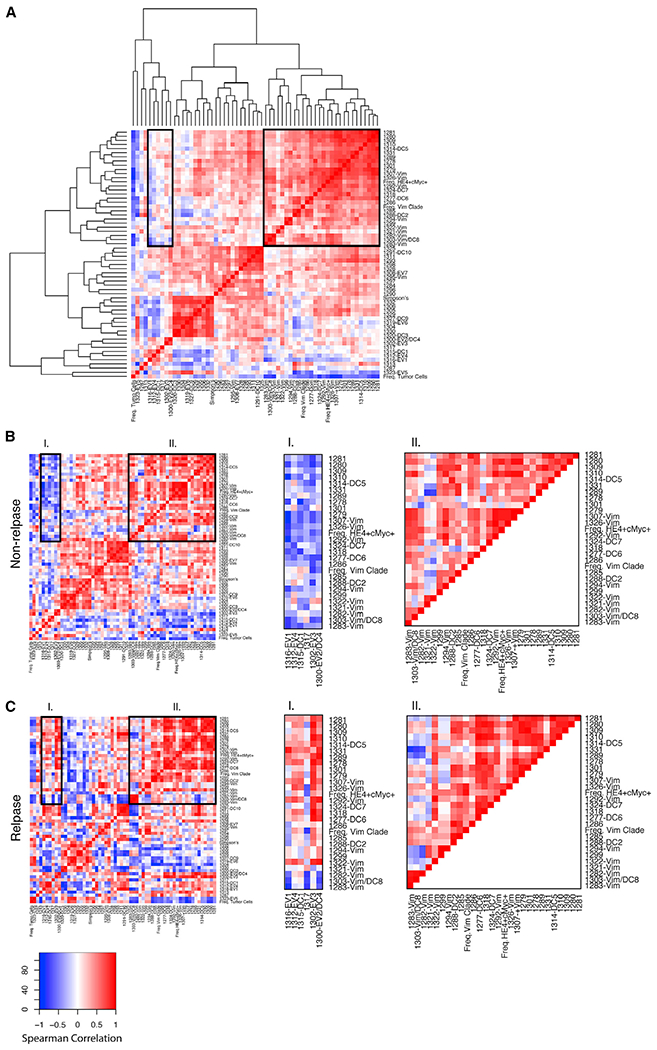
(A) Pairwise correlations and hierarchical clustering were performed to generate a parent heatmap with the parameters described in the text.
(B) Correlation heatmaps for non-relapse patients.
(C) Correlation heatmaps for relapse patients. Row order for (B) and (C) was imposed from hierarchical clustering of the parent heatmap (A). Two blocks of correlated modules were visually selected (black boundaries) to show differences (block I) and similarities (block II) between non-relapse and relapse patients. The colored scale shows Spearman correlation co-efficients.
DISCUSSION
Genetic instability and clonal diversity characterize cancer cells and are a means by which tumors evolve and adapt to their microenvironment (Greaves, 2015; Marusyk et al., 2012; Schwarz et al., 2015). As postulated by the quasi-species model of cancer development, constraints must exist that limit the extent of phenotypic diversity to allow tumor survival (Brumer et al., 2006). We have now shown that multiparameter single-cell CyTOF is well suited for understanding of the extent of tumor diversity. The major findings from our CyTOF study are the identification of rare HGSOC cell types recurring across the tumors, all of which would have been lost by bulk processing. Specifically, in each tumor, we identified (1) a dominant cell population, (2) EV cells with a potential role in EMT, and (3) cells co-expressing vimentin or HE4 and cMyc that correlated with poor prognosis. The revealed cell phenotypes, as well as identification of potential therapeutic targets (cell-cycle proteins, pCREB, and cMyc), present a re-evaluation of HGSOC.
Among the cell subtypes identified were ten DCs (Figures 3A–3C). The most striking finding for the DCs was that protein expression patterns for intracellular proteins showed low variability, while the clustering (mostly surface) proteins were more variable (Figure 3A). Although surface markers are often used to molecularly subclassify many tumors, measurements of intracellular signaling may be a truer reflection of disease state (Levine et al., 2015; Vogelstein et al., 2013). Specifically, the observed higher expression of pCREB and pRb in the DCs suggest a key role for these signaling molecules in ovarian cancer, as well as offering potential new therapeutic targets.
A second cell phenotype identified here involved seven EV cell clusters indicative of stabilized hybrid EMT phenotypes with the potential for metastatic conversion. These data also show the ability of CyTOF to discern subtle differences in closely related cell subtypes (Figures 2A–2C; Figure S1). The existence of an EV hybrid state has been described in ovarian cancer cell lines and inferred in HGSOC tumors based on a gene signature (Huang et al., 2013; Jolly et al., 2015, 2017), provising direct evidence of their existence in primary HGSOC tumors. The prospect of isolating EV cells by fluorescence-activated cell sorting (FACS) presents an opportunity to evaluate their roles in self-renewal, anoikis, metastasis, and therapeutic resistance (Davidson et al., 2012; Huang et al., 2013; Shibue and Weinberg, 2017; Ye and Weinberg, 2015).
A third cell phenotype pre-existing at low frequency (range < 1%–15%) in the tumors co-expressing vimentin/cMyc/HE4 and was identified in all 17 tumors. Revealing the presence of these low-frequency cells again supports the great value of single-cell analysis as enabled by CyTOF. Higher frequencies of these cells correlated with a significantly greater rate of relapse after carboplatin therapy (Figures 4B and 4C). In a follow-up experiment to elucidate the role of this cell phenotype in relapse and/or platinum resistance, we exposed the HGSOC TYK-nu cell line to carboplatin. We demonstrated that of two subpopulations co-expressing vimentin with either cMyclo/HE4lo or cMychi/HE4hi, the latter were far more resistant to carboplatin (Figure 4D). These data indicate a potential role for cMyc and HE4 acting in concert in the development of carboplatin resistance and are consistent with our patient relapse data, as well as with the recognized roles of cMyc in drug resistance (Ganesan, 2011). Sorting of vimentin/cMyc/HE4 tumor cells could confirm whether they express the transcriptomic mesenchymal signature associated with an adverse prognosis (Bowtell et al., 2015; Konecny et al., 2014; Cancer Genome Atlas Research Network, 2011). A study is in progress to develop a relatively simple and reliable test to enumerate the cells co-expressing vimentin/cMyc/HE4 for predicting response to carboplatin and/or extent of surgical debulking (Borley et al., 2012; Riester et al., 2014). In addition, these HGSOC patients may be good candidates for BrD4 inhibitors, small molecules known to disrupt cMyc function (Filippakopoulos and Knapp, 2014).
In addition, analysis of our data using the Simpson’s diversity index showed that relapse cases had higher values and that the diversity resided principally within the E-cadherin-expressing (epithelial) tumor cell compartment (Figure 3E). Our results suggest that when a certain threshold of diversity in the epithelial tumor cell compartment is crossed, opportunities for metastatic conversion are increased. This agrees with data from other studies showing that increased tumor diversity is associated with poor survival (Schwarz et al., 2015; Tabassum and Polyak, 2015).
To assess how differences in tumor cell diversity influence changes in tumor cell organization, we undertook a pairwise Spearman correlation analysis and determined whether cell clusters close to a metastatic trajectory (EV) changed in concert with other cell clusters (Figure 5). In the more diverse relapse samples, positive correlations were identified between EV cell clusters and subsets of both E-cadherin- and vimentin-expressing clusters. These results supports a role for EV cells transitioning between the two compartments and, based on the clinical data, the equilibrium moving toward metastatic conversion.
In this study, we identified cell phenotypes that co-occurred across tumors with potentially critical roles in metastasis and relapse. These cells can be isolated from individual tumors and studied further, with the aim of targeted individualized therapies for HGSOC patients.
EXPERIMENTAL PROCEDURES
Ovarian Cancer Cell Lines
Kuramochi and TYK-nu cell lines (National Institute of Biomedical Innovation, Japanese Collection of Research Bioresources Cell Bank) were cultured in RPMI-1640 plus 2 mM L-glutamine (Gibco, Invitrogen) and Eagle’s minimal essential medium (EMEM) (American Tissue Culture Collection), respectively. The COV362 cells (Sigma-Aldrich) were cultured in DMEM (Gibco, Invitrogen). All media were supplemented with 10% heat-inactivated fetal bovine serum (FBS) and 100 U/mL penicillin (Gibco, Invitrogen). Cells were split every 2–3 days and kept in a humidified cell culture incubator at 37°C with 5% CO2.
Genomic Sequencing and Analysis for BRCA1/2 and TP53
DNA was extracted and enriched through multiplex PCR (QIAGEN QIAmp DNA Mini Kit and QIAGEN GeneRead DNaseq Targeted Ovarian V2 Panel, respectively). TrueSeq protocol was used to make an indexed Illumina sequencing library from the pooled sample amplicons. Individual sample libraries were quantitated (Qubit, Thermo Fisher Scientific), and size distribution was checked (BioAnalyzer 2100, Agilent). Pooled, normalized libraries were sequenced (Illumina MiSeq). Fastq files were generated and aligned to the HG19 build of the human genome using Burrows-Wheeler aligner (Li and Durbin, 2009). Gene variants were assessed using the Genome Analysis Toolkit (GATK) framework (McKenna et al., 2010). Pathogenic gene variants were identified using SnpEff (Cingolani et al., 2012) and annotations in dbSNP (https://www.ncbi.nlm.nih.gov/SNP) and the IARC TP53 database (http://p53.iarc.fr).
Collection of Tumor Tissue
Deidentified primary tumor samples prepared for CyTOF were purchased from Indivumed (Hamburg, Germany) over 2 years with a minimum 1-year follow-up. Two patients were lost to follow-up, and one patient died during surgery through unknown causes. This study was conducted in compliance with the Helsinki Declaration, and all patients gave written informed consent. The use of human tissue was approved and in compliance with data protection regulations regarding patient confidentiality. All patients included in the study were diagnosed with ovarian cancer. Institutional review board approval was obtained at the Physicians Association in Hamburg, Germany.
Tissue Dissociation to Prepare Single Cells
Tumor tissues were collected according to standard operating procedures to maintain sample quality while minimizing time from resection to processing. For this study, times ranged range from 2 to 5 hr, with a median of 3.5 hr. The dissociation procedure was developed at Stanford and transferred to Indivumed. The time post-resection to tumor dissociation includes placing the tumor chunk within minutes into ice-cold preservation media known to preserve phosphoproteins (Unger et al., 2015a, 2015b) for the transit time to the laboratory, where the single-cell dissociation protocol (~90 min) is performed. After surgical resection, tissue samples were transferred directly to tissue transport and preservation medium DMEM/F12 was supplemented with 10% fetal calf serum (FCS), 2 mM L-glutamine, 1% minimum essential medium (MEM) vitamins, 3% penicillin/streptomycin, 0.6% gentamicin (all from Pan Biotech), 5 μg/mL transferrin, 12.5 μg/mL fetuin, and 20 μg/mL insulin (all from Sigma-Aldrich) at 4°C–8°C and transported to the laboratory for immediate processing. After removal of fat and necrotic areas, tumor samples were chopped into small pieces for mechanical and enzymatic dissociation using settings for soft tumor dissociation on a GentleMACS Dissociator and human tumor dissociation kit (Miltenyi). Resulting single-cell suspensions were filtered through 100 and 70 μm meshes (BD Biosciences). Samples with cell viability < 60% (determined by trypan blue staining) were not included in this study, for which median viability was 74% (range of 62%–90%). Samples were then exposed to cisplatin, a live-dead exclusion marker for CyTOF (P4394, Sigma-Aldrich) (Fienberg et al., 2012). After washing, the cell pellet was resuspended and fixed in 5 mL Hank’s buffered salt solution with paraformaldehyde (PFA) at a final concentration of 1.6% (Electron Microscopy Sciences) and incubated for 10 min at room temperature. Subsequently, 5 mL of cell-staining medium (CSM) (PBS with 0.5% BSA and 0.02% NaN3) was added, the sample was centrifuged for at 2,000 rpm for 3 min, supernatants were discarded, and cell pellets were washed twice before suspension in CSM (5 × 10⁶ cells per 0.5 mL) and then flash frozen and stored at −80°C.
Immunohistochemistry
Unstained slices (Indivumed) were from a location adjacent to the tumor piece used for single-cell dissociation. Tissue quality with low levels of necrosis was confirmed by an expert pathologist. Antigen retrieval was performed using a Decloaking Chamber (Biocare Medical) in citrate buffer at pH 6.0 at 125°C and 15 psi for 45 min. Incubation with primary antibodies was overnight at room temperature in a humidified chamber (Table S1). A Vectastain ABC Kit Elite and a Peroxidase Substrate Kit DAB (both from Vector Labs) were used for amplification and visualization of signal, respectively. Tissues known to express an antigen were used as positive controls. Antibody deletion controls were used for each antigen to confirm specific staining. All stained slides were scanned and digitized using the Aperio ScanScope AT Turbo to capture digital whole-slide images with a 20× objective lens and stored in the Aperio Spectrum Database. Quantitative image analysis was performed using Spectrum v.10 and v.11, based on the U.S. Food and Drug Administration (USFDA)-approved algorithms supplied by the manufacturer.
Antibodies for CyTOF
Antibodies (Table S3) in carrier-free PBS were conjugated to metal-chelated polymers (MaxPAR antibody conjugation kit, Fluidigm) according to the manufacturer’s protocol. Antibody conjugation to bismuth was carried out using a recent protocol (Han et al., 2017). Metal-labeled antibodies were diluted to 0.2–0.4 mg/mL in antibody stabilization solution (CANDOR Biosciences) and stored at 4°C. Each antibody was titrated using cell lines and primary human samples as positive and negative controls. Antibody concentrations in experiments were based on an optimal signal-to-noise ratio (at least 2-fold for the phospho-antibodies and >6-fold for all other antibodies). Labeled 166Er-CD44 and 89Y-CD45 were purchased from Fluidigm. A pilot run of the entire panel was performed on three dissociated tumor samples.
Sample Processing and Antibody Staining for CyTOF
Frozen, fixed single-cell suspensions of ovarian tumors and control ovarian cancer cell lines were thawed at room temperature. For each sample, 1 × 10⁶ cells were aliquoted into individual tubes and subjected to pre-permeabilization palladium barcoding as previously reported (Behbehani et al., 2014; Zunder et al., 2015). After barcoding, pooled cells were centrifuged and the cell pellet was incubated for 5 min at room temperature with FcX block (Biolegend) to block non-specific Fc binding. Cells were incubated with antibodies and processed for CyTOF as previously described (Bendall et al., 2011; Gaudillière et al., 2014; O’Gorman et al., 2015). Before loading into a CyTOF2 instrument (Fluidigm), cells were resuspended with a solution of normalization beads (Finck et al., 2013).
Assay Performance
CyTOF assay reproducibility was determined from tumor sample replicates in three experimental settings. In the first pilot experiment (performed in 2014), duplicates for ten samples were assayed on 2 separate days (data not shown). In the second experiment (performed in 2015 and the basis of this report), 22 samples were similarly assayed across 2 weeks. In a third experiment (2016), a subset of the 22 samples (11) was reassayed as additional quality control for long-term sample storage (Figure S2). Results were not influenced by batch effects, because samples assayed together did not group together in any of our analyses.
Evaluating the Role of HE4 and cMyc in Carboplatin Resistance
TYK-nu cells were cultured under conditions described earlier. Cell growth inhibitory effects of carboplatin (Sigma-Aldrich) were studied using the MTT assay (3-(4,5-dimethylthiazol-2-yl)-2,5-diphenyltetrazolium bromide) (Life Technologies). Carboplatin concentrations were chosen based on serum concentrations determined in patients (Arakawa et al., 2001) and our MTT half maximal inhibitory concentration (IC50) values (data not shown). TYK-nu cells plated into 10 cm dishes were exposed continuously to 3 μg/mL carboplatin for either 72 or 96 hr in triplicate. All cells were harvested and bar-coded for CyTOF using procedures described earlier.
Algorithms and Data Analysis: Debarcoding
In an adaptation of the single-cell debarcoding algorithm for CyTOF data (Zunder et al., 2015), a single-cell debarcoding algorithm was written specifically for the HGSOC samples we analyzed, because they had highly varying cell sizes (e.g tumor versus immune cells). For the algorithm developed here, outliers are filtered out by applying a Pearson’s correlation (r) for barcode intensity of an individual cell to the centroid of each barcoded population. This differs from the previously reported Mahalonobis distance. Unlike the Mahalonobis distance, Pearson’s r is a scaling-invariant measure, meaning that Pearson’s r for two vectors remains the same when vectors are multiplied by a scalar. Invariance to vector scaling is a desirable property, because depending on their size, cells tend to absorb varying amounts of barcoding reagents and the aim was to achieve equivalent filtering for cells of all sizes. The debarcoding algorithm developed here entailed the following steps. First, the signal intensities of each barcoding channel were rescaled so that the 15th percentile became 0 and the 85th percentile became 1.0. Next, cells was assigned to a sample based on their maximum correlation to a barcode key. Then, the average intensity for the barcode channels was computed for each sample, thus creating a sample centroid vector. For each cell event, four filtering parameters were computed, which were designed to collectively identify debris, doublets, and misassigned cell events. The parameters were (1) sum of squares of barcoding channel intensities (low values, particularly those less than 1.0, are indicative of debris and removed), (2) a ratio of less than 2.0 for the averages between positive and negative barcode channels (low values, particularly less than 2.0, are indicative of doublets), (3) a Z score separation between positive and negative channels (low values, particularly those less than 2.4, are indicative of doublets), and (4) a correlation of the barcode channel profile to the sample centroid (low values, particularly those below 0.7, are indicative of cells incorrectly assigned to a given sample). Debarcoded cell events from each sample, after application of the four filtering parameters, were written into separate FCS flies (one per sample). The files were analyzed in Cytobank (http://www.cytobank.org/).
Initial Assessment of Data Quality and Gating
Initial data quality was determined using traditional cytometry statistics and visualization, such as histograms, dotplots, and heatmaps, with software available from Cytobank (Kotecha et al., 2010). Tumor cells gated as CD45–/CD31–/FAP– were used for further computationally driven analysis (Figure S3).
Clustering
The raw CyTOF data were subject to arsinh(x/5) transformation. Manually gated tumor cells from each sample were pooled together for clustering, resulting in ~800,000 cells. These cells were clustered with a density-based clustering method termed X-shift (Samusik et al., 2016). X-shift was developed to compute large multidimensional datasets and to automatically select the optimal number of cell clusters. X-shift uses the weighted K-nearest-neighbor density estimation to find the local maxima of data-point (cell event) density in a multidimensional marker space. X-shift computes the density estimate for each data point and then searches for the local density maxima, which become cell cluster centroids in a nearest-neighbor graph. The remaining data points are then connected to the centroids via density-ascending paths in the graph, thus forming cell clusters. Finally, the algorithm checks for the presence of density minima on a straight-line segment between the neighboring centroids, merging closely aligned cell clusters as necessary. Clusters separated by a Mahalanobis distance less than 2.0 were merged. The optimal nearest-neighbor parameter, K, was automatically selected to be 35 from the elbow point in a plot of the number of cell clusters versus K. All data processing was performed with the VorteX clustering environment (http://web.stanford.edu/~samusik/vortex).
MSTs
MSTs were generated by creating a graph in which all cell clusters were represented as nodes and edge weights were given by the angular distance between the median marker expression vectors, consecutively applying the standard reverse-delete algorithm on that graph (Kruskal, 1956). Layout and visualization were performed using the Gephi Toolkit 0.8.7 library. In the MST visualizations, cell clusters are arranged based on the similarity of their protein co-expression levels (Figures 2A, 2B, and 2D). Because cycles or loops are disallowed by the algorithm (MSTs are branched), clusters may be close to each other in multidimensional space yet appear farther from each other in the 2D tree representations. However, clusters on the MST that are adjacent to each other are also close in multidimensional space.
Dendrograms
Dendrograms based on the cell frequency distribution within MST clusters were generated using hierarchical agglomerative clustering implemented in the VorteX clustering environment (http://web.stanford.edu/~samusik/vortex) using an arccosine distance metric and average linkage (Figure 3A).
Statistical Analysis
All statistical analyses were performed in Microsoft Excel, Prism, and R.
Relapse versus Non-relapse Plots
One-tailed Student’s t tests (uneven sample size and uneven variance) were performed on ranked transformed values due to non-normal distribution of the data. Tests were performed on eight non-relapse HGSOC samples and six that proceeded to relapse within 1 year. Three HGSOC samples were excluded from the analysis due to unavailable follow-up information (two patients lost to follow-up and one patient died during surgery from unknown causes).
Kaplan-Meier Analysis
Kaplan-Meier curves were plotted in prism. HGSOC tumor samples were stratified for time to relapse based on the presence of cMyc/HE4 cells within a sample using cell frequency thresholds computed either by k-means clustering or the median value after dividing the samples into two groups. Using a multivariate Cox-proportional hazards model, co-variates (age, weight, CA125 blood levels, and BMI) were shown to have minimal effects on the stratification (data not shown). The hazard ratio was calculated with 95% confidence intervals.
Simpson’s Diversity Index
The Simpson’s diversity index of the jth tumor sample was computed as , which sums each ith cluster, where i lies between 1 and k, with k being the total number of clusters. nij is the number of cells in the ith cluster that belong to the jth sample, and Nj is a total number of cells in the jth sample. The Simpson’s diversity index did not correlate with either age or CA125 levels, r = 0.13 or −0.23, respectively (data not shown).
Correlation Network Analyses
For this analysis, performed in R, pairwise Spearman correlation co-efficients were calculated for all samples among the following parameters: (1) cell frequency for the 56 X-shift clusters, (2) frequency of cells in the vimentin clade, (3) frequency of manually gated HE4 and cMyc cells, (4) total tumor cell frequency, and (5) Simpson’s diversity index. A heatmap was generated and organized from the hierarchical clustering of the Spearman correlation co-efficients. Using the row order from this parent matrix, the correlations were computed again for eight non-relapses and six relapse samples to produce two heatmaps (Figure 5). Modules I and ll were depicted manually.
Supplementary Material
Highlights.
Cell types identified by CyTOF recur across newly diagnosed HGSOC tumors
Greater frequency of vimentin/cMyc/HE4 cells correlates with poor prognosis
A transitional EMT phenotype identified co-expressing E-cadherin and vimentin (EV)
In relapse patients, EV cells are positively correlated with a metastatic trajectory
ACKNOWLEDGMENTS
We thank Drs. James Brenton, Sylvia Plevritis, Margaret Shipp, and David Donner for critical discussions and reading the manuscript. We thank Dr. Eric Collisson, Dr. Jessica Van Ziffle, and John Greer for help with DNA sequencing. We thank Astraea Jager, Gina Jager, Angelica Trejo, Dr. James Ghadiali, Dr. Robert Balderas, and Dr. Teri Longacre for technical contributions. This work was supported by the Ovarian Cancer Teal Innovator Award (to G.P.N. and W.J.F.) from the U.S. Department of Defense (OC110674 and W81XWH-14-1-0180) and by the NIH (grant U19AI100627-02 to G.P.N.). N.A. is supported by an Ann Schreiber Mentored Investigator Award from the Ovarian Cancer Research Fund (OCRF 292495), a Canadian Institute of Health Research (CIHR) Postdoctoral Fellowship (CIHR 321510), and an International Society for Advancement of Cytometry scholarship. E.S.S. is supported by a National Science Foundation Graduate Research Fellowship and the Gabilon Stanford Graduate Research Fellowship. T.J.K. is supported by the Chronic Lymphocytic Research Consortium (CRC).
Footnotes
DATA AND SOFTWARE AVAILABILITY
The accession number for the CyTOF data reported in this paper is Mendeley Data: https://doi.org/10.17632/k45dgfsbhf.1. The debarcoding algorithm for CyTOF data is available at https://github.com/nolanlab/ScaleInvDBV.
SUPPLEMENTAL INFORMATION
Supplemental Information includes nine figures and six tables and can be found with this article online at https://doi.org/10.1016/j.celrep.2018.01.053.
DECLARATION OF INTERESTS
The authors declare no competing financial interests. V.D.G., N.S., J.S.B., G.P.N., and W.J.F. have a pending patent application, U.S. patent 15/275,043.
REFERENCES
- Ahmed AA, Etemadmoghadam D, Temple J, Lynch AG, Riad M, Sharma R, Stewart C, Fereday S, Caldas C, Defazio A, et al. (2010). Driver mutations in TP53 are ubiquitous in high grade serous carcinoma of the ovary. J. Pathol 221, 49–56. [DOI] [PMC free article] [PubMed] [Google Scholar]
- Anchang B, Hart TD, Bendall SC, Qiu P, Bjornson Z, Linderman M, Nolan GP, and Plevritis SK (2016). Visualization and cellular hierarchy inference of single-cell data using SPADE. Nat. Protoc 11, 1264–1279. [DOI] [PubMed] [Google Scholar]
- Arakawa A, Nishikawa H, Suzumori K, and Kato N (2001). Pharmacokinetic and pharmacodynamic analysis of combined chemotherapy with carboplatin and paclitaxel for patients with ovarian cancer. Int. J. Clin. Oncol 6, 248–252. [DOI] [PubMed] [Google Scholar]
- Au-Yeung G, Lang F, Azar WJ, Mitchell C, Jarman KE, Lackovic K, Aziz D, Cullinane C, Pearson RB, Mileshkin L, et al. (2017). Selective targeting of cyclin E1-amplified high-grade serous ovarian cancer by cyclin-dependent kinase 2 and AKT inhibition. Clin. Cancer Res 23, 1862–1874. [DOI] [PMC free article] [PubMed] [Google Scholar]
- Baldwin LA, Hoff JT, Lefringhouse J, Zhang M, Jia C, Liu Z, Erfani S, Jin H, Xu M, She QB, et al. (2014). CD151-α3β1 integrin complexes suppress ovarian tumor growth by repressing slug-mediated EMT and canonical Wnt signaling. Oncotarget 5, 12203–12217. [DOI] [PMC free article] [PubMed] [Google Scholar]
- Behbehani GK, Thom C, Zunder ER, Finck R, Gaudilliere B, Fragiadakis GK, Fantl WJ, and Nolan GP (2014).Transient partial permeabilization with saponin enables cellular barcoding prior to surface marker staining. Cytometry A 85, 1011–1019. [DOI] [PMC free article] [PubMed] [Google Scholar]
- Bendall SC, Simonds EF, Qiu P, Amir E-AD, Krutzik PO, Finck R, Bruggner RV, Melamed R, Trejo A, Ornatsky OI, et al. (2011). Single-cell mass cytometry of differential immune and drug responses across a human hematopoietic continuum. Science 332, 687–696. [DOI] [PMC free article] [PubMed] [Google Scholar]
- Bjornson ZB, Nolan GP, and Fantl WJ (2013). Single-cell mass cytometry for analysis of immune system functional states. Curr. Opin. Immunol 25, 484–494. [DOI] [PMC free article] [PubMed] [Google Scholar]
- Borley J, Wilhelm-Benartzi C, Brown R, and Ghaem-Maghami S (2012). Does tumour biology determine surgical success in the treatment of epithelial ovarian cancer? Asystematic literature review. Br. J. Cancer 107, 1069–1074. [DOI] [PMC free article] [PubMed] [Google Scholar]
- Bowtell DD, Böhm S, Ahmed AA, Aspuria PJ, Bast RC Jr., Beral V, Berek JS, Birrer MJ, Blagden S, Bookman MA, et al. (2015). Rethinking ovarian cancer II: reducing mortality from high-grade serous ovarian cancer. Nat. Rev. Cancer 15, 668–679. [DOI] [PMC free article] [PubMed] [Google Scholar]
- Brumer Y, Michor F, and Shakhnovich EI (2006). Genetic instability and the quasispecies model. J. Theor. Biol 241, 216–222. [DOI] [PubMed] [Google Scholar]
- Cancer Genome Atlas Research Network (2011). Integrated genomic analyses of ovarian carcinoma. Nature 474, 609–615. [DOI] [PMC free article] [PubMed] [Google Scholar]
- Chen GM, Kannan L, Geistlinger L, Kofia V, Safikhani Z, Gendoo DMA, Parmigiani G, Birrer M, Haibe-Kains B, and Waldron L (2017). Consensus on molecular subtypes of ovarian cancer. Published online July 12, 2017. 10.1101/162685. [DOI] [PMC free article] [PubMed] [Google Scholar]
- Cingolani P, Platts A, Wang L, Coon M, Nguyen T, Wang L, Land SJ, Lu X, and Ruden DM (2012). A program for annotating and predicting the effects of single nucleotide polymorphisms, SnpEff: SNPs in the genome of Drosophila melanogaster strain w1118; iso-2; iso-3. Fly (Austin) 6, 80–92. [DOI] [PMC free article] [PubMed] [Google Scholar]
- Ciriello G, Miller ML, Aksoy BA, Senbabaoglu Y, Schultz N, and Sander C (2013). Emerging landscape of oncogenic signatures across human cancers. Nat. Genet 45, 1127–1133. [DOI] [PMC free article] [PubMed] [Google Scholar]
- Coscia F, Watters KM, Curtis M, Eckert MA, Chiang CY, Tyanova S, Montag A, Lastra RR, Lengyel E, and Mann M (2016). Integrative proteomic profiling of ovarian cancer cell lines reveals precursor cell associated proteins and functional status. Nat. Commun 7, 12645. [DOI] [PMC free article] [PubMed] [Google Scholar]
- Davidson B (2016). CD24 is highly useful in differentiating high-grade serous carcinoma from benign and malignant mesothelial cells. Hum. Pathol 58, 123–127. [DOI] [PubMed] [Google Scholar]
- Davidson B, Tropé CG, and Reich R (2012). Epithelial-mesenchymal transition in ovarian carcinoma. Front. Oncol 2, 33. [DOI] [PMC free article] [PubMed] [Google Scholar]
- Etemadmoghadam D, George J, Cowin PA, Cullinane C, Kansara M, Gorringe KL, Smyth GK, and Bowtell DD; Australian Ovarian Cancer Study Group (2010). Amplicon-dependent CCNE1 expression is critical for clonogenic survival after cisplatin treatment and is correlated with 20q11 gain in ovarian cancer. PLoS ONE 5, e15498. [DOI] [PMC free article] [PubMed] [Google Scholar]
- Fienberg HG, Simonds EF, Fantl WJ, Nolan GP, and Bodenmiller B (2012).A platinum-based covalent viability reagent for single-cell mass cytometry. Cytometry A 81, 467–475. [DOI] [PMC free article] [PubMed] [Google Scholar]
- Filippakopoulos P, and Knapp S (2014). Targeting bromodomains: epigenetic readers of lysine acetylation. Nat. Rev. Drug Discov 13, 337–356. [DOI] [PubMed] [Google Scholar]
- Finck R, Simonds EF, Jager A, Krishnaswamy S, Sachs K, Fantl W, Pe’er D, Nolan GP, and Bendall SC (2013). Normalization of mass cytometry data with bead standards. Cytometry A 83, 483–494. [DOI] [PMC free article] [PubMed] [Google Scholar]
- Ganesan S (2011). MYC, PARP1, and chemoresistance: BIN there, done that? Sci. Signal 4, pe15. [DOI] [PubMed] [Google Scholar]
- Gaudillière B, Fragiadakis GK, Bruggner RV, Nicolau M, Finck R, Tingle M, Silva J, Ganio EA, Yeh CG, Maloney WJ, et al. (2014). Clinical recovery from surgery correlates with single-cell immune signatures. Sci. Transl. Med 6, 255ra131. [DOI] [PMC free article] [PubMed] [Google Scholar]
- Greaves M (2015). Evolutionary determinants of cancer. Cancer Discov. 5, 806–820. [DOI] [PMC free article] [PubMed] [Google Scholar]
- Han G, Chen SY, Gonzalez VD, Zunder ER, Fantl WJ, and Nolan GP (2017). Atomic mass tag of bismuth-209 for increasing the immunoassay multiplexing capacity of mass cytometry. Cytometry A. 91, 1150–1163. [DOI] [PMC free article] [PubMed] [Google Scholar]
- Hemler ME (2014). Tetraspanin proteins promote multiple cancer stages. Nat. Rev. Cancer 14, 49–60. [DOI] [PubMed] [Google Scholar]
- Horowitz A, Strauss-Albee DM, Leipold M, Kubo J, Nemat-Gorgani N, Dogan OC, Dekker CL, Mackey S, Maecker H, Swan GE, et al. (2013). Genetic and environmental determinants of human NK cell diversity revealed by mass cytometry. Sci. Transl. Med 5, 208ra145. [DOI] [PMC free article] [PubMed] [Google Scholar]
- Hotson AN, Gopinath S, Nicolau M, Khasanova A, Finck R, Monack D, and Nolan GP (2016). Coordinate actions of innate immune responses oppose those of the adaptive immune system during Salmonella infection of mice. Sci. Signal 9, ra4. [DOI] [PubMed] [Google Scholar]
- Huang RY, Wong MK, Tan TZ, Kuay KT, Ng AH, Chung VY, Chu YS, Matsumura N, Lai HC, Lee YF, et al. (2013). An EMT spectrum defines an anoikis-resistant and spheroidogenic intermediate mesenchymal state that is sensitive to e-cadherin restoration by a src-kinase inhibitor, saracatinib (AZD0530). Cell Death Dis. 4, e915. [DOI] [PMC free article] [PubMed] [Google Scholar]
- Ideker T, and Krogan NJ (2012). Differential network biology. Mol. Syst. Biol 8, 565. [DOI] [PMC free article] [PubMed] [Google Scholar]
- Jiang SW, Chen H, Dowdy S, Fu A, Attewell J, Kalogera E, Drapkin R, Podratz K, Broaddus R, and Li J (2013). HE4 transcription- and splice variants-specific expression in endometrial cancer and correlation with patient survival. Int. J. Mol. Sci 14, 22655–22677. [DOI] [PMC free article] [PubMed] [Google Scholar]
- Jolly MK, Boareto M, Huang B, Jia D, Lu M, Ben-Jacob E, Onuchic JN, and Levine H (2015). Implications of the hybrid epithelial/mesenchymal phenotype in metastasis. Front. Oncol 5, 155. [DOI] [PMC free article] [PubMed] [Google Scholar]
- Jolly MK, Ward C, Eapen MS, Myers S, Hallgren O, Levine H, and Sohal SS (2017). Epithelial-mesenchymal transition, a spectrum of states: role in lung development, homeostasis, and disease. Dev. Dyn, Published online July 21,2017. 10.1002/dvdy.24541. [DOI] [PubMed] [Google Scholar]
- Köbel M, Piskorz AM, Lee S, Lui S, LePage C, Marass F, Rosenfeld N, Mes Masson AM, and Brenton JD (2016). Optimized p53 immunohistochemistry is an accurate predictor of TP53 mutation in ovarian carcinoma. J. Pathol. Clin. Res 2, 247–258. [DOI] [PMC free article] [PubMed] [Google Scholar]
- Konecny GE, Wang C, Hamidi H, Winterhoff B, Kalli KR, Dering J, Ginther C, Chen HW, Dowdy S, Cliby W, et al. (2014). Prognostic and therapeutic relevance of molecular subtypes in high-grade serous ovarian cancer. J. Natl. Cancer Inst 106, dju249. [DOI] [PMC free article] [PubMed] [Google Scholar]
- Kotecha N, Krutzik PO, and Irish JM (2010). Web-based analysis and publication of flow cytometry experiments. Curr. Protoc. Cytom 53, 10.17.1–10.17.24. [DOI] [PMC free article] [PubMed] [Google Scholar]
- Krogan NJ, Lippman S, Agard DA, Ashworth A, and Ideker T (2015). The cancer cell map initiative: defining the hallmark networks of cancer. Mol. Cell 58, 690–698. [DOI] [PMC free article] [PubMed] [Google Scholar]
- Kruskal JB (1956). On the shortest spanning subtree of a graph and the traveling salesman problem. Proc. Am. Math. Soc 7, 48–50. [Google Scholar]
- Krzystyniak J, Ceppi L, Dizon DS, and Birrer MJ (2016). Epithelial ovarian cancer: the molecular genetics of epithelial ovarian cancer. Ann. Oncol 27 (Suppl 1), i4–i10. [DOI] [PMC free article] [PubMed] [Google Scholar]
- Levine JH, Simonds EF, Bendall SC, Davis KL, Amir AD, Tadmor MD, Litvin O, Fienberg HG, Jager A, Zunder ER, et al. (2015). Data-driven phenotypic dissection of AML reveals progenitor-like cells that correlate with prognosis. Cell 162, 184–197. [DOI] [PMC free article] [PubMed] [Google Scholar]
- Li H, and Durbin R (2009). Fast and accurate short read alignment with Burrows-Wheeler transform. Bioinformatics 25, 1754–1760. [DOI] [PMC free article] [PubMed] [Google Scholar]
- Li J, Chen H, Mariani A, Chen D, Klatt E, Podratz K, Drapkin R, Broaddus R, Dowdy S, and Jiang SW (2013). HE4 (WFDC2) promotes tumor growth in endometrial cancer cell lines. Int. J. Mol. Sci 14, 6026–6043. [DOI] [PMC free article] [PubMed] [Google Scholar]
- Li J, Chen H, Curcuru JR, Patel S, Johns TO, Patel D, Qian H, and Jiang SW (2017). Serum HE4 level as a biomarker to predict the recurrence of gynecologic cancers. Curr. Drug Targets 18, 1158–1164. [DOI] [PubMed] [Google Scholar]
- Lu R, Sun X, Xiao R, Zhou L, Gao X, and Guo L (2012). Human epididymis protein 4 (HE4) plays a key role in ovarian cancer cell adhesion and motility. Biochem. Biophys. Res. Commun 419, 274–280. [DOI] [PubMed] [Google Scholar]
- Marusyk A, Almendro V, and Polyak K (2012). Intra-tumour heterogeneity: a looking glass for cancer? Nat. Rev. Cancer 12, 323–334. [DOI] [PubMed] [Google Scholar]
- Matulonis UA, Sood AK, Fallowfield L, Howitt BE, Sehouli J, and Karlan BY (2016). Ovarian cancer. Nat. Rev. Dis. Primers 2, 16061. [DOI] [PMC free article] [PubMed] [Google Scholar]
- McAllister SS, and Weinberg RA (2014). The tumour-induced systemic environment as a critical regulator of cancer progression and metastasis. Nat. Cell Biol 16,717–727. [DOI] [PMC free article] [PubMed] [Google Scholar]
- McKenna A, Hanna M, Banks E, Sivachenko A, Cibulskis K, Kernytsky A, Garimella K, Altshuler D, Gabriel S, Daly M, and DePristo MA (2010). The Genome Analysis Toolkit: a MapReduce framework for analyzing next-generation DNA sequencing data. Genome Res. 20, 1297–1303. [DOI] [PMC free article] [PubMed] [Google Scholar]
- Medrano M, Communal L, Brown KR, Iwanicki M, Normand J, Paterson J, Sircoulomb F, Krzyzanowski P, Novak M, Doodnauth SA, et al. (2017). Interrogation of functional cell-surface markers identifies CD151 dependency in high-grade serous ovarian cancer. Cell Rep. 18, 2343–2358. [DOI] [PubMed] [Google Scholar]
- Moore RG, Hill EK, Horan T, Yano N, Kim K, MacLaughlan S, Lambert-Messerlian G, Tseng YD, Padbury JF, Miller MC, et al. (2014). HE4 (WFDC2) gene overexpression promotes ovarian tumor growth. Sci. Rep 4, 3574. [DOI] [PMC free article] [PubMed] [Google Scholar]
- O’Gorman WE, Hsieh EW, Savig ES, Gherardini PF, Hernandez JD, Hansmann L, Balboni IM, Utz PJ, Bendall SC, Fantl WJ, et al. (2015). Single-cell systems-level analysis of human Toll-like receptor activation defines a chemokine signature in patients with systemic lupus erythematosus. J. Allergy Clin. Immunol 136, 1326–1336. [DOI] [PMC free article] [PubMed] [Google Scholar]
- Riester M, Wei W, Waldron L, Culhane AC, Trippa L, Oliva E, Kim SH, Michor F, Huttenhower C, Parmigiani G, and Birrer MJ (2014). Risk prediction for late-stage ovarian cancer by meta-analysis of 1525 patient samples. J. Natl. Cancer Inst 106, dju048. [DOI] [PMC free article] [PubMed] [Google Scholar]
- Samusik N, Good Z, Spitzer MH, Davis KL, and Nolan GP (2016). Automated mapping of phenotype space with single-cell data. Nat. Methods 13, 493–496. [DOI] [PMC free article] [PubMed] [Google Scholar]
- Schwarz RF, Ng CK, Cooke SL, Newman S, Temple J, Piskorz AM, Gale D, Sayal K, Murtaza M, Baldwin PJ, et al. (2015). Spatial and temporal heterogeneity in high-grade serous ovarian cancer: a phylogenetic analysis. PLoS Med. 12, e1001789. [DOI] [PMC free article] [PubMed] [Google Scholar]
- Shibue T, and Weinberg RA (2017). EMT, CSCs, and drug resistance: the mechanistic link and clinical implications. Nat. Rev. Clin. Oncol 14, 611–629. [DOI] [PMC free article] [PubMed] [Google Scholar]
- Spitzer MH, and Nolan GP (2016). Mass cytometry: single cells, many features. Cell 165, 780–791. [DOI] [PMC free article] [PubMed] [Google Scholar]
- Spitzer MH, Carmi Y, Reticker-Flynn NE, Kwek SS, Madhireddy D, Martins MM, Gherardini PF, Prestwood TR, Chabon J, Bendall SC, et al. (2017). Systemic immunity is required for effective cancer immunotherapy. Cell 168, 487–502.e15. [DOI] [PMC free article] [PubMed] [Google Scholar]
- Stewart JM, Shaw PA, Gedye C, Bernardini MQ, Neel BG, and Ailles LE (2011). Phenotypic heterogeneity and instability of human ovarian tumor-initiating cells. Proc. Natl. Acad. Sci. USA 108, 6468–6473. [DOI] [PMC free article] [PubMed] [Google Scholar]
- Tabassum DP, and Polyak K (2015). Tumorigenesis: it takes a village. Nat. Rev. Cancer 15, 473–483. [DOI] [PubMed] [Google Scholar]
- Tothill RW, Tinker AV, George J, Brown R, Fox SB, Lade S, Johnson DS, Trivett MK, Etemadmoghadam D, Locandro B, et al. ; Australian Ovarian Cancer Study Group (2008). Novel molecular subtypes of serous and endometrioid ovarian cancer linked to clinical outcome. Clin. Cancer Res 14,5198–5208. [DOI] [PubMed] [Google Scholar]
- Unger F, Bentz S, Kruger J, Rosenbrock C, Schaller J, Pursche K, Sprussel A, Juhl H, and David K (2015a). Precision cut cancer tissue slices in anti-cancer drug testing. J. Mol. Pathophysiol 4, 108. [Google Scholar]
- Unger FT, Krüger J, Juhl H, and David KA (2015b). Drug profiling in precision cut cancer tumor slices: analysis of therapeutic antibodies in colorectal cancer. Int. J. Cancer Immunol. Immun 1, 1–8. [Google Scholar]
- Vogelstein B, Papadopoulos N, Velculescu VE, Zhou S, Diaz LA Jr., and Kinzler KW (2013). Cancer genome landscapes. Science 339, 1546–1558. [DOI] [PMC free article] [PubMed] [Google Scholar]
- Wang ZC, Birkbak NJ, Culhane AC, Drapkin R, Fatima A, Tian R, Schwede M, Alsop K, Daniels KE, Piao H, et al. Australian Ovarian Cancer Study Group (2012). Profiles of genomic instability in high-grade serous ovarian cancer predict treatment outcome. Clin. Cancer Res 18, 5806–5815. [DOI] [PMC free article] [PubMed] [Google Scholar]
- Ye X, and Weinberg RA (2015). Epithelial-mesenchymal plasticity: a central regulator of cancer progression. Trends Cell Biol. 25, 675–686. [DOI] [PMC free article] [PubMed] [Google Scholar]
- Zhang S, Cui B, Lai H, Liu G, Ghia EM, Widhopf GF 2nd, Zhang Z, Wu CC, Chen L, Wu R, et al. (2014). Ovarian cancer stem cells express ROR1, which can be targeted for anti-cancer-stem-cell therapy. Proc. Natl. Acad. Sci. USA 111, 17266–17271. [DOI] [PMC free article] [PubMed] [Google Scholar]
- Zhang H, Liu T, Zhang Z, Payne SH, Zhang B, McDermott JE, Zhou JY, Petyuk VA, Chen L, Ray D, et al. CPTAC Investigators (2016). Integrated proteogenomic characterization of human high-grade serous ovarian cancer. Cell 166, 755–765. [DOI] [PMC free article] [PubMed] [Google Scholar]
- Zunder ER, Finck R, Behbehani GK, Amir E-AD, Krishnaswamy S, Gonzalez VD, Lorang CG, Bjornson Z, Spitzer MH, Bodenmiller B, et al. (2015). Palladium-based mass tag cell barcoding with a doublet-filtering scheme and single-cell deconvolution algorithm. Nat. Protoc 10, 316–333. [DOI] [PMC free article] [PubMed] [Google Scholar]
Associated Data
This section collects any data citations, data availability statements, or supplementary materials included in this article.