

Abstract
Population‐based studies that estimate awareness of nonalcoholic fatty liver disease (NAFLD) in the United States are scant. We aimed to understand public awareness of NAFLD and its temporal trends. Our study included 11,700 adults (18+ years old) from five National Health and Nutrition Examination Surveys (2007‐2016). NAFLD was determined by the improved Fatty Liver Index for the multiethnic U.S. population (US‐FLI) in the absence of secondary causes of liver disease. Overall prevalence of NAFLD, hepatitis C virus, and hepatitis B virus were 36.6%, 1.02% and 0.35%, respectively. From 2007‐2008 to 2015‐2016, awareness of liver disease among adults with NAFLD improved from 4.4% to 6.3% (trend P = 0.026) but 4 to 10 times lower than awareness about viral hepatitis. In 2015‐2016, among adults with NAFLD, awareness of liver disease was lower among young adults (aged 18‐29 years) compared with those aged ≥ 30 years (0% vs. 6.9%) and lower among non‐Hispanic Blacks compared with other races (0.7% vs. 6.6%) (all P < 0.001). In multivariable analysis, young adults (adjusted odds ratio [aOR] = 0.29; confidence interval [CI] 0.10‐0.87) and non‐Hispanic Blacks (aOR = 0.43; CI 0.20‐0.96) were negatively associated with awareness of liver disease among adults with NAFLD, whereas diabetes (aOR = 2.22; CI 1.37‐3.58), advanced fibrosis (aOR = 2.34; CI 1.17‐4.68), and a higher number of health care visits (aOR = 1.33; CI 1.15‐1.50) were positively associated with awareness of liver disease. Nearly 96% of adults with NAFLD in the United States were unaware they had liver disease, especially among young adults and non‐Hispanic Blacks. Findings indicate efforts are needed to improve awareness of NAFLD.
Abbreviations
- aOR
adjusted odds ratio
- ASCVD
atherosclerotic CVD
- BMI
body mass index
- CDC
Centers for Disease Control and Prevention
- CI
confidence interval
- CVD
cardiovascular disease
- FIB‐4
Fibrosis‐4 index
- FLI
Fatty Liver Index
- GGT
gamma‐glutamyltransferase
- HBsAg
hepatitis B surface antigen
- HBV
hepatitis B virus
- HCV
hepatitis C virus
- HOMA
homeostasis model assessment
- LT
liver transplantation
- NAFLD
nonalcoholic fatty liver disease
- NHANES
National Health and Nutrition Examination Survey
- PIR
poverty‐income ratio
- T2DM
type 2 diabetes mellitus
- US‐FLI
Fatty Liver Index for the multiethnic U.S. population
- VH
viral hepatitis
The global prevalence of nonalcoholic fatty liver disease (NAFLD) is 24%, accounting for nearly 1.8 billion individuals.( 1 ) NAFLD is the leading cause of chronic liver disease in the United States and in most developed and developing countries. In the United States, NAFLD accounts for 75% of all chronic liver diseases.( 2 ) NAFLD is the fastest increasing indication for liver transplantation (LT), in which, among LT etiologies, NAFLD recently outpaced hepatitis C virus (HCV) to emerge as the second‐leading LT indication—only after alcohol‐associated liver disease.( 3 ) The prevalence and burden of NAFLD is expected to continue to rise in parallel to the global epidemic of obesity and type 2 diabetes mellitus (T2DM) unless public health efforts are available to reverse the present trajectory.( 4 , 5 )
NAFLD can go undiagnosed for some time, as symptoms may only arise when the disease has progressed to advanced liver disease. Progression of NAFLD can lead to nonalcoholic steatohepatitis (NASH), with or without fibrosis, cirrhosis, and hepatocellular carcinoma (HCC).( 6 ) Although at this current time there are no medication‐based treatments specifically for NAFLD, a Mediterranean‐based diet and moderate exercise, which results in a weight loss of 5%‐10%, has been shown to cause reversal of hepatic steatosis and regression of fibrosis (if present).( 7 ) In addition, because the metabolic risks for NAFLD are similar to the metabolic risks for cardiovascular disease (CVD), CVD is the number‐one cause of mortality among those with NAFLD.( 8 )
In this context, treating the comorbidities associated with NAFLD such as T2DM and dyslipidemia remains part of the treatment of NAFLD and for the reduction of the risk for CVD.( 9 ) Finally, there are several medications that are showing promise in reversing fibrosis among those with NASH fibrosis.( 10 , 11 , 12 , 13 ) Therefore, as we learn more about NAFLD and treatments become available, being aware of NAFLD will become increasingly important. However, several studies have shown that awareness of having a liver disease is very low among patients with NAFLD (≤5%).( 14 , 15 , 16 , 17 ) All investigators of these studies concluded that broad public efforts are needed to increase awareness of NAFLD, its associated risk factors, and its potential adverse outcomes as a means of preventing the development of NAFLD—especially as treatments are limited.( 14 , 15 , 16 , 17 )
On the other hand, as treatments do become available, research has shown that awareness of having a liver disease is imperative to increasing uptake of treatment, as noted with the fight against hepatitis c virus (HCV). Empirical evidence demonstrated that low awareness was a major barrier among adults with HCV for care and treatment. As such, large‐scale public health education campaigns as well as guidelines from the Centers for Disease Control and Prevention (CDC) were developed to improve HCV awareness and to help denote when screening should be done.( 18 , 19 )
Therefore, it is important to continue to understand the level of awareness of NAFLD so that targeted interventions identifying those with NAFLD can be developed alongside the treatment evolution for NAFLD. Using repeated‐measures cross‐sectional data from the National Health and Nutrition Examination Survey (NHANES), we determined the level of NAFLD awareness overtime from 2007 to 2016. We also compared the prevalence of liver disease awareness among adults with viral hepatitis (VH) in the United States, another major cause of chronic liver disease.( 20 , 21 )
Patients and Methods
Study Design and Sampling Strategy
For this retrospective study, we combined and analyzed five cycles of data (e.g., 2007‐2008, 2009‐2010, 2011‐2012, 2013‐2014, and 2015‐2016) from NHANES. NHANES is a population‐based program of studies conducted by the National Center for Health Statistics (NCHS). To monitor the health and nutritional status of civilian, noninstitutionalized individuals in the United States, NCHS collects socio‐demographic, dietary, laboratory values, and medical data through interviews and physical examinations. The sampling frame for the current study consisted of 29,553 adults (≥ 18 years old) across the five cycles (2007‐2008 to 2015‐2016) of NHANES data (Fig. 1). After implementation of exclusionary criteria (e.g., incomplete or missing data on the following: awareness of liver disease questionnaire, hepatitis B surface antigen (HBsAg) or HCV RNA, waist circumference, gamma‐glutamyltransferase (GGT) activity, insulin, and glucose), the NAFLD cohort consisted of 11,700 adults, and the VH cohort consisted of 25,648 adults (Fig. 1). In both the NAFLD and VH cohorts, excluded subjects were more likely to be younger, non‐Hispanic Black, and low income (Supporting Table S1).
FIG. 1.
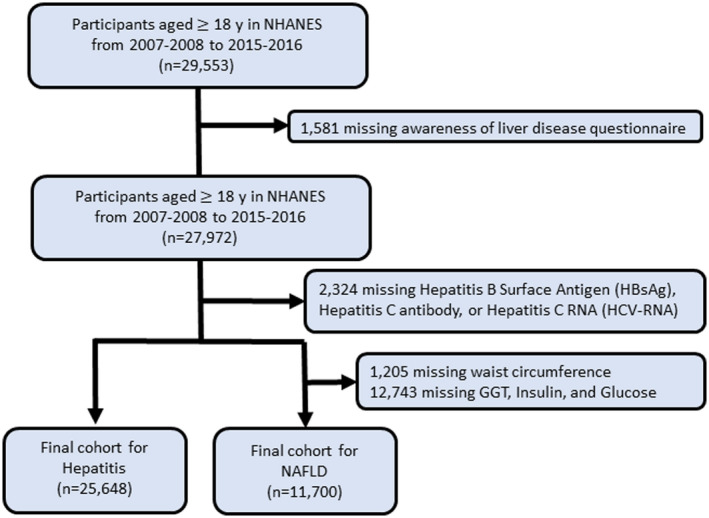
Flow diagram for patient study inclusion.
Outcomes of Interest
Primary outcomes of interest were the prevalence of and trends in awareness of liver disease among adults with NAFLD, as well as predictors of awareness of liver disease among adults with NAFLD. Secondary outcomes of interest for VH were identical to the primary outcomes of NAFLD. The improved US‐FLI, a noninvasive semi‐quantitative measure of hepatic steatosis, was calculated and used to determine which adults had NAFLD.( 22 ) The US‐FLI is a biochemical model that predicts the presence of fatty liver based on age, race/ethnicity, waist circumference, GGT activity, and fasting insulin and fasting glucose. The algorithm is as follows:
The US‐FLI has been previously validated with an area under the receiver operating characteristic curve of 0.80 (95% confidence interval [CI] 0.77‐0.83) for the detection of NAFLD in subjects with US‐FLI scores ≥ 30.( 22 ) In this study, subjects were presumed to have NAFLD if they had a US‐FLI score ≥ 30 in the absence of any other possible cause of chronic liver disease and excessive alcohol consumption. Women who self‐reported four or more drinks and men who self‐reported five or more drinks during a single occasion were defined as having excessive alcohol consumption.( 23 ) As a sensitivity analysis, NAFLD was also defined using a Fatty Liver Index (FLI) ≥ 60.( 21 ) VH was defined as a positive HCV RNA for HCV or positive HBsAg for HBV.
Adults who met the diagnostic criteria for NAFLD or who had positive HCV RNA or HBsAg but endorsed “no” on the single‐item NHANES question, “Has a doctor or health professional ever told you that you had any kind of liver condition?” were defined as having NAFLD or VH but being unaware that they had liver disease. Those who met the diagnostic criteria for NAFLD or who had positive HCV RNA or HBsAg and endorsed “yes” on the single‐item question were defined as having NAFLD or VH and being aware that they had liver disease.
Demographic Characteristics
Demographic characteristics included self‐reported age (years), sex, race/ethnicity (non‐Hispanic White, non‐Hispanic Black, Mexican American, other Hispanic, or other race [other race was defined as those who self‐reported mixed race or races other than non‐Hispanic White, non‐Hispanic Black, Mexican American, or other Hispanic]), income level (poverty‐income ratio [PIR] < 1.3 as low, PIR 1.3‐3.5 as middle, and PIR > 3.5 as high), college degree, and current medical conditions.
Clinical Characteristics
The fibrosis‐4 (FIB‐4) index for liver fibrosis score was calculated to identify those with advanced fibrosis (FIB‐4 > 2.67) among patients with NAFLD or VH.( 24 ) The 10‐year lifetime risk for developing atherosclerotic CVD (ASCVD) was calculated from the ASCVD risk score (American College of Cardiology/American Heart Association), which includes each participant’s age, race, sex, smoking status, the presence of diabetes, systolic blood pressure, antihypertensive medication, serum cholesterol, and high‐density lipoprotein levels. Individuals with a 10‐year ASCVD risk score of ≥ 7.5% were defined as being high risk for CVD.( 25 ) Obesity was defined as a body mass index (BMI) ≥ 30 kg/m2. T2DM was defined as a fasting glucose level ≥ 126 mg/dL, self‐reported medical history of diabetes, use of oral hypoglycemic agents, insulin use, or hemoglobin A1c of ≥ 6.5%.( 26 ) Hypertension was defined as systolic blood pressure measurements ≥ 130 mm Hg or diastolic blood pressure measurements ≥ 80 mm Hg from an average of three measurements, or a history of high blood measurements.( 27 ) Hyperlipidemia was defined by either a serum cholesterol level ≥ 200 mg/dL, low density lipoprotein level ≥ 130 mg/dL, high density lipoprotein cholesterol level ≤ 40 mg/dL for men and 50 for women, or history of hyperlipidemia.( 28 ) Metabolic syndrome was defined by the National Cholesterol Education Program Adult Treatment Panel III definition.( 28 ) Number of health care visits was assessed with the following single‐item NHANES question: “During the past 12 months, how many times have you seen a doctor or other health care professional about your health at a doctor’s office, a clinic or some other place?”
Statistical Analysis
To combine data from the five cycles of NHANES data, sampling weights and adjustment coefficients were used in compliance with the NHANES Analytic and Reporting Guidelines.( 29 ) The Rao‐Scott chi‐square test and the Wald test were used to compare groups on categorical and continuous variables, respectively. Test for trends in prevalence and awareness across survey cycles were performed by including the midpoint of each survey period as a continuous variable in logistic regression model. Multivariable logistic regression models were used to identify predictors of awareness of liver disease among adults with NAFLD and VH. Examination sample weights, accounting for nonresponse, noncoverage, and unequal selection probabilities for certain categories of the population, were incorporated to produce national estimates for all analyses. Sampling errors were estimated by the Taylor series linearization method. In addition, the total number of U.S. adults with NAFLD in 2016 was calculated by multiplying the prevalence estimates from NHANES 2015‐2016 and the corresponding population totals from the Current Population Surveys.( 30 ) Analyses were performed with SAS software, version 9.4 (SAS Institute, Cary, NC) using “SURVEY” procedure, which incorporates the sample design. Statistical tests were considered significant at P < 0.05 (two‐tailed).
Results
Prevalence of and Characteristics of Adults With NAFLD
Among 11,700 eligible adult participants included in the NAFLD cohort (mean age 47.4 years; 48.8% male; 67.6% non‐Hispanic White, 10.2% non‐Hispanic Black, and 8.7% Mexican American), the overall prevalence of NAFLD was 34.2% (CI 32.8%‐35.6%), and the trend was stable from 32.6% in 2007‐2008 to 36.6% in 2015‐2016 (trend P = 0.286) (Fig. 2). The demographic and characteristics of adults by the presence of NAFLD are displayed in Supporting Table S2. As consistent with typical features of NAFLD, adults with NAFLD were more likely to be older, male, Mexican American, former smokers, and more likely have to obesity, hypertension, diabetes, metabolic syndrome, a history of CVD and cancer, and high risk for CVD compared to adults without NAFLD. There were no differences among the demographic and clinical characteristics between adults with NAFLD by US‐FLI and FLI (Supporting Table S2).
FIG. 2.
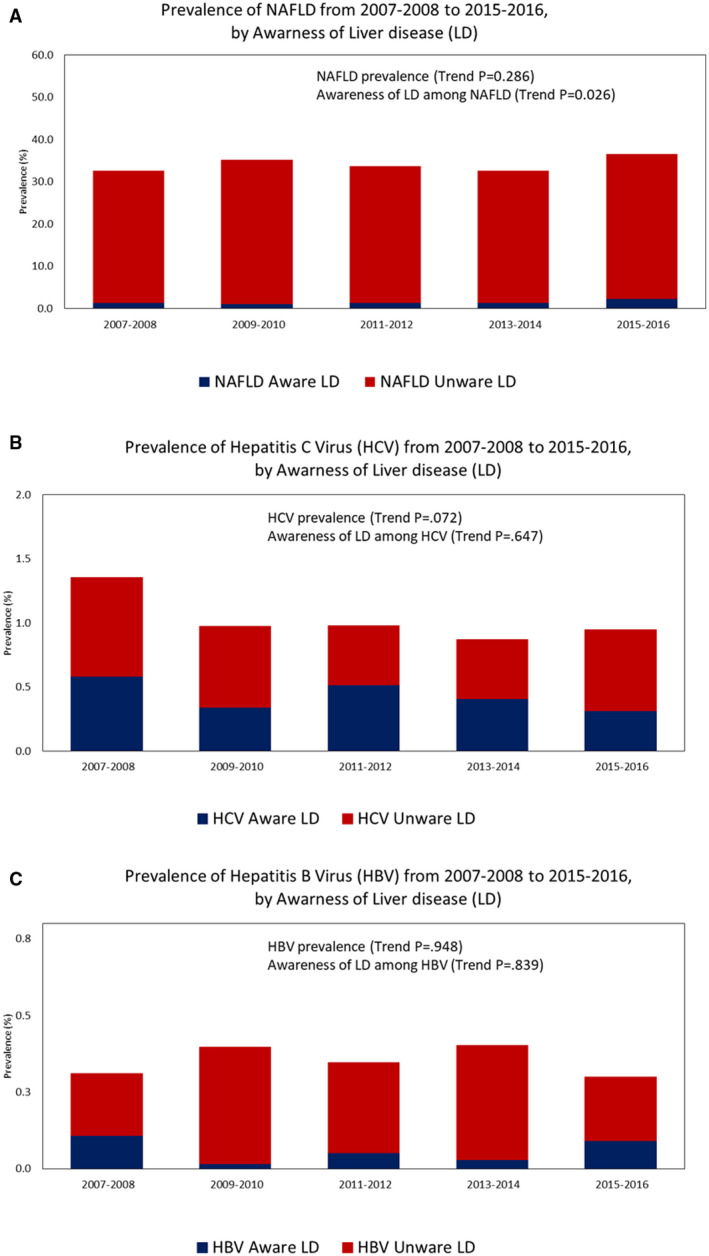
(A) Awareness of NAFLD by the prevalence of NAFLD over time (2007‐2016). (B) Awareness of HCV by the prevalence of HCV over time (2007‐2016). (C) Awareness of HBV by the prevalence of HBV over time (2007‐2016).
In 2015‐2016, the prevalence of NAFLD was 36.6% (CI 33.1%‐40.2%) but was noted to increase with age from 21.7% (16.5%‐27.0%) among those 18‐29 years old, 33.5% (26.8%‐40.2%) among those 30‐44 years old, 38.6% (32.5%‐44.7%) among those 45‐64 years old, and 47.6% (41.9%‐53.4%) among those ≥ 65 years old, equating to an estimated 87.0 million adults with NAFLD in the United States (11.6, 20.5, 32.3, and 22.7 million among those 18‐29, 30‐44, 45‐64, and ≥ 65 years old, respectively) (Supporting Table S3).
Prevalence of and Characteristics of Adults With VH
Among 25,648 eligible adult participants included in the VH cohort (mean age 47.1 years; 48.4% male; 67.0% non‐Hispanic White, 10.9% non‐Hispanic Black, and 8.7% Mexican American), the overall prevalence was 1.02% (0.85%‐1.19%) for HCV and 0.35% (0.27%‐0.43%) for HBV, and both prevalences have not changed over time (trend P > 0.007) (Fig. 2) The demographic and characteristics of adults by the presence of HCV and HBV are displayed in Supporting Table S4. Compared to those with HBV, those with HCV were more likely to be older, non‐Hispanic White, active smoker, more likely to have obesity, hypertension, diabetes, excessive alcohol consumption, and advanced fibrosis, while less likely to be other race (including Asian). Of note, adults with HCV had higher waist circumference (98.9 cm vs. 92.4 cm) and more frequent health care visits (2.3 vs. 1.7), but no difference in BMI (P = 0.247) versus those with HBV.
In 2015‐2016, the prevalence was 0.95% (0.72%‐1.17%) for HCV and 0.30% (0.16%‐0.44%) for HBV, equating to an estimated 2.6 million with HCV and 0.8 million with HBV in the United States. The prevalence of HCV was higher among males, those 45‐64 years old, and non‐Hispanic Black compared with their counterpart, whereas that of HBV was higher among males and other races but similar across age groups (Supporting Table S5).
Awareness of Liver Disease Among Adults With NAFLD
The overall prevalence of awareness of liver disease among adults with NAFLD was 4.4% (3.7%‐5.1%) (Table 1). The overall prevalence of awareness of liver disease among adults with NAFLD was highest among females (5.3%) and lowest among males (3.7%), highest among those ≥ 65 years and older (5.6%) and lowest among those 18‐29 years old (1.1%), and highest among other Hispanics (8.8%) and lowest among non‐Hispanic Blacks (2.0%) (Fig. 3). Trends in awareness of liver disease among adults with NAFLD increased significantly from 4.3% (CI 2.9%‐5.6%) in 2007‐2008 to 6.3% (CI 4.8%‐7.9%) in 2015‐2016 (trend P = 0.03) (Fig. 2). Trends in awareness of liver disease among adults with NAFLD increased significantly among other Hispanics (trend P = 0.02), but trends did not increase significantly within other stratifications of sex, age, or race.
TABLE 1.
Trends in Awareness Among Adults Aged 18 or over with NAFLD and with VH: NHANES 2007‐2008 to 2015‐2016
| NHANES 2007‐2016 | NHANES 2007‐2008 | NHANES 2009‐2010 | NHANES 2011‐2012 | NHANES 2013‐2014 | NHANES 2015‐2016 | Trend P | |
|---|---|---|---|---|---|---|---|
| Awareness among NAFLD | |||||||
| Total | 4.39 (3.69‐5.09) | 4.27 (2.92‐5.63) | 3.07 (1.66‐4.48) | 3.94 (2.43‐5.45) | 4.01 (2.23‐5.79) | 6.31 (4.76‐7.86) | 0.0255 |
| Subgroup | |||||||
| Sex | |||||||
| Female | 5.33 (3.86‐6.81) | 5.19 (3.09‐7.29) | 3.29 (1.89‐4.68) | 3.97 (1.62‐6.32) | 5.55 (2.68‐8.43) | 8.23 (3.2‐13.25) | 0.0930 |
| Male | 3.65 (2.55‐4.75) | 3.65 (1.68‐5.61) | 2.9 (0.41‐5.4) | 3.92 (1.62‐6.22) | 2.68 (0.71‐4.65) | 4.83 (1.86‐7.8) | 0.5370 |
| Age group (years) | |||||||
| 18‐29 | 1.09 (−0.03‐2.21) | 2.65 (−2.42‐7.72) | 0.5 (−0.46‐1.46) | 0.89 (−0.39‐2.16) | 1.96 (−1.59‐5.52) | 0 (0‐0) | 0.4927 |
| 30‐44 | 2.77 (1.50‐4.03) | 1.18 (−0.35‐2.72) | 1.05 (−0.29‐2.39) | 3.81 (0.66‐6.96) | 3.8 (1.48‐6.12) | 3.68 (−0.63‐7.99) | 0.0847 |
| 45‐64 | 5.54 (3.98‐7.11) | 5.45 (3.42‐7.47) | 4.95 (1.62‐8.28) | 2.94 (0.63‐5.25) | 5.84 (2.04‐9.63) | 8.28 (3.48‐13.08) | 0.2346 |
| ≥ 65 | 5.57 (3.97‐7.17) | 6.09 (2.86‐9.32) | 3.34 (1.15‐5.54) | 7.29 (3.41‐11.17) | 2.27 (0.23‐4.31) | 7.67 (3.75‐11.6) | 0.5194 |
| Race | |||||||
| Non‐Hispanic White | 4.15 (3.14‐5.16) | 4.49 (2.54‐6.43) | 3.06 (0.95‐5.17) | 3.17 (1.15‐5.19) | 3.23 (1.12‐5.33) | 6.48 (3.88‐9.07) | 0.2005 |
| Non‐Hispanic Black | 1.99 (0.56‐3.42) | 1.71 (−1.14‐4.56) | 0.39 (−0.37‐1.16) | 4.95 (−0.47‐10.36) | 2.17 (−0.63‐4.97) | 0.69 (−0.64‐2.02) | 0.9191 |
| Mexican American | 3.54 (2.33‐4.74) | 4.61 (1.3‐7.92) | 3.08 (1.17‐5) | 1.27 (0.04‐2.51) | 4.2 (0.72‐7.68) | 4.49 (1.68‐7.29) | 0.7968 |
| Other Hispanic | 8.78 (5.67‐11.89) | 2.72 (−0.4‐5.84) | 3.16 (0.02‐6.3) | 13.41 (5.62‐21.2) | 13.2 (5.1‐21.3) | 8.73 (4.91‐12.55) | 0.0169 |
| Other race | 6.51 (2.59‐10.43) | 5.16 (−4.55‐14.87) | 6.29 (−1.8‐14.37) | 4.53 (−0.57‐9.63) | 5.67 (0.71‐10.63) | 9.13 (−1.31‐19.58) | 0.5633 |
| Awareness among HCV | |||||||
| Total | 42.36 (37.25‐47.47) | 43.15 (32.13‐54.17) | 34.89 (23.87‐45.91) | 52.98 (43.41‐62.54) | 46.93 (32.94‐60.93) | 33.37 (24.09‐42.65) | 0.6465 |
| Awareness among HBV | |||||||
| Total | 17.19 (12.60‐21.77) | 35.26 (28.29‐42.24) | 4.51 (−3.99‐13.02) | 15.44 (9.32‐21.55) | 7.56 (1.72‐13.39) | 30.86 (18.84‐42.88) | 0.8395 |
Data are displayed as weighted percentages (95% CI) except where otherwise noted. Test for trends was performed by including the midpoint of each survey period as a continuous variable in a logistic regression model.
FIG. 3.
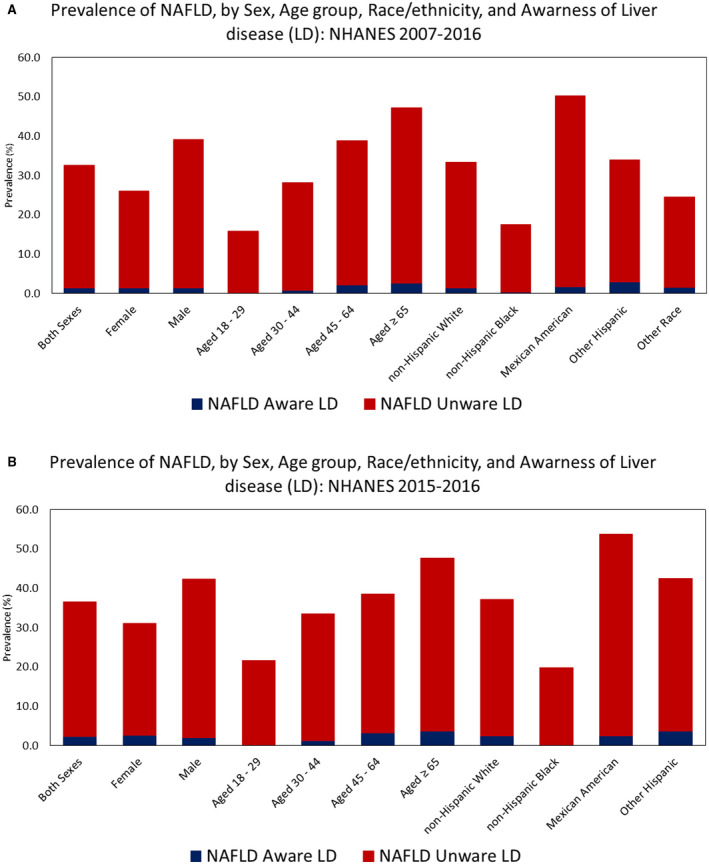
(A) NAFLD awareness by age, gender, ethnicity and prevalence (2007‐2016). (B) NAFLD awareness by age, gender, ethnicity and prevalence over most recent 12 months (2015‐2016).
Among adults with NAFLD, compared to adults without awareness of having a liver disease, those with awareness of having a liver disease were older (56.1 vs. 51.1 years), had a higher homeostasis model assessment (HOMA) score (9.6 vs. 7.0) and a higher number of health care visits (2.9 vs. 2.2), and were more likely to be other Hispanic (13.2% vs. 6.3%), have obesity (77.6% vs. 69.3%), hypertension (73.8% vs. 63.1%), diabetes (53.4% vs. 27.0%), history of CVD (23.4% vs. 12.6%), and advanced fibrosis (7.2% vs. 2.6%), whereas being less aware was more likely to be non‐Hispanic Black (2.7% vs. 6.2%) (Table 2). There were no differences among the demographic and clinical characteristics by awareness of liver disease between adults with NAFLD by US‐FLI and FLI (Supporting Table S6). In our multivariable model, young adults (adjusted odds ratio [aOR] = 0.29; CI 0.10‐0.87) and non‐Hispanic Black (aOR = 0.43; CI 0.20‐0.96) were negatively associated with awareness of liver disease among adults with NAFLD, whereas diabetes (aOR = 2.22; CI 1.37‐3.58) and advanced fibrosis (aOR = 2.34; CI 1.17‐4.68) and a higher number of health care visits (aOR = 1.33; CI 1.15‐1.50) and were positively associated with awareness of liver disease (Table 3).
TABLE 2.
Demographic and Clinical Characteristics of Adults With NAFLD, Stratified by Awareness of Liver Disease: NHANES 2007‐2008 to 2015‐2016
| Adults With NAFLD | ||||
|---|---|---|---|---|
| Awareness of Liver Disease | P | Total Adults | ||
| Yes (n = 216) | No (n = 4,005) | |||
| Age, years (mean [SEM]) | 56.08 (0.84) | 51.14 (0.34) | <0.0001 | 51.35 (0.33) |
| 18‐29 | 2.72 (1.42) | 11.31 (0.72) | 0.0015 | 10.93 (0.71) |
| 30‐44 | 15.32 (3.39) | 24.70 (0.96) | 0.0237 | 24.29 (0.93) |
| 45‐64 | 52.44 (6.09) | 41.01 (1.19) | 0.0547 | 41.51 (1.21) |
| ≥65 | 29.53 (4.30) | 22.98 (0.93) | 0.0879 | 23.27 (0.96) |
| Male, % | 46.56 (6.09) | 56.47 (1.02) | 0.1143 | 56.03 (0.98) |
| Race, % | ||||
| Non‐Hispanic White | 64.38 (4.71) | 68.23 (1.92) | 0.3904 | 68.06 (1.90) |
| Non‐Hispanic Black | 2.73 (1.00) | 6.19 (0.59) | 0.0192 | 6.04 (0.58) |
| Mexican American | 10.64 (1.97) | 13.33 (1.42) | 0.1980 | 13.21 (1.39) |
| Other Hispanic | 13.24 (3.12) | 6.31 (0.70) | 0.0002 | 6.62 (0.75) |
| Other race | 9.00 (2.84) | 5.93 (0.58) | 0.2080 | 6.07 (0.57) |
| Income, % | ||||
| Low | 23.33 (3.14) | 23.58 (1.04) | 0.9389 | 23.57 (1.02) |
| Medium | 39.91 (4.63) | 37.40 (1.24) | 0.6107 | 37.51 (1.17) |
| High | 36.76 (4.72) | 39.02 (1.59) | 0.6678 | 38.92 (1.50) |
| Smoking status, % | ||||
| Active | 13.00 (2.78) | 16.65 (0.90) | 0.2732 | 16.49 (0.85) |
| Former | 39.98 (6.23) | 30.41 (1.00) | 0.0930 | 30.83 (1.05) |
| Nonsmoker | 47.02 (5.53) | 52.94 (1.21) | 0.2728 | 52.68 (1.23) |
| College, % | 27.31 (4.94) | 23.39 (1.36) | 0.4084 | 23.56 (1.34) |
| Obesity, % | 77.63 (3.53) | 69.27 (0.95) | 0.0327 | 69.64 (0.93) |
| Hypertension, % | 73.76 (3.71) | 63.07 (1.22) | 0.0106 | 63.54 (1.18) |
| Hyperlipidemia, % | 84.93 (2.69) | 82.84 (0.80) | 0.4754 | 82.93 (0.77) |
| Diabetes, % | 53.37 (5.18) | 26.99 (0.94) | <0.0001 | 28.11 (0.91) |
| Metabolic syndrome, % | 64.79 (4.85) | 60.29 (1.16) | 0.3690 | 60.49 (1.14) |
| History of CVD, % | 23.38 (3.54) | 12.63 (0.63) | 0.0002 | 13.10 (0.63) |
| History of cancer, % | 12.82 (2.87) | 12.02 (0.77) | 0.7726 | 12.05 (0.76) |
| High risk of CVD | 49.28 (3.90) | 41.99 (1.21) | 0.0683 | 42.31 (1.18) |
| Advanced fibrosis (FIB‐4), % | 7.21 (1.61) | 2.61 (0.34) | 0.0001 | 2.82 (0.33) |
| Waist, cm (mean [SEM]) | 114.66 (1.19) | 112.60 (0.35) | 0.0909 | 112.69 (0.36) |
| BMI, mean (SEM) | 34.79 (0.50) | 33.94 (0.16) | 0.0998 | 33.98 (0.17) |
| HOMA, mean (SEM) | 9.58 (0.67) | 7.00 (0.16) | 0.0004 | 7.11 (0.16) |
| Health care visit, mean (SEM) | 2.86 (0.11) | 2.19 (0.03) | <0.0001 | 2.22 (0.03) |
Data are displayed as weighted percentages (SEM) except where otherwise noted.
TABLE 3.
Odds Ratios of Awareness of Liver Disease Among Adults With NAFLD and VH: NHANES 2007‐2008 to 2015‐2016
| Adults With NAFLD | Adults With HCV | Adults With HBV | ||||
|---|---|---|---|---|---|---|
| OR (95% CI) | P | OR (95% CI) | P | OR (95% CI) | P | |
| Year | 1.06 (0.99‐1.14) | 0.0856 | 1.00 (0.90‐1.10) | 0.9371 | 0.97 (0.81‐1.15) | 0.6775 |
| Age, years | ||||||
| 45‐64 | Reference | Reference | Reference | |||
| 18‐29 | 0.29 (0.10‐0.87) | 0.0279 | 3.38 (1.08‐10.59) | 0.0373 | ||
| 30‐44 | 0.68 (0.36‐1.3) | 0.2392 | 2.06 (0.91‐4.66) | 0.0833 | 0.52 (0.23‐1.19) | 0.1148 |
| ≥ 65 | 0.73 (0.42‐1.28) | 0.2686 | 0.80 (0.25‐2.54) | 0.6964 | 0.04 (0.00‐1.41) | 0.0748 |
| Male, % | 0.76 (0.48‐1.19) | 0.2295 | 1.37 (0.71‐2.66) | 0.3428 | 2.16 (0.57‐8.22) | 0.2450 |
| Race, % | ||||||
| Non‐Hispanic White | Reference | Reference | Reference | |||
| Non‐Hispanic Black | 0.43 (0.20‐0.96) | 0.0390 | 0.53 (0.31‐0.93) | 0.0266 | 2.82 (0.25‐32.22) | 0.3886 |
| Mexican American | 1.28 (0.77‐2.12) | 0.3401 | 1.82 (0.85‐3.93) | 0.1226 | ||
| Other Hispanic | 2.75 (1.62‐4.65) | 0.0003 | 2.18 (0.81‐5.92) | 0.1222 | ||
| Other race | 1.94 (0.83‐4.53) | 0.1231 | 0.65 (0.13‐3.16) | 0.5829 | 35.82 (3.50‐366.35) | 0.0041 |
| Obesity | 1.47 (0.96‐2.27) | 0.0785 | 0.88 (0.36‐2.16) | 0.7796 | 0.02 (0.00‐0.09) | <0.0001 |
| Hypertension | 1.07 (0.71‐1.62) | 0.7456 | 0.91 (0.43‐1.96) | 0.8127 | 7.62 (2.74‐21.18) | 0.0004 |
| Hyperlipidemia | 0.87 (0.56‐1.35) | 0.5184 | 2.05 (0.98‐4.30) | 0.0563 | 0.61 (0.25‐1.50) | 0.2684 |
| Diabetes | 2.22 (1.37‐3.58) | 0.0015 | 2.62 (1.26‐5.47) | 0.0110 | 6.46 (0.52‐80.11) | 0.1391 |
| History of CVD | 1.35 (0.75‐2.46) | 0.3138 | 0.97 (0.40‐2.38) | 0.9536 | 0.8 (0.10‐6.43) | 0.8220 |
| Advanced fibrosis (FIB‐4) | 2.34 (1.17‐4.68) | 0.0172 | 1.31 (0.63‐2.72) | 0.4688 | 28.19 (4.27‐185.90) | 0.0013 |
| Health care visit | 1.33 (1.15‐1.50) | 0.0002 | 1.71 (1.35‐2.16) | <0.0001 | 2.21 (1.35‐3.61) | 0.0028 |
Significant values are indicated in bold.
Model adjusted for year, age, sex, race, obesity, hypertension, hyperlipidemia, diabetes, history of CVD, advanced fibrosis, and Health care visit.
Overall, liver disease awareness remained significantly lower among ages 18‐29 compared with those aged ≥ 30 years (Fig. 2). Worse awareness in young adults was driven mostly by worse measures in Mexican Americans, those with low education, active smokers, and those with hypertension (Supporting Table S7). When stratified by race/ethnicity, non‐Hispanic Blacks had the lowest awareness of liver disease, followed by Mexican Americans, non‐Hispanic Whites, and other Hispanics across times. Furthermore, awareness among non‐Hispanic Blacks and Mexican Americans did not improve during the study period (Supporting Table S8).
Awareness of Liver Disease Among Adults With VH
The overall prevalence of awareness of liver disease among adults with HCV and with HBV was 42.4% (CI 37.3%‐47.5%) and 17.2% (12.6%‐21.8%), respectively. Trends in awareness of liver disease among adults with HCV and with HBV did not change significantly from 2007‐2008 to 2015‐2016 (trend P > 0.70) (Table 1 and Fig. 2).
Among adults with HCV, those with awareness of liver disease were older, other Hispanic, and more likely to have hyperlipidemia, diabetes, metabolic syndrome, and advanced fibrosis. Adults with awareness of liver disease also had higher waist circumference and more frequent health care visits (2.3 vs. 1.7) but no difference in BMI (P = 0.518) (Table 4). In our multivariable model, non‐Hispanic Black (aOR = 0.53 [0.31‐0.93]) was negatively associated with awareness of liver disease among adults with HCV, whereas presence of diabetes (aOR = 2.62 [1.26‐5.47]) and higher number of health care visits (aOR = 1.71 [1.35‐2.16]) were positively associated with awareness of liver disease (Table 3).
TABLE 4.
Demographic and Clinical Characteristics of Adults With Viral Hepatitis, Stratified by Awareness of Liver Disease: NHANES 2007‐2008 to 2015‐2016
| Adults With HCV | Adults With HBV | |||||||
|---|---|---|---|---|---|---|---|---|
| Awareness of Liver Disease | P | Total Adults | Awareness of Liver Disease | P | Total Adults | |||
| Yes (n = 137) | No (n = 196) | Yes (n = 28) | No (n = 122) | |||||
| Age, years (mean [SEM]) | 53.78 (0.67) | 49.71 (0.90) | 0.0037 | 51.43 (0.67) | 44.21 (1.59) | 47.53 (1.52) | 0.3691 | 46.96 (1.40) |
| 18‐29 | 0 | 5.50 (2.49) | 3.17 (1.48) | 20.96 (6.86) | 13.17 (2.42) | 0.2378 | 14.51 (2.25) | |
| 30‐44 | 14.55 (4.13) | 22.50 (2.53) | 0.1551 | 19.13 (2.15) | 30.13 (6.51) | 32.58 (4.63) | 0.7372 | 32.15 (4.19) |
| 45‐64 | 78.29 (4.50) | 64.33 (3.76) | 0.0292 | 70.24 (2.81) | 41.79 (6.16) | 40.49 (4.27) | 0.8600 | 40.71 (3.71) |
| ≥65 | 7.16 (2.23) | 7.66 (1.55) | 0.8583 | 7.45 (1.28) | 7.12 (3.54) | 13.76 (4.66) | 0.2824 | 12.62 (3.85) |
| Male, % | 71.62 (3.95) | 64.93 (4.17) | 0.2180 | 67.76 (3.08) | 73.01 (7.17) | 57.38 (4.34) | 0.0964 | 60.06 (3.66) |
| Race, % | ||||||||
| Non‐Hispanic White | 64.12 (4.54) | 59.64 (4.43) | 0.3995 | 61.54 (3.63) | 9.28 (1.15) | 25.30 (5.69) | <0.0001 | 22.55 (4.90) |
| Non‐Hispanic Black | 18.06 (3.24) | 25.43 (3.51) | 0.0530 | 22.31 (2.85) | 13.43 (6.18) | 23.04 (4.04) | 0.2824 | 21.39 (3.29) |
| Mexican American | 6.89 (2.13) | 5.77 (1.36) | 0.5276 | 6.24 (1.46) | 3.96 (3.83) | 2.89 (1.79) | 0.7839 | 3.07 (1.62) |
| Other Hispanic | 6.70 (2.01) | 3.57 (0.88) | 0.0373 | 4.90 (1.15) | 0 | 2.97 (0.92) | 2.46 (0.76) | |
| Other race | 4.23 (1.89) | 5.58 (2.27) | 0.6481 | 5.01 (1.52) | 73.34 (6.07) | 45.80 (4.57) | 0.0007 | 50.53 (4.02) |
| Income, % | ||||||||
| Low | 48.94 (5.90) | 47.74 (4.61) | 0.8815 | 48.23 (3.37) | 39.58 (6.70) | 36.05 (5.22) | 0.6476 | 36.57 (4.71) |
| Middle | 30.64 (5.61) | 35.66 (5.56) | 0.5483 | 33.60 (3.78) | 39.67 (6.28) | 33.77 (4.59) | 0.3804 | 34.64 (4.24) |
| High | 20.42 (4.29) | 16.59 (4.35) | 0.5671 | 18.17 (2.84) | 20.75 (5.05) | 30.18 (5.42) | 0.1601 | 28.79 (4.83) |
| Smoking status, % | ||||||||
| Active | 51.23 (4.86) | 65.18 (5.44) | 0.0522 | 59.27 (3.90) | 30.01 (5.52) | 16.40 (2.46) | 0.0032 | 18.74 (2.51) |
| Former | 29.35 (4.95) | 20.56 (4.19) | 0.1876 | 24.29 (3.11) | 18.30 (2.91) | 22.90 (4.68) | 0.3563 | 22.11 (3.98) |
| Nonsmoker | 19.41 (4.12) | 14.26 (3.13) | 0.3318 | 16.44 (2.39) | 51.69 (6.32) | 60.71 (4.22) | 0.2231 | 59.16 (3.71) |
| College, % | 6.45 (2.93) | 6.94 (1.91) | 0.8973 | 6.73 (1.54) | 23.09 (8.11) | 29.60 (5.38) | 0.5164 | 28.48 (4.68) |
| Obesity, % | 30.75 (5.56) | 26.36 (4.32) | 0.5719 | 28.24 (3.00) | 1.27 (0.16) | 18.13 (4.02) | <0.0001 | 15.32 (3.39) |
| Hypertension, % | 67.69 (4.94) | 57.02 (5.12) | 0.1360 | 61.54 (3.64) | 67.78 (7.12) | 35.56 (4.03) | 0.0002 | 41.10 (3.65) |
| Hyperlipidemia, % | 67.10 (4.46) | 48.89 (5.31) | 0.0126 | 56.60 (3.51) | 54.85 (6.37) | 58.38 (4.21) | 0.6683 | 57.77 (3.46) |
| Diabetes, % | 27.83 (4.57) | 11.20 (2.40) | 0.0011 | 18.07 (2.24) | 14.12 (6.13) | 6.63 (1.76) | 0.0854 | 7.95 (2.06) |
| Metabolic syndrome, % | 52.47 (6.91) | 25.20 (4.74) | 0.0002 | 38.90 (4.82) | 34.06 (8.07) | 23.07 (5.83) | 0.2389 | 25.13 (5.10) |
| Excessive alcohol consumption | 22.18 (4.85) | 29.07 (4.99) | 0.2439 | 26.12 (4.00) | 2.35 (0.29) | 9.93 (2.53) | <0.0001 | 8.41 (2.01) |
| HBV | 2.04 (1.28) | 0.76 (0.54) | 0.2774 | 1.30 (0.63) | 100.00 (0.00) | 100.00 (0.00) | 100.00 (0.00) | |
| HCV | 100.00 (0.00) | 100.00 (0.00) | 100.00 (0.00) | 14.50 (4.76) | 1.53 (0.75) | <0.0001 | 3.76 (1.09) | |
| Alcohol‐associated liver disease | 20.76 (4.90) | 22.28 (4.28) | 0.7615 | 21.63 (3.83) | 2.41 (0.31) | 3.82 (2.49) | 0.4852 | 3.54 (2.00) |
| History of CVD, % | 15.56 (3.81) | 8.68 (1.98) | 0.0621 | 11.59 (2.09) | 8.31 (2.17) | 11.42 (4.56) | 0.5129 | 10.89 (3.78) |
| History of cancer, % | 9.55 (3.18) | 6.09 (1.79) | 0.1944 | 7.55 (1.99) | 6.22 (0.77) | 6.94 (4.65) | 0.8723 | 6.82 (3.86) |
| High risk of CVD | 46.75 (5.48) | 33.68 (4.86) | 0.0923 | 39.09 (3.45) | 44.56 (7.12) | 26.05 (3.27) | 0.0044 | 29.30 (3.28) |
| Advanced fibrosis (FIB‐4), % | 31.35 (5.12) | 19.12 (3.52) | 0.0409 | 24.37 (3.04) | 20.87 (5.44) | 2.73 (1.06) | <0.0001 | 5.82 (1.23) |
| BMI, mean (SEM) | 29.04 (0.61) | 27.10 (0.55) | 0.0518 | 27.93 (0.41) | 24.56 (0.45) | 27.05 (1.11) | 0.0760 | 26.63 (0.94) |
| Waist, cm (mean [SEM]) | 103.05 (1.63) | 95.88 (1.24) | 0.0046 | 98.82 (1.04) | 88.97 (1.19) | 93.10 (1.86) | 0.1928 | 92.41 (1.61) |
| HOMA, mean (SEM) | 6.71 (0.69) | 3.45 (0.46) | 0.0218 | 5.09 (0.47) | 4.75 (0.14) | 2.67 (0.45) | 0.0113 | 3.08 (0.37) |
| Health care visit, mean (SEM) | 2.88 (0.16) | 1.92 (0.13) | 0.0000 | 2.33 (0.12) | 2.19 (0.09) | 1.60 (0.17) | 0.0779 | 1.70 (0.16) |
Data are displayed as weighted percentages (SEM) except where otherwise noted.
Among adults with HBV, those with awareness of liver disease were more likely to be other race, active smoker, and more likely to have hypertension, HCV, higher risk of CVD, and advanced fibrosis, while less likely to be non‐Hispanic White and less likely to have obesity and excessive alcohol consumption (Table 4). In our multivariable model, obesity (aOR = 0.02 [0.00‐0.09]) was negatively associated with awareness of liver disease among adults with HBV, while young adults (aOR [1.08‐10.59]), other race (aOR = 35.8 [3.50‐366.35]), hypertension (aOR = 7.62 [2.74‐21.18]), advanced fibrosis (aOR = 28.2 [4.27‐185.9]), and a higher number of health care visits (aOR = 2.21 [1.35‐3.61]) were positively associated with awareness of liver disease (Table 3).
Discussion
Using repeated‐measures cross‐sectional NHANES data, we estimated the prevalence of awareness of liver disease among adults with NAFLD in the general population in the United States, and secondarily estimated awareness among adults with VH. Several findings emerged from our analysis. The prevalence of NAFLD was alarmingly high, and the prevalence of NAFLD dwarfed the prevalence of HCV and HBV (34.2% vs. 1.0% and 0.4%). The prevalence of NAFLD, HCV, and HBV remained relatively steady over the 9‐year study period. Although the prevalence of NAFLD was considerably higher than VH, nearly 96% of adults with NAFLD in the United States were unaware they had liver disease compared with over 42% who were aware among the HCV group and 17% among the HBV group. Among the NAFLD cohort, the lowest awareness of liver disease was found for males, young adults, and/or non‐Hispanic Blacks, whereas those with the lowest awareness among the VH group were more likely to be older than 65 years old.
Prevalence estimates of NAFLD awareness found in this study are consistent with a handful of studies in the United States that previously estimated liver disease awareness.( 14 , 15 , 16 , 17 , 31 , 32 ) Those respective studies estimated 95%‐98% of adults with NAFLD in the United States were unaware of their liver disease. Previous estimates in combination with our estimates are indicative of an urgent need for a wide‐ranging public health response to improve population‐wide awareness of NAFLD. In fact, when we look at the level of awareness among the VH group, those in the “baby boomer” group, a target of HCV screening by the CDC, had the highest level of awareness.( 18 , 19 ) As the new guidelines from the CDC in which screening of all adults, women during every pregnancy, and more frequent testing for those with high risk are enacted,( 33 ) assessment of liver disease awareness remains important.( 34 ) On the other hand, low awareness of NAFLD in the United States is not only due to a low knowledge of NAFLD in the general population but also poor knowledge of NAFLD among non‐liver specialists and inconsistencies in screening recommendations.( 14 , 15 , 16 , 17 , 31 , 32 , 35 , 36 ) A few studies have demonstrated that many in the general population are unaware of or have not heard of NAFLD, including those at risk for NAFLD,( 14 , 15 , 16 , 17 , 31 , 32 ) and 98% of participants in one of those respective studies reported that their physicians had not ever mentioned or discussed NAFLD.( 15 ) Other studies reported that many non‐liver specialists have poor understanding of NAFLD, uncertainty about proper diagnosis and management of NAFLD, and routinely underestimate its prevalence.( 35 , 36 )
Adding to these factors, the American Association for the Study of Liver Diseases (AASLD) does not advise routine screening for NAFLD in high‐risk groups attending primary care, diabetes, or obesity clinics.( 6 ) The recommendation cites concerns around uncertainties surrounding diagnostic tests and treatment options, along with the lack of knowledge related to long‐term benefits and cost‐effectiveness of screening. Conversely, the American Diabetes Association (ADA) recently recommended screening for NASH and advanced fibrosis in patients with diabetes with elevated liver enzymes,( 37 ) and in Europe the European Association for the Study of the Liver (EASL) recommends screening among patients with obesity or a metabolic syndrome as part of routine work‐up.( 38 )
Although universal screening for NAFLD cannot be made, we would suggest that those who appear to have risk factors associated with NAFLD should be risk‐stratified using noninvasive algorithms and noninvasive assessment of hepatic fibrosis.( 39 , 40 ) These suggestions do fall in line with the ADA and EASL guidelines as well as following the recent findings from Le et al., who found that 23% of those with NAFLD had advanced fibrosis, yet only 5% of persons with NAFLD were even aware they had a liver disease.( 14 ) These suggestions are also based on the other findings in our study, in which those with advanced fibrosis and or diabetes along with more visits to the doctors were associated with increased awareness, which may demonstrate that it is only when advanced disease is present does one become aware of having a liver disease.
Our finding that non‐Hispanic Blacks and those aged 18‐29 were the least likely to be aware they had a liver disease may be due to several reasons. First, despite non‐Hispanic Blacks having multiple risk factors for NAFLD, they are the least likely to develop progressive NAFLD for currently unknown reasons.( 41 , 42 , 43 , 44 , 45 , 46 , 47 , 48 , 49 ) Nevertheless, long‐term studies are needed to better understand the role of ethnicity and other potential genetic factors in the development and progression of NAFLD.
Based on study findings, other areas of future research include the need to model and forecast annual incident cases of NAFLD and NAFLD‐associated cirrhosis, HCC, and death in the coming decades if low awareness remains constant or unchanged. There is a need to approximate the number of avoidable cases of NAFLD‐associated morbidity and mortality if a large‐scale policy‐based intervention implemented in the United States increased awareness, identification of undiagnosed cases and facilitated linkage to care. Comparisons between the prevalence of awareness of liver disease among adults with NAFLD in the United States and Europe are warranted, given the divergent AASLD and EASL screening recommendations mentioned earlier.( 50 , 51 )
The strengths of this study include a large population‐based sample that was representative of the U.S. population, which spanned a large time frame unlike earlier studies.( 14 , 15 , 16 , 17 , 31 , 32 ) In addition, we also performed several subgroup analyses that provided evidence that strengthened our study conclusions. However, this study has several limitations. Awareness was based on self‐report, and self‐report data are vulnerable to recall bias. Awareness by age and race/ethnicity for some of the NHANES survey cycles could not be reliably estimated because of a relatively small sample size in a number of stratifications. Although radiologic‐based or histologic‐based diagnostic methods for NAFLD are more ideal, US‐FLI was used to identify adults with NAFLD because ultrasound data were not available in the 2007‐2008 to 2015‐2016 NHANES cycles. GGT activity, fasting insulin and fasting glucose, and the components of US‐FLI were only measured at a single point in time, which may have led to underestimations or overestimations of NAFLD prevalence. However, to potentially overcome this limitation, we compared NHANES 1984‐1988 (adult 20‐74 years old), which provided an estimated prevalence of NAFLD as 19.4% (CI 17.7%‐21.3%), to the NAFLD prevalence using the US‐FLI for the same NHANES data cycle, which provided a similar estimated prevalence of NAFLD of 23.6% (21.7%‐25.5%). We also determined the prevalence of NAFLD using the FLI and found similar results as well. It is also important to note that in both the NAFLD and VH cohorts, excluded subjects were more likely to be younger, non‐Hispanic Black, and low income, so the prevalence is most likely to be underestimated in these groups.
In conclusion, nearly 96% of adults with NAFLD in the United States were unaware they had liver disease despite NAFLD being the most prevalent chronic liver disease in the United States. Although many more with VH were aware of their liver disease, there remains a significant gap in those with VH and being aware of having this disease. Altogether, these findings suggest that there is an urgent need to take public health action to increase awareness of NAFLD while continuing efforts on increasing awareness of VH and linking these patients to treatment as appropriate. Although treatment options for NAFLD are limited, the significant amount of medication‐based treatment research that is ongoing warrants efforts now to increase awareness of NAFLD to avoid finding NAFLD in its advanced disease stages. Therefore, we suggest that awareness efforts for NAFLD are warranted now, and efforts should be directed not only to increase awareness in the general population but also among primary care physicians and within health care systems. Targeted efforts are also needed to bolster awareness among non‐Hispanic Blacks and young adults.
Supporting information
Table S1‐S8
Supported by the Beatty Research Fund, Inova Health System and Center for Outcomes Research Liver Diseases.
Potential conflict of interest: Nothing to report.
References
- 1. Younossi ZM, Koenig AB, Abdelatif D, Fazel Y, Henry L, Wymer M. Global epidemiology of nonalcoholic fatty liver disease—meta‐analytic assessment of prevalence, incidence, and outcomes. Hepatology 2016;64:73‐84. [DOI] [PubMed] [Google Scholar]
- 2. Wong RJ, Liu B, Bhuket T. Significant burden of nonalcoholic fatty liver disease with advanced fibrosis in the US: a cross‐sectional analysis of 2011‐2014 National Health and Nutrition Examination Survey. Aliment Pharmacol Ther 2017;46:974‐980. [DOI] [PubMed] [Google Scholar]
- 3. Younossi ZM, Stepanova M, Ong J, Trimble G, AlQahtani S, Younossi I, et al. Nonalcoholic steatohepatitis is the most rapidly increasing indication for liver transplantation in the United States. Clin Gastroenterol Hepatol 2021;19:580‐589.e5. [DOI] [PubMed] [Google Scholar]
- 4. Younossi Z, Anstee QM, Marietti M, Hardy T, Henry L, Eslam M, et al. Global burden of NAFLD and NASH: trends, predictions, risk factors and prevention. Nat Rev Gastroenterol Hepatol 2018;15:11‐20. [DOI] [PubMed] [Google Scholar]
- 5. Younossi ZM. Non‐alcoholic fatty liver disease—a global public health perspective. J Hepatol 2019;70:531‐544. [DOI] [PubMed] [Google Scholar]
- 6. Chalasani N, Younossi Z, Lavine JE, Charlton M, Cusi K, Rinella M, et al. The diagnosis and management of nonalcoholic fatty liver disease: practice guidance from the American Association for the Study of Liver Diseases. Hepatology 2018;67:328‐357. [DOI] [PubMed] [Google Scholar]
- 7. Younossi ZM, Corey KE, Lim JK. AGA clinical practice update on lifestyle modification using diet and exercise to achieve weight loss in the management of nonalcoholic fatty liver disease: expert review. Gastroenterology 2021;160:912‐918. [DOI] [PubMed] [Google Scholar]
- 8. Francque SM, van der Graaff D , Kwanten WJ. Non‐alcoholic fatty liver disease and cardiovascular risk: pathophysiological mechanisms and implications. J Hepatol 2016;65:425‐443. [DOI] [PubMed] [Google Scholar]
- 9. Tikkanen MJ, Fayyad R, Faergeman O, Olsson AG, Wun C‐C, Laskey R, et al. Effect of intensive lipid lowering with atorvastatin on cardiovascular outcomes in coronary heart disease patients with mild‐to‐moderate baseline elevations in alanine aminotransferase levels. Int J Cardiol 2013;168:3846‐3852. [DOI] [PubMed] [Google Scholar]
- 10. Sanyal AJ, Harrison SA, Ratziu V, Abdelmalek MF, Diehl AM, Caldwell S, et al. The natural history of advanced fibrosis due to nonalcoholic steatohepatitis: data from the simtuzumab trials. Hepatology 2019;70:1913‐1927. [DOI] [PubMed] [Google Scholar]
- 11. Younossi ZM, Ratziu V, Loomba R, Rinella M, Anstee QM, Goodman Z, et al.; REGENERATE Study Investigators . Obeticholic acid for the treatment of non‐alcoholic steatohepatitis: interim analysis from a multicentre, randomised, placebo‐controlled phase 3 trial. Lancet 2019;394:2184‐2196. Erratum in: Lancet 2020;396:312. [DOI] [PubMed] [Google Scholar]
- 12. Harrison SA, Wong VW, Okanoue T, Bzowej N, Vuppalanchi R, Younes Z, et al.; STELLAR‐3 and STELLAR‐4 Investigators . Selonsertib for patients with bridging fibrosis or compensated cirrhosis due to NASH: results from randomized phase III STELLAR trials. J Hepatol 2020;73:26‐39. [DOI] [PubMed] [Google Scholar]
- 13. Armstrong MJ, Gaunt P, Aithal GP, Barton D, Hull D, Parker R, et al. Liraglutide safety and efficacy in patients with non‐alcoholic steatohepatitis (LEAN): a multicentre, double‐blind, randomised, placebo‐controlled phase 2 study. Lancet 2016;387:679‐690. [DOI] [PubMed] [Google Scholar]
- 14. Le MH, Yeo YH, Cheung R, Wong VWS, Nguyen MH. Ethnic influence on nonalcoholic fatty liver disease prevalence and lack of disease awareness in the United States, 2011‐2016. J Intern Med 2020;287:711‐722. [DOI] [PubMed] [Google Scholar]
- 15. Ghevariya V, Sandar N, Patel K, Ghevariya N, Shah R, Aron J, et al. Knowing what’s out there: awareness of non‐alcoholic fatty liver disease. Front Med 2014;1:4. [DOI] [PMC free article] [PubMed] [Google Scholar]
- 16. Singh A, Dhaliwal AS, Singh S, Kumar A, Lopez R, Gupta M, et al. Awareness of nonalcoholic fatty liver disease is increasing but remains very low in a representative US cohort. Dig Dis Sci 2020;65:978‐986. [DOI] [PubMed] [Google Scholar]
- 17. Cleveland ER, Ning H, Vos MB, Lewis CE, Rinella ME, Carr JJ, et al. Low awareness of nonalcoholic fatty liver disease in a population‐based cohort sample: the CARDIA study. J Gen Intern Med 2019;34:2772‐2778. [DOI] [PMC free article] [PubMed] [Google Scholar]
- 18. Smith BD, Holtzman D, Ward JW. Hepatitis C virus testing of persons born during 1945‐1965. Ann Intern Med 2013;158:705. [DOI] [PubMed] [Google Scholar]
- 19. Smith BD, Morgan RL, Beckett GA, Falck‐Ytter Y, Holtzman D, Teo CG, et al. Recommendations for the identification of chronic hepatitis C virus infection among persons born during 1945‐1965. MMWR Recomm Rep 2012;61:1‐32. [PubMed] [Google Scholar]
- 20. Paik JM, Golabi P, Younossi Y, Mishra A, Younossi ZM. Changes in the global burden of chronic liver diseases from 2012 to 2017: the growing impact of NAFLD. Hepatology 2020;72:1605‐1616. [DOI] [PubMed] [Google Scholar]
- 21. Younossi ZM, Stepanova M, Younossi Y, Golabi P, Mishra A, Rafiq N, et al. Epidemiology of chronic liver diseases in the USA in the past three decades. Gut 2020;69:564‐568. [DOI] [PubMed] [Google Scholar]
- 22. Ruhl CE, Everhart JE. Fatty liver indices in the multiethnic United States National Health and Nutrition Examination Survey. Aliment Pharmacol Ther 2015;41:65‐76. [DOI] [PubMed] [Google Scholar]
- 23. NIAAA . What counts as a drink. https://www.rethinkingdrinking.niaaa.nih.gov/. Accessed December 4, 2021. [Google Scholar]
- 24. Sterling RK, Lissen E, Clumeck N, Sola R, Correa MC, Montaner J, et al. Development of a simple noninvasive index to predict significant fibrosis in patients with HIV/HCV coinfection. Hepatology 2006;43:1317‐1325. [DOI] [PubMed] [Google Scholar]
- 25. Arnett DK, Blumenthal RS, Albert MA, Buroker AB, Goldberger ZD, Hahn EJ, et al. 2019 ACC/AHA guideline on the primary prevention of cardiovascular disease: a report of the American College of Cardiology/American Heart Association Task Force on Clinical Practice Guidelines. Circulation 2019;140:e596‐e646. [DOI] [PMC free article] [PubMed] [Google Scholar]
- 26. Matthews DR, Hosker JP, Rudenski AS, Naylor BA, Treacher DF, Turner RC. Homeostasis model assessment: insulin resistance and β‐cell function from fasting plasma glucose and insulin concentrations in man. Diabetologia 1985;28:412‐419. [DOI] [PubMed] [Google Scholar]
- 27. Whelton PK, Carey RM, Aronow WS, Casey DE, Collins KJ, Dennison Himmelfarb C, et al. 2017 ACC/AHA/AAPA/ABC/ACPM/AGS/APhA/ASH/ASPC/NMA/PCNA guideline for the prevention, detection, evaluation, and management of high blood pressure in adults a report of the American College of Cardiology/American Heart Association Task Force on Clinical practice guidelines. Hypertension 2018;71:E13‐E115. [DOI] [PubMed] [Google Scholar]
- 28. Grundy SM, Cleeman JI, Daniels SR, Donato KA, Eckel RH, Franklin BA, et al. Diagnosis and management of the metabolic syndrome: an American Heart Association/National Heart, Lung, and Blood Institute scientific statement. Circulation 2005;112:2735‐2752. [DOI] [PubMed] [Google Scholar]
- 29. National Center for Health Statistics . NHANES Survey Methods and Analytic Guidelines. https://wwwn.cdc.gov/nchs/nhanes/analyticguidelines.aspx. Accessed October 29, 2020. [Google Scholar]
- 30. Age and Sex Composition in the United States: 2016. United States Census Bureau. https://www.census.gov/data/tables/2016/demo/age‐and‐sex/2016‐age‐sex‐composition.html. Accessed January 20, 2021. [Google Scholar]
- 31. Leung CM, Lai LSW, Wong WH, Chan KH, Luk YW, Lai JY, et al. Non‐alcoholic fatty liver disease: an expanding problem with low levels of awareness in Hong Kong. J Gastroenterol Hepatol 2009;24:1786‐1790. [DOI] [PubMed] [Google Scholar]
- 32. Wieland AC, Mettler P, McDermott MT, Crane LA, Cicutto LC, Bambha KM. Low awareness of nonalcoholic fatty liver disease among patients at high metabolic risk. J Clin Gastroenterol 2015;49:e6‐e10. [DOI] [PubMed] [Google Scholar]
- 33. CDC . Testing recommendations for hepatitis C virus infection. https://www.cdc.gov/hepatitis/hcv/guidelinesc.htm. Accessed August 4, 2021. [Google Scholar]
- 34. World Health Organization . Make the elimination of viral hepatitis our next greatest achievement. https://www.who.int/hepatitis/news‐events/ghss‐hepatitis‐video/en/. Accessed August 4, 2021. [Google Scholar]
- 35. Said A, Gagovic V, Malecki K, Givens M, Nieto FJ. Primary care practitioners survey of non‐alcoholic fatty liver disease. Ann Hepatol 2013;12:758‐765. [PubMed] [Google Scholar]
- 36. Wieland AC, Quallick M, Truesdale A, Mettler P, Bambha KM. Identifying practice gaps to optimize medical care for patients with nonalcoholic fatty liver disease. Dig Dis Sci 2013;58:2809‐2816. [DOI] [PubMed] [Google Scholar]
- 37. Cusi K. Time to include nonalcoholic steatohepatitis in the management of patients with type 2 diabetes. Diabetes Care 2020;43:275‐279. [DOI] [PubMed] [Google Scholar]
- 38. Marchesini G, Day CP, Dufour JF, et al. EASL‐EASD‐EASO Clinical Practice Guidelines for the management of non‐alcoholic fatty liver disease. J Hepatol 2016;64:1388‐1402. [DOI] [PubMed] [Google Scholar]
- 39. Younossi ZM, Corey KE, Alkhouri N, Noureddin M, Jacobson I, Lam B, et al.; US Members of the Global Nash Council . Clinical assessment for high‐risk patients with non‐alcoholic fatty liver disease in primary care and diabetology practices. Aliment Pharmacol Ther 2020;52:513‐526. [DOI] [PubMed] [Google Scholar]
- 40. Younossi ZM, Noureddin M, Bernstein D, Kwo P, Russo M, Shiffman ML, et al. Role of noninvasive tests in clinical gastroenterology practices to identify patients with nonalcoholic steatohepatitis at high risk of adverse outcomes: expert panel recommendations. Am J Gastroenterol 2021;116:254‐262. [DOI] [PubMed] [Google Scholar]
- 41. Setiawan VW, Stram DO, Porcel J, Lu SC, Le Marchand L, Noureddin M. Prevalence of chronic liver disease and cirrhosis by underlying cause in understudied ethnic groups: the multiethnic cohort. Hepatology 2016;64:1969‐1977. [DOI] [PMC free article] [PubMed] [Google Scholar]
- 42. Schneider AL, Lazo M, Selvin E, Clark JM. Racial differences in nonalcoholic fatty liver disease in the U.S. population. Obesity 2014;22:292‐299. [DOI] [PMC free article] [PubMed] [Google Scholar]
- 43. Araneta MR, Barrett‐Connor E. Ethnic differences in visceral adipose tissue and type 2 diabetes: Filipino, African‐American, and white women. Obes Res 2005;13:1458‐1465. [DOI] [PubMed] [Google Scholar]
- 44. Lear SA, Humphries KH, Kohli S, Chockalingam A, Frohlich JJ, Birmingham CL. Visceral adipose tissue accumulation differs according to ethnic background: results of the Multicultural Community Health Assessment Trial (M‐CHAT). Am J Clin Nutr 2007;86:353‐359. [DOI] [PubMed] [Google Scholar]
- 45. Hernaez R, McLean J, Lazo M, Brancati FL, Hirschhorn JN, Borecki IB, et al. Association between variants in or near PNPLA3, GCKR, and PPP1R3B with ultrasound‐defined steatosis based on data from the third National Health and Nutrition Examination Survey. Clin Gastroenterol Hepatol 2013;11:1183‐1190.e1182. [DOI] [PMC free article] [PubMed] [Google Scholar]
- 46. Wagenknecht LE, Palmer ND, Bowden DW, Rotter JI, Norris JM, Ziegler J, et al. Association of PNPLA3 with non‐alcoholic fatty liver disease in a minority cohort: the Insulin Resistance Atherosclerosis Family Study. Liver Int 2011;31:412‐416. [DOI] [PMC free article] [PubMed] [Google Scholar]
- 47. Romeo S, Kozlitina J, Xing C, Pertsemlidis A, Cox D, Pennacchio LA, et al. Genetic variation in PNPLA3 confers susceptibility to nonalcoholic fatty liver disease. Nat Genet 2008;40:1461‐1465. [DOI] [PMC free article] [PubMed] [Google Scholar]
- 48. Guerrero R, Vega GL, Grundy SM, Browning JD. Ethnic differences in hepatic steatosis: an insulin resistance paradox? Hepatology 2009;49:791‐801. [DOI] [PMC free article] [PubMed] [Google Scholar]
- 49. Arshad T, Paik JM, Biswas R, Alqahtani SA, Henry L, Younossi ZM. Nonalcoholic fatty liver disease prevalence trends among adolescents and young adults in the United States, 2007‐2016. Hepatol Commun. In Press. [DOI] [PMC free article] [PubMed] [Google Scholar]
- 50. White K, Lawrence JA, Tchangalova N, Huang SJ, Cummings JL. Socially‐assigned race and health: a scoping review with global implications for population health equity. Int J Equity Health 2020;19:25. [DOI] [PMC free article] [PubMed] [Google Scholar]
- 51. Lazarus JV, Colombo M, Cortez‐Pinto H, Huang T‐K, Miller V, Ninburg M, et al. NAFLD—sounding the alarm on a silent epidemic. Nat Rev Gastroenterol Hepatol 2020;17:377‐379. [DOI] [PubMed] [Google Scholar]
Associated Data
This section collects any data citations, data availability statements, or supplementary materials included in this article.
Supplementary Materials
Table S1‐S8