

Abstract
The dispersal of rice (Oryza sativa) following domestication influenced massive social and cultural changes across South, East, and Southeast (SE) Asia. The history of dispersal across islands of SE Asia, and the role of Taiwan and the Austronesian expansion in this process remain largely unresolved. Here, we reconstructed the routes of dispersal of O. sativa ssp. japonica rice to Taiwan and the northern Philippines using whole-genome resequencing of indigenous rice landraces coupled with archaeological and paleoclimate data. Our results indicate that japonica rice found in the northern Philippines diverged from Indonesian landraces as early as 3,500 years before present (BP). In contrast, rice cultivated by the indigenous peoples of the Taiwanese mountains has complex origins. It comprises two distinct populations, each best explained as a result of admixture between temperate japonica that presumably came from northeast Asia, and tropical japonica from the northern Philippines and mainland SE Asia, respectively. We find that the temperate japonica component of these indigenous Taiwan populations diverged from northeast Asia subpopulations at about 2,600 BP, whereas gene flow from the northern Philippines had begun before ∼1,300 BP. This coincides with a period of intensified trade established across the South China Sea. Finally, we find evidence for positive selection acting on distinct genomic regions in different rice subpopulations, indicating local adaptation associated with the spread of japonica rice.
Keywords: domestication, crop evolution, admixture, Austronesian expansion
Introduction
The Austronesian expansion is considered one of the last of the great movements of human populations. Current portrayals have suggested that Austronesians originated from Taiwan, and beginning around 3000 to 1500 before common era (BCE) began a seaborne migration that led to the spread of people, crops, and technology across island Southeast (SE) Asia, Oceania, and Madagascar (Bellwood 1997, 2005; Diamond 2001; Diamond and Bellwood 2003). This dispersal is presumed to have led to the spread of Austronesian languages, as well as cultural similarities between the indigenous peoples of Taiwan, island SE Asia, and Polynesia, including the practices of tattooing, stilt houses, jade carving, weaving, and agriculture (Blust 1995; Bellwood 1997; Pawley 2003). The Austronesian expansion is also thought to have led to these cultures sharing a common set of domesticated plants and animals that were presumably brought with them during their migrations, including bananas, coconuts, breadfruit, yams, taro, chickens, pigs, and dogs (Pawley 2003).
The movement of Oryza sativa (Asian rice) into much of island SE Asia has also been linked to the Austronesian expansion (Bellwood 1997, 2005; Diamond 2001). Asian rice is one of the most important food species in the world, providing the major calorie source for more than one-half of the world’s population and playing a significant role in the global economy (Latham 2013; Hamilton 2014). This species was first domesticated from wild Oryza rufipogon more than 8,000 years before present (BP) in the Lower Yangtze Valley in southern China, and subsequently went through a protracted period of selection by humans leading to O. sativa ssp. japonica (Purugganan and Fuller 2011; Choi et al. 2017; Ishikawa et al. 2020). This subspecies is grown primarily in temperate Northeast (NE) and tropical SE Asia, although today is also found in Europe, Africa, and the Americas. Japonica rice is thought to have contributed domestication alleles through introgression to cultivated proto-indica rice in India (Fuller 2011), which gave rise to O. sativa ssp. indica, another major rice subspecies that is widely grown in tropical Asia (Choi et al. 2017).
The dispersal of japonica rice to island SE Asia has been a subject of intense debate and interest, because rice agriculture is a foundational element of the food and culture of the region. A leading theory posits that rice and rice agriculture spread to island SE Asia from Taiwan as part of an Austronesian demographic expansion ∼3,500–5,000 BP (Bellwood 2004), first to the Philippine archipelago just south of Taiwan, and from there to the rest of SE Asia. As part of the southward spread of rice from the Yangtze basin after its domestication, rice cultivation appears to have been established on Taiwan and adjacent Fujian by 4,600 BP (Qin and Fuller 2019; Gao et al. 2020), and could therefore conceivably have been the source population for this domesticated crop in island SE Asia. Part of the evidence for rice movement into island SE Asia from Taiwan rests largely on linguistic grounds, as the proto-Austronesians already had words for rice and rice-associated activities that is shared with other Austronesian languages in SE Asia (Blust 1995; Diamond 2001; Pawley 2003; Spriggs 2003; Bellwood 2005; Bedford 2006).
Despite the role of Taiwan in the Austronesian expansion of humans into island SE Asia, the role of the Taiwanese dispersal route in the movement of rice remains unclear. The simple Out-of-Taiwan hypothesis for the spread of rice in island SE Asia has been disputed on the grounds that migrating Austronesian speakers may have mixed with local populations, and instead of bringing rice they switched to farming locally sourced tuber crops like yams and taro (Donohue and Denham 2010; Bellwood 2011). Human genetic studies suggest, for example, that indigenous peoples related to those in contemporary mainland SE Asia were already present in island SE Asia before the arrival of Austronesian-speaking groups (Lipson et al. 2018, 2014; McColl et al. 2018; Larena et al. 2021). Early movement of peoples in the region is also supported by a recent reappraisal of ceramic assemblages from 20 archaeological sites in island SE Asia and western Oceania, which likewise indicate a more complex, multidirectional set of Neolithic dispersals over the last ∼5,500 years (Cochrane et al. 2021).
Thus, even as the human Austronesian expansion may have led to the southward movement of people and cultures Out-of-Taiwan (Lipson et al. 2014; Mörseburg et al. 2016; Yang et al. 2020), wet rice agriculture may not have come from this island, but instead may represent a separate introduction from mainland SE Asia. Current evidence suggests an early introduction of upland (dry) rice into mainland SE Asia after ∼4,000 BP, whereas a transition from upland rice to more productive wet rice took place later and was uneven across SE Asia (Castillo 2017; d’Alpoim Guedes et al. 2020); this is seen ∼2,000 BP in northeast Thailand (Castillo et al. 2018), and ∼2,400 BP in central Yunnan (Dal Martello et al. 2021). Ocean sediments near the Pearl River delta also record a marked shift in proxies for erosion and upriver weathering from ∼2,500 BP, consistent with the intensification and expansion of agriculture throughout the Pearl River (Hu et al. 2013). Pollen records from around the coasts of southern China and SE Asia suggest the expansion of lower alluvial plains after ∼2,700 BP that would have facilitated the establishment of wet rice farming in this period and near coastal areas (Ma et al. 2020).
In a recent study, we provided a model for how rice spread across East, South, and SE Asia following its domestication (Gutaker et al. 2020), showing the broad patterns of dispersal of japonica and indica. In particular, japonica rice was split into tropical and temperate lineages around 4,100 years BP, which is coincident with the 4.2K global cooling event and led to the divergent adaptation of rice in NE Asia and increasing confinement of tropical rice to the south in mainland and island SE Asia. Our previous work using primarily whole-genome resequencing data, however, was unable to address the role of Taiwan in the dispersal of rice. The Taiwanese japonica rice varieties we previously used (Gutaker et al. 2020) clustered with lowland temperate varieties from Japan and South Korea, and do not appear to represent traditional landraces. Ten of the 12 Taiwanese japonicas in that data set have been subsequently identified as varieties whose parental lines are originally from Japan, which is consistent with Taiwan’s history of Japanese colonization and agronomy in much of the first half of the 20th century (e.g. Iso 1954). Thus, our previous analysis could not elucidate possible relationships between indigenous Taiwanese rice and other subpopulations across the region.
In the present study, we sought to examine in greater detail the movement of rice along the maritime routes between East and SE Asia by sampling rice landraces cultivated by Taiwanese indigenous peoples in the inland mountains, as well as additional traditional varieties grown in the rice terraces from the Cordillera mountain region in northern Philippines. Using population genomic analysis, we find that Taiwan is a contact zone for temperate japonica from the north and tropical japonica from the south. We also find evidence that indigenous rice from the northern part of Luzon Island in the Philippine archipelago likely came up from the south rather than from Taiwan, contrary to the predictions of the Out-of-Taiwan theory.
Results
Indigenous Taiwanese and Northern Philippine Rice from Distinct Genetic Clusters
To investigate the demographic history of rice in Taiwan and island SE Asia, we sampled indigenous O. sativa ssp. japonica rice landraces from Taiwan (n = 24) and the Philippines (n = 13) (fig. 1 and supplementary table S1, Supplementary Material online). The Taiwanese rice landraces had been cultivated by the indigenous peoples in the mountainous regions of Taiwan, and two samples were collected in the last decade whereas the rest were sampled during the early Japanese colonial period more than 100 years ago. Based on the names, several of the samples appear to have been cultivated by the Atayal, Paiwan, Bunan groups. The Philippine rice varieties were collected between 1963 and 1981 from the rice terraces of the Cordillera region in northern Luzon; these terraces are farmed by the indigenous Ifugao people and other ethnolinguistic groups in the area.
Fig. 1.
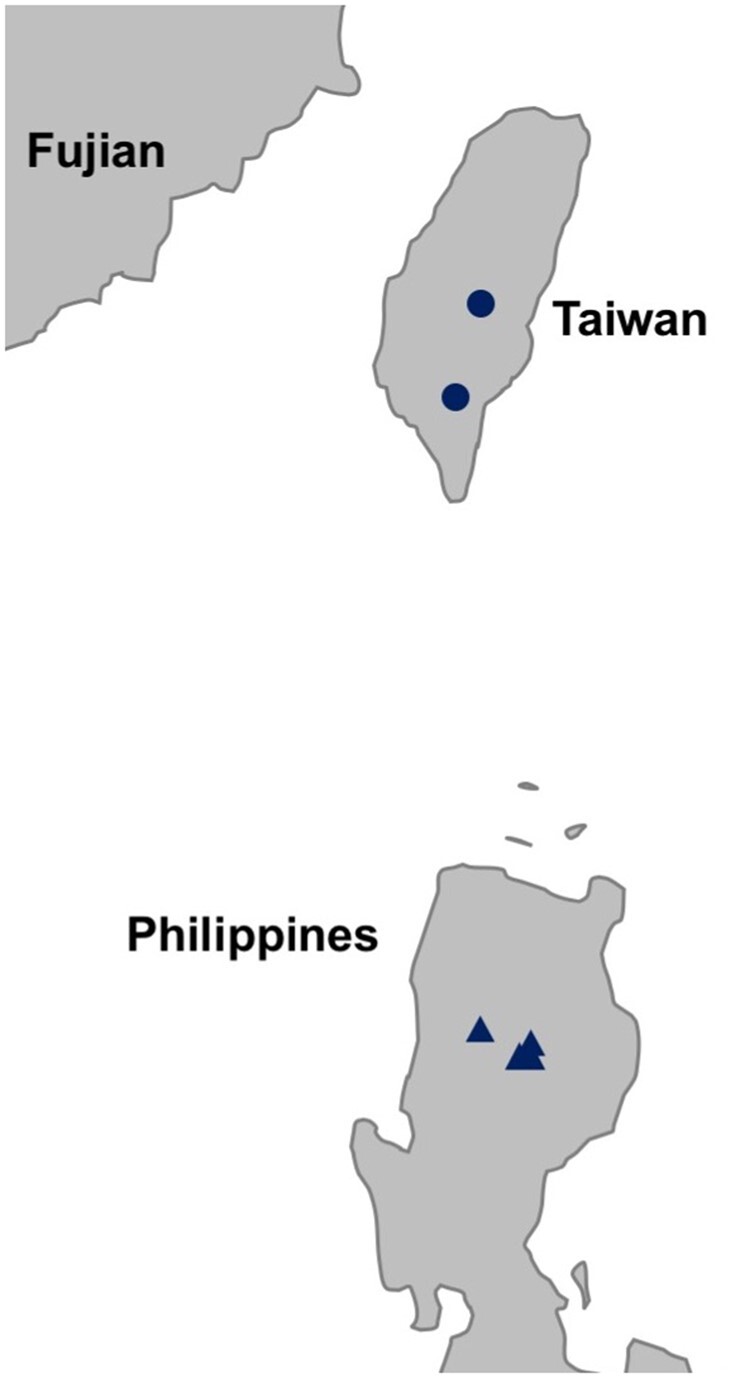
Sampling locations of Taiwan and Northern Philippines Oryza sativa ssp. japonica landraces. The approximate locations of Taiwan indigenous landraces in the central mountain range are indicated by the circle; the precise sampling locations are unknown. The triangles indicate sampling locations of the northern Philippine landraces in the Cordillera region of the island of Luzon.
The Taiwanese and Philippine landraces were sequenced using 2 × 100 bp paired-end Illumina sequencing. This sequence data was added to the japonica panel from our previous study (Gutaker et al. 2020), to construct a new panel containing 367 japonica rice landraces from South, East, and SE Asia (fig. 2A and supplementary table S2, Supplementary Material online). We also included the genome sequence of O. barthii in the panel to serve as an outgroup. Reads from this panel were mapped to the reference genome of indica variety Shuhui498 v.1.0 (Du et al. 2017), yielding ∼7.46 million single-nucleotide polymorphisms (SNPs) with a mean read depth of 8.76×.
Fig. 2.

Population structure of japonica rice. (A) Map of collection sites for all the japonica landraces used in this study. Colors represent regions of origin, as indicated in the next panel. Gray dots are landraces that do not fall into the discretized genetic/geographic clusters. (B) Subpopulations of japonica rice. All japonica landraces projected onto the first two dimensions after multidimensional scaling of genomic distances. The japonica genotypes were clustered using K-medoids (K = 11 subpopulations) and filtered using silhouette parameters, which resulted in Kd = 11 discrete subpopulations (colored labels). Pie charts representing the geographical composition of each discrete subpopulation of japonica subgroups. Each cluster is named for the general region where these landraces are found (e.g., SE Asia) and/or type of landrace (e.g., temperate, upland). Chart diameter is proportional to the number of individuals in each subpopulation. Geographical country codes are: BTN = Bhutan, CHN = China, IDN1 = Sumatra, IDN2 = Java, IDN3 = Borneo, IDN4 = Sulawesi, JPN = Japan, KOR = Korea, LAO = Laos, MYS = Malay Peninsula or neighboring, PHL = Philippines from Gutaker et al. (2020), PHL2 = Philippines from the current study, THA = Thailand, TWN = Taiwan from Gutaker et al. (2020), TWN2 = Taiwan from the current study.
To identify distinct geographical populations of O. sativa ssp. japonica, we employed K-medoid clustering based on genomic distances. At lower Kd values, the clusters mirrored those from previous analyses (Gutaker et al. 2020). For example, at Kd = 2, we see the separation of temperate and tropical japonica, and at Kd = 3, we see the further separation of mainland and island SE Asian tropical japonica. At Kd = 9 and above, the clustering analysis revealed two distinct Taiwanese clusters containing the new Taiwanese samples (designated as Taiwan 1 and 2), whereas the Philippine Cordillera samples grouped with largely northern Philippine samples from our previous analysis (Gutaker et al. 2020) (supplementary table S2 and fig. S1, Supplementary Material online). We saw substantial congruence between genetic clusters and geographical locations of the japonica landraces at Kd = 11 (fig. 2). We thus conducted all subsequent analyses on the subpopulation clusters defined at Kd = 11, which contained 10 subpopulations (after excluding one subpopulation with n = 2 landraces) that our analysis indicates are discrete genetic clusters. We should note that our analysis does not include landraces that do not belong to any of these discrete clusters as they are likely admixed individuals.
Relationships between Taiwanese and Philippine japonica Rice
To reconstruct subpopulation splits and dispersals in the history of O. sativa ssp. japonica using SNP data, we first employed QPGRAPH, which looks at relationships between subpopulations by building admixture graphs based on fitting Patterson’s f-statistics (Patterson et al. 2012). When constructing admixture graphs using QPGRAPH, we found no significant (maximum |z-score| < 3) models beyond Kd = 9 subpopulations, and therefore report the model with the lowest maximum |z-score| that excludes the mainland SE Asian/Laos and the NE Asia upland temperate subpopulations; these two subpopulations have been shown in our analysis to be admixed in our K = 11 model (see supplementary fig. S2, Supplementary Material online). The admixture graph at Kd = 9 with the lowest maximum |z-score| (fig. 3A, maximum |z-score| = 2.907) suggests that the Philippine landraces are divided into one group that is predominantly in the Philippines and Borneo, and another group that is narrowly distributed in the northern Philippines. The northern Philippines group is largely concentrated in and around the mountainous Cordillera region in the northern Luzon island of the Philippine archipelago, and include traditional rice varieties grown in the rice terraces by the Ifugao peoples. In contrast, the Philippine/Borneo group is comprised of landraces mostly from the central Philippine island of Mindoro and from the island of Borneo (southwest of the Philippine archipelago), and from the islands of Java and Sulawesi. Both of these two Philippine groups are related to an Indonesian group comprised primarily of landraces from the islands of Java, Sulawesi, and Sumatra.
Fig. 3.

Admixture graph and TREEMIX models of japonica rice. (A) Admixture graph Kd = 9 japonica subpopulations (maximum |z-score| = 2.907), rooted with Oryza barthii as an outgroup. This graph represents topology that is consistent between models for all lower values of K. Solid lines with arrowheads indicate lineages with uniform genetic ancestries, with the scaled drift parameter f2 shown next to these lines. Dashed lines lead to subpopulations with mixed ancestries, with the estimated proportion of ancestry indicated by the percentage values. (B) Maximum likelihood trees based on Treemix. When a subpopulation has multiple ancestry sources, it forms a clade with one of the sources whereas an accompanying arrow indicates shared ancestry with the other source; this analysis is suggestive (but not conclusive) on the level and direction of gene flow.
Our admixture graph analysis indicates that the subpopulations Taiwan 1 and 2 share ancestry with both temperate and tropical japonica. The Taiwan 1 subpopulation shares ancestry with the NE Asian lowland temperate japonica group (which are mostly from South Korea and Japan) and the northern Philippine group. For Taiwan 2, we also find shared ancestry with the NE Asian lowland temperate group, as well as the tropical mainland SE Asia/Bhutan subpopulation (fig. 3A). If we include the admixed mainland SE Asia/Laos subpopulation in our analysis, however, as in our K = 11 model, we find that these Laotian landraces are most closely related to the Taiwan 2 landraces. It should be noted that currently these mainland SE Asian/Laos landraces in our panel are mostly from Laos, and there is a paucity of samples from other areas in mainland SE Asia that may prove closer to Taiwan 2.
To compare different models that include the relative position of the Taiwan subpopulation, we undertook a simplified admixture graph analysis with different topologies of genetic relationships between Taiwan, Northern Philippines, and Java/Sulawesi/Sumatra, and NE Asian lowland temperate subpopulations. Here, we focus on Taiwan 1 because this is the most relevant for our subsequent analysis on the movement of rice in island SE Asia. Using the base topology (fig. 3A) and O. barthii as an outgroup, we compared the following four models: i) Taiwan 1 forms a clade with the shared ancestor of both the Northern Philippines and Java/Sulawesi/Sumatra, with NE Asian lowland temperate as sister to these three populations, no admixture between populations (this model would be the strict Out-of-Taiwan model), ii) Taiwan 1 in a clade with NE Asian lowland temperate, whereas Northern Philippines in a clade with Java/Sulawesi/Sumatra, no admixture, iii) Taiwan 1 forms a clade with Northern Philippines, whereas Java/Sulawesi/Sumatra forms a clade with NE Asian lowland temperate, no admixture, and iv) the inferred topology between these subpopulations depicted in our best model (fig. 3A) where Northern Philippines forms a clade with Java/Sulawesi/Sumatra, and Taiwan 1 is an admixture between Northern Philippines and NE Asian lowland temperate. In this analysis, only model (iv) is supported (|z| = 1.771), and the other three models have substantially larger z values and are rejected based on our criteria of |z| < 3 (|z| in the other models ranged from 7.411 to 11.257; see supplementary fig. S3, Supplementary Material online). This result is consistent with the topology depicted in our global admixture analysis (fig. 3A), and we should note that the model that represents a strict Out-of-Taiwan scenario for rice moving to island SE Asia is rejected.
Finally, we explored population relationships between geographic subpopulations of japonica rice using TREEMIX, which uses allele frequencies to infer relationships as well as between-population migrations (Pickrell and Pritchard 2012). The model inferred from TREEMIX (fig. 3B) is generally consistent with our QPGRAPH results and previous analyses (Gutaker et al. 2020). It reveals an early split between lowland temperate and tropical japonica, followed by subsequent divergence between mainland and island SE Asian tropical japonica subpopulations (fig. 3B). Also consistent with our previous results (Gutaker et al. 2020) and the admixture graph analyses (see above), we find four gene flow episodes that lead to mixed ancestry for several geographic subpopulations (fig. 3B). For example, the NE Asian upland temperate japonica (found primarily in China, Japan, and Korea) appears to share ancestry with island SE Asian tropical subpopulation from the northern Philippines and Taiwan 1, and gene flow with the NE Asian lowland temperate japonicas. Taiwan 2 shares ancestry with a lineage close NE Asian lowland temperate japonica, with gene flow from the mainland SE Asia/Laos group. It should be noted, however, that both the admixture graph and TREEMIX analysis provide global views of shared ancestries that may arise from migration events; they are less informative on the levels and directions of gene flow.
Taiwan as a Contact Zone between Temperate and Tropical japonica
To better examine the extent of gene flow, we estimated the proportions of ancestry in these potentially admixed geographic subpopulations in Taiwan. We used the QPADM framework which can evaluate models with combinations of ancestral subpopulations (Haak et al. 2015). We evaluated each Taiwanese subpopulation as a product of two- to four-way admixtures between combinations of subpopulations. The best supported models are consistent with results from QPGRAPH. We find that Taiwan 1 shares 57.4–63.0% of its ancestry with the northern Philippine subpopulation and 30.7–34.0% with the NE Asian lowland temperate group. Taiwan 2 shares 70.3% of its ancestry with the mainland SE Asia/Laos subpopulation and 23.8% from NE Asian lowland temperate group (supplementary fig. S4, Supplementary Material online). Across these models, minor contributions (2.4–5.5%) from the other Taiwanese landraces that cluster with the NE Asia lowland temperate group could either reflect actual contribution from a geographically proximal subpopulation, or represent artifacts of the shared lowland temperate ancestry of the two subpopulations. Similarly, minor contributions from the island SE Asian Java/Sulawesi/Sumatra (8.2%) and Borneo (3.4%) groups to Taiwan 1 in two separate models could be artifacts via their similarity with the northern Philippines group.
To validate the relationships among island SE Asian subpopulations and Taiwan 1 and 2, we use the outgroup f3-test for detecting shared genetic drift between populations (Raghavan et al. 2014). We calculated f3 (OUT; X, Laos) and f3 (OUT; X, northern Philippines), where OUT is the outgroup O. barthii, and X is our focal subpopulation (Taiwan 1 or 2). Our results do indicate a high degree of shared genetic drift between Taiwan 1 and the northern Philippine subpopulations (f3 = 0.0562, |z| = 34.5), and Taiwan 2 and the mainland SE Asian/Laos groups (f3 = 0.0542, |z| = 42.6) relative to other comparisons, as we would expect if there was gene flow between these subpopulation pairs (supplementary fig. S5, Supplementary Material online). We also found shared drift between NE lowland temperate japonica and both Taiwan 1 (f3 = 0.0494, |z| = 37.3) and Taiwan 2 (f3 = 0.0498, |z| = 41.9) (supplementary fig. S5, Supplementary Material online).
Finally, we performed f4 tests for admixture for both Taiwan 1 and 2; in this test, we calculate f4 (A, B; C, D), where the Taiwanese subpopulation is C, and A is the outgroup O. barthii, and B and D are alternately the NE Asian lowland temperate, northern Philippines or mainland SE Asian/Laos subpopulations. Significantly negative f4 values would indicate gene flow between populations B and C. We again find evidence for gene flow with northern Philippines for Taiwan 1 (f4 [OUT, northern Philippines; Taiwan 1, NE Asia lowland temperate] = −0.0098, z = −12.87), and mainland SE Asia/Laos with Taiwan 2 (f4 [OUT, mainland SE Asia/Laos; Taiwan 2, NE Asia lowland temperate] = −0.0076, z = −16.1) (fig. 4).
Fig. 4.

f4 statistics to detect relative degrees of gene flow. The f4 statistics is calculated between each Taiwanese subpopulation and the putative admixing sources mainland SE Asia/Laos, NE Asia lowland temperate, and Northern Philippine subpopulations. The f4 statistic were calculated for the model (OUT, mainland SE Asia; Taiwan, X) in squares, (OUT, NE Asia lowland temperate; Taiwan, X) in circles, and (OUT, Northern Philippines; Taiwan, X) in triangles, with OUT being Oryza barthii and X the subpopulations in the rows. The error around the mean (± standard error) of the f4 statistics are indicated. The dashed line denotes f4 = 0.
Demographic Models Elucidate Gene Flow Dynamics between Taiwan and the Philippines
Our analyses indicate shared ancestry between Taiwanese, tropical SE Asian, and temperate NE Asian subpopulations which suggests gene flow along a north-south cline in the eastern periphery of Asia. We examine this gene flow further, including the direction of migration, using demographic modeling. As the Taiwan 2 subpopulation shares ancestry with the mainland SE Asian/Laos cluster, which itself appears to be an admixed subpopulation and thereby complicates demographic modeling, we focused our attention on Taiwan 1. Moreover, the focus on the relationship between Taiwan 1 and the northern Philippines groups allows us to examine the possible role of Taiwan in the expansion of rice agriculture to island SE Asia as proposed by the Out-of-Taiwan hypothesis for Austronesian expansion (Bellwood 2004).
We performed demographic modeling using δaδi (Diffusion Approximation for Demographic Inference), which allows for demographic history based on diffusion approximations to the joint allele frequency spectrum (Gutenkunst et al. 2009). We estimated the timing of divergence between the NE Asian lowland temperate and Taiwan 1 subpopulations, and the magnitude and directionality of gene flow between the northern Philippines and Taiwan 1 (supplementary fig. S6, Supplementary Material online). In our final set of models, we fix the split of temperate and tropical japonica to 4,100 years BP, based on previous estimates (Gutaker et al. 2020). Changing this divergence time does not substantially affect our conclusions.
We first compared the topologies (northern Philippines [Taiwan 1, NE Asia lowland temperate]) and (NE Asia lowland temperate [Taiwan 1, northern Philippines]) with or without symmetrical gene flow between Taiwan 1 and the other subpopulations. The best model supported the first topology (northern Philippines [Taiwan 1, NE Asia lowland temperate]) with symmetrical gene flow (log likelihood [log L] = −506,752.67; P = 0.044 vs. no gene flow model). This indicates that the Taiwanese population was first established as a lineage from temperate japonica. Next, we compared the model of (northern Philippines [Taiwan 1, NE Asia lowland temperate]) with symmetrical gene flow versus models of unidirectional or asymmetrical bidirectional gene flow between Taiwan and the Philippines. The best model supported asymmetrical bidirectional migration (log L = −455,586.18, P = 0.01 vs. symmetrical migration model), with Taiwan splitting off from lowland temperate ∼2,644 years ago (confidence interval [CI], 2,112–3,063 years ago). The rate of migration in this model from the Philippines to Taiwan is 3.57 × 10⁻⁴ (CI 2.82–4.51 × 10⁻⁴), which is an order of magnitude higher than the rate in the reverse direction (∼2.14 × 10⁻⁵, CI 2.62 × 10⁻⁶–1.74 × 10⁻⁴; fig. 5). This suggests that gene flow occurred predominantly from the Philippines to Taiwan.
Our models assumed diffuse migration rates over the entire period since the split of the Taiwanese and NE Asia lowland temperate subpopulations. Alternatively, we examined a bidirectional pulsed migration model, where we allowed a single pulse of admixture in each direction between Taiwan and the Philippines (fig. 5). Except for migration parameters, all other parameters were fixed from the best asymmetric bidirectional gene flow model above. In the best model (log L = −444,857.93) we found a small early pulse from Taiwan to the Philippines, contributing 1.38% (CI 1.378–1.381%) approximately 40 years (CI 27–60) after the Taiwan/NE Asia lowland temperate split. This was followed by a major pulse ∼1,372 years after the Taiwan/NE Asia lowland temperate divergence (CI 1,212–1,554), where gene flow was from the Philippines to Taiwan, contributing 57.95% (CI 57.39–58.52; fig. 5). Together, these results suggest early gene flow from the Philippines to Taiwan, likely occurring ∼1,300 years ago or earlier.
Fig. 5.

Demographic models of japonica rice in Taiwan and SE Asia using δaδi. (A) Model of diffuse bidirectional asymmetric gene flow between Taiwan and northern Philippines. (B) Model of pulsed bidirectional asymmetric gene flow between Taiwan and northern Philippines. (C) Model of divergence between Java/Sulawesi/Sumatra and northern Philippines and (D) mainland SE Asia/Bhutan subpopulations. All inferred parameter estimates are in bold. Migration parameters are indicated over horizontal arrows, whereas divergence times by vertical arrows. The 95% confidence intervals are in parentheses. Models depicted in (B) and (C) did not include gene flow as there was no evidence of significant admixture with these subpopulations.
Paleoclimate Modeling and Rice in Taiwan
Our analysis suggests that temperate japonica may have been introduced in Taiwan as early as ∼2,600 years ago. We estimated the probability of the thermal niche suitability of temperate versus tropical rice in Taiwan from approximately 5,500 to 1,000 years ago (fig. 6). We assume a requirement of 2,900 growing degree-days (GDD) at 10 °C base for tropical japonica and 2,500 GDD at 10 °C base for temperate japonica. Our analysis shows that the climate in Taiwan ∼4,000 years ago and earlier was suitable for tropical japonica rice, but the climate had become more favorable for temperate japonica as opposed to tropical japonica by ∼3,600 years ago, especially in the mountainous interior.
Fig. 6.

Thermal niche modeling for japonica rice in Taiwan. Tn is 100 × log of the ratio of probability of temperate versus tropical rice thermal niche suitability (assuming requirement of 2,900 GDD at 10 °C base for tropical japonica and 2,500 GDD at 10 °C base for temperate japonica) over time. The line represents mean and the gray-shaded area represents 25–75% probability of being in the thermal niche. The estimated time of divergence between the Taiwan and NE Asian lowland temperate subpopulations is indicated.
Dispersal of Early Tropical japonica Rice across Island SE Asia
Across island SE Asia, we have identified four genetic clusters for japonica rice: the northern Philippine cluster, a Java/Sulawesi/Sumatra Indonesian cluster, a Philippine/Borneo group and a Borneo-specific subpopulation. The relationships between these populations are somewhat different compared with our previous work in the placement and admixture of the Borneo group, which in our analysis shares ancestry with an ancestral island SE Asian (possibly Indonesian) lineage and the Philippine/Borneo group. In both analyses, however, the relationships suggest that contemporary japonica rice landraces in island SE Asia likely moved first to the Indonesian archipelago, and later northwards to the Philippines.
We undertook δaδi analysis to infer the dates of divergence between island (Java/Sulawesi/Sumatra) and mainland SE Asia (Bhutan) landraces, and between the northern Philippine and Java/Sulawesi/Sumatra subpopulations within island SE Asia. From our δaδi analysis, we find that the divergence of the Bhutan versus Java/Sulawesi/Sumatra subpopulations occurred ∼3,584 years ago (CI 2,648–3,917 years ago) and the northern Philippines versus Java/Sulawesi/Sumatra groups around the same time at ∼3,424 years ago (CI 2,338–3,841 years ago; fig. 5). Interestingly, the δaδi analysis suggests an earlier time for the diversification of tropical japonica across SE Asia by 500–1,000 years from our previous analysis (Gutaker et al. 2020), although the confidence intervals of the estimates from the δaδi analyses overlap with the distribution of our previous split time estimates using the sequentially Markovian coalescent (Gutaker et al. 2020).
Selection Associated with the Dispersal of japonica Rice in Taiwan and Island SE Asia
Elucidation of the demographic history of O. sativa ssp. japonica subpopulations corresponding to geographical locations across South, East, and SE Asia enables us to study the extent and timing of local adaptations in rice populations during their dispersal. In the current study, we employed the recently developed method GRoSS (Graph-aware Retrieval of Selective Sweeps) (Refoyo-Martínez et al. 2019) to scan for genomic regions under selection across different branches of our best admixture graph model (fig. 3A).
In our analysis, we inferred selection across the genome in 10-SNP windows for each branch of the admixture graph. The method essentially functions as an outlier test, and if we choose P < 10−4, we find 2,139 out of 15,145,525 SNP windows putatively under selection across 12 of 25 branches in the admixture graph of japonica (fig. 7). If we choose the more conservative P value threshold of P < 10−5, we find 64 SNP windows across 3 of 25 branches in japonica (fig. 6). In the more conservative threshold, selection was detected in the lineages leading to the two Taiwan and the Philippine/Borneo populations.
Fig. 7.

Selection in specific subpopulation branches using Graph-aware Retrieval of Selective Sweeps (GRoSS). The horizontal lines demarcate the thresholds of P < 10−4 and P < 10−5. The different colors in the plot represent branches leading to different subpopulations in the admixture graph. Borneo, black; NE Asia lowland temperate, peach; Northern Philippines, blue; Philippines/Borneo, pink; Taiwan 1, orange; Taiwan 2; teal. The peaks associated with OsUGT706D1 and OsTBT1 are indicated.
We investigated potential targets of selection by looking at overlaps between regions under selection, and both functionally annotated genes, and genes associated with known quantitative trait nucleotides (QTNs) for abiotic stresses (Wei et al. 2021). At P < 10−4, we found overlap of putatively selected genomic regions with 92 distinct annotated genes with a wide range of predicted functions (supplementary table S3, Supplementary Material online). Two of these genes, OsTBT1 and OsUGT706D1, which are found in genomic regions under selection in the Philippines/Borneo and Taiwan 2 subpopulations, respectively, are associated with known QTNs (Wei et al. 2021). Interestingly, OsUGT706D1 has been shown to be associated with UV tolerance (Peng et al. 2017), and may hold some functional relevance in adaptation to growing at higher altitudes in Taiwan. OsTBT1 is a BAHD N-acyltransferase that is known to modulate levels of benzoyl tryptamine, which is involved in defense against biotic and abiotic stress (Park et al. 2014). At P < 10−5, we found overlap of regions putatively under selection with nine distinct annotated genes, and two of these regions are within 10 kb of OsTBT1 and OsUGT706D1 (supplementary table S4, Supplementary Material online).
Discussion
The question of the establishment of japonica rice in Taiwan and island SE Asia remains historically entangled with the expansion of Austronesian-speaking peoples out of Taiwan into SE Asia, Polynesia, and Melanesia (Bellwood 2011). Rice cultivation was brought to Taiwan and was established by 4,600 BP, possibly via Jiangxi and overland cultural expansion from the mixed rice-millet farmers of Jiangxi and interior Fujian (Gao et al. 2020; Deng, Yan, et al. 2020). Based on site locations, some arable weed flora assemblages and the co-occurrence with millets, this early rice is inferred to be ancestral japonica and grown under upland conditions (Qin and Fuller 2019; Deng, Yan, et al. 2020; Fuller 2020). From this region of southern China upland rice and millets also dispersed through mainland SE Asia from northern Vietnam to central Thailand between 4,300 and 3,700 years ago (Castillo 2017; Higham 2021). Alternatively, linguistic, genomic, and other cultural markers have also led to suggestions that the Shandong peninsula in NE China was where these early Taiwanese inhabitants originated, possibly migrating via intermediate coastal settlements on the mainland (Sagart et al. 2018).
Dispersal of rice to the northern Philippines and across island SE Asia, however, is unclear. Austronesian migrants from Taiwan is though to have settled in Luzon, the largest northernmost island of the Philippine archipelago, ∼4,000 years ago (Gray and Jordan 2000; Diamond and Bellwood 2003). From there they expanded across SE Asia, and it was theorized that this migration also brought with it rice agriculture (Bellwood 2004, 2011). The colonization of the Philippines, however, appears to have been more complex. A recent analysis (Larena et al. 2021) indicates that the ethnic Manobo and Sama group in central and southern Philippines appear to have migrated from the south, possibly ∼12,000 years ago. In contrast, the Cordillera indigenous group in northern Luzon, who cultivated the northern Philippine rice landraces reported here, are clearly related to the Taiwan Ami and Atayal indigenous peoples, but apparently diverged from each other ∼8,500 years ago (Larena et al. 2021). Thus, the settling of Taiwan and northern Luzon may have occurred prior to the arrival of rice agriculture in the area.
This provides context for our genomic analysis, which indicates that tropical japonica from across island SE Asia show affinities with subpopulations from mainland SE Asia rather than Taiwan. Our demographic models, which assume a temperate-tropical japonica split 4,100 years ago, also suggest that tropical japonica subpopulations found today in mainland SE Asia, Java/Sulawesi/Sumatra, and the northern Philippines may have begun diverging as early as ∼3,500 years ago (fig. 8). This date is earlier than our previous analyses (Gutaker et al. 2020), but nevertheless puts the initial diversification of tropical japonica in mainland SE Asia in the timeframe of the establishment of rice in the region. Archaeological evidence for Neolithic dispersal from China into northern Vietnam is dated from ∼4,000 BP (Castillo 2017; Higham 2021), around the time of the 4.2k climate event, whereas the appearance of domesticated rice at Khok Phanom Di in central Thailand occurred after ∼4,000 BP (fig. 8). Subsequent dispersal outwards into island SE Asia, such as from the Malay peninsula through Indonesia, can be suggested to have taken place after this, establishing some dispersed areas of rice cultivation over the next millennium.
Fig. 8.

Schematic model of the movement of japonica rice into Taiwan and SE Asia. The blue lines broadly indicate main lines of japonica dispersal across NE and SE Asia. The solid green line represents dispersal of temperate japonica into Taiwan, whereas dashed green lines indicate gene flow into Taiwan japonica rice subpopulations from mainland SE Asia and the northern Philippines. The question mark on the date for japonica rice diversification in SE Asia indicates uncertainty in the timing given different estimates based on this study and our earlier work (Gutaker et al. 2020).
Unambiguous evidence for rice cultivation is lacking but two sites with phytolith data in Sulawesi suggest possible cultivation by as early as 3,400–3,200 BP (Anggraeni et al. 2014; Deng, Hung, et al. 2020). In the northern Philippines, there are rice-tempered ceramics dated to ∼3,500 BP, and rice grains dated to ∼3,000 BP ( Snow et al. 1986; Silva et al. 2015; Carson and Hung 2018; Deng et al. 2018; fig. 9). Nevertheless, for most of island SE Asia rice finds only become common place after ∼2,000 BP (Silva et al. 2015; Barron et al. 2020), although archaeobotanical studies in this area remain sparse. Our genetic data could suggest that rice initially diversified in SE Asia ∼3,500 BP but was cultivated at small scale, and only expanded across the region a millenium later. This would indicate that rice agriculture in island SE Asia, especially in the crucial crossroads that is the Philippine archipelago, most likely occurred by cultural diffusion from the south, rather than by demic diffusion of human populations. Analysis of more populations in the region, as well as expanding archaeobotanical studies in island SE Asia, may help provide greater resolution to dates of dispersal in both mainland SE Asia and the archipelagic islands of insular SE Asia.
Fig. 9.

Archaeological evidence for presence of rice and goods associated with maritime trading across SE Asia, Taiwan, and China. (A) Rice finds from 6,000–3,000 BP. (B) Rice finds from 1,999–1,400 BP, and Dong Son drums from Northern Vietnam (2,500–1,900 BP) and Fengtian jade (2,500–1,950 BP).
Our work also provides insights into the status of the Taiwan landraces cultivated in the mountain regions of the island by indigenous peoples. Instead of being a major source population for contemporary japonica landraces in SE Asia, this island has apparently acted as a contact zone between the north and south. Our analysis suggests that temperate japonica rice was introduced to Taiwan after ∼2,600 years ago during the Late Bronze Age, possibly from northern China or the Korean Peninsula (fig. 8); this is distinct from early (likely tropical japonica) rice that have been found alongside millets in archaeological sites over 4,000 years ago. The introduction of temperate japonica in Taiwan after ∼2,600 years ago is consistent with results from paleoclimate niche reconstruction (fig. 6), which shows that the climate in Taiwan had become more favorable for temperate japonica as opposed to tropical japonica by ∼3,600 years ago. Moreover, a recent ancient DNA analysis indicated that Taiwanese peoples from ∼1300 BCE to 800 CE carried ∼25% of a northern East Asian lineage in their genomes (Wang et al. 2021). Analysis of contemporary Taiwanese indigenous populations also show a genomic component from NE Asia (Larena et al. 2021). Together, these support contact of Taiwanese indigenous peoples with immigrants from northern latitudes that may also be associated with the movement of NE Asian temperate japonica.
The movement of temperate japonica appears to have been followed by the introduction of tropical japonica rice lineages from both the northern Philippines and mainland SE Asia, with subsequent admixture between the tropical and temperate rice in Taiwan (fig. 8). One group of Taiwanese indigenous landraces share ancestry with a Laotian population; because the Laos population is itself admixed, we are unable to establish the timing of gene flow between this population and Taiwan temperate japonica, although this must have occurred after the arrival of temperate rice in Taiwan ∼2,600 years ago. We are, however, able to conduct demographic modeling to date the movement from the Philippines to Taiwan, and our analysis suggests that it had begun at around or before ∼1,300 years ago.
Cultural contact between Taiwan and the northern Philippines, as evidenced by the export of Fengtian nephrite from Taiwan to the Philippines, likely existed since Austronesian-speaking groups migrated to Luzon ∼4,000 years ago (Hung et al. 2007). The scale of trade networks around the South China sea, however, is much broader, and the Austronesian trading sphere encompassed mainland SE Asia, Indonesia, the Philippines, Taiwan and southern China, as well as India to the west. There was a dramatic increase in activity in this area from ∼2,500 to ∼1,800 BP (Hung et al. 2007, 2013; Calo 2014, 2020; Bellina 2017; fig. 9), overlapping with the period between the introduction of temperate japonica to Taiwan and tropical japonica from the Northern Philippines. Between 500 and 100 BCE, bronze drums manufactured in northern Vietnam are found as far away as the Malay Peninsula and Bali (Calo 2014). After 500 BCE, itinerant jade workers from Taiwan likely made and traded Fengtian jade along this network, largely between widely dispersed Austronesian peoples (Hung et al. 2007); indeed, Taiwanese jade in this period is found in multiple archaeological sites in Vietnam and the Philippine archipelago (fig. 9). It is also plausible that iron was being exported from the Philippines to Taiwan around the same time (Tsang 2000). Once established this trading network kept mainland and island SE Asia and Taiwan in reciprocal contact. We suggest that it is in the context of these extensive trading activities with the south, and possible human migration from the north, that temperate japonica from NE Asia and tropical japonica from mainland SE Asia and the Philippine archipelago made their way to Taiwan.
Our study has been able to examine the relationships between traditional landraces grown by the indigenous peoples of Taiwan and the northern Philippines, and link these to our reconstruction of the dispersal of japonica rice across Asia. Although we do not find evidence for movement of rice from Taiwan to island SE Asia based on our genome analysis, we remain cautious, as our Taiwanese landraces come from the mountain regions and we have no traditional varieties from the coastal areas of the island. Unfortunately, no more lowland Taiwan landraces are known to exist, as they have all been replaced by more modern elite varieties. Nevertheless, our analysis points to movement of tropical japonica from mainland SE Asia as the source of present-day rice across island SE Asia. Interestingly, we also find evidence for selection associated with the establishment of the Taiwan indigenous rice subpopulations and have identified genomic regions that may harbor loci that allow for adaptation to new environments as rice populations dispersed. As we reconstruct the history of the spread of rice after it was domesticated in the Yangtze Valley, we continue to study the role that climatic changes and human migrations and cultural contacts play in the dispersal of this important global food species, and to examine the nature of adaptation that has led to the diversification of this vital crop.
Materials and Methods
Sequencing Data
We conducted whole-genome resequencing on 24 Taiwanese and 13 Philippine landraces (see supplementary table S1, Supplementary Material online). Seed for the Taiwanese landraces was obtained from the Plant Germplasm Center of the Taiwan Agricultural Research Institute; these landraces were from the indigenous peoples of the mountain regions of Taiwan, with 22 of the samples collected around 1900 and 2 collected in 2010. The Philippine landraces were all from the rice terrace systems of the Cordillera region of northern Luzon, and seed was obtained from the germplasm collection of the International Rice Research Institute.
Genomic DNA from rice plants was extracted from healthy leaves from a single-seed–descent plant using either the DNeasy Plant Mini Kit (Qiagen) following the manufacturer’s protocol (Qiagen) [for the Taiwanese samples] or phenol-chloroform-isoamyl alcohol extraction followed by isopropanol precipitation (for the Philippine samples). Extracted DNA from each sample was prepared for Illumina genome sequencing using either the Illumina TruSeq or Nextera DNA Library Preparation Kit. Sequencing was done on the Illumina HiSeq 2000 (for the Taiwanese samples) or 2500 (for the Philippine samples) with 2 × 100 bp read configuration. Sequencing data for these accessions are available from the NCBI Short Read Archive (SRA) under Bioproject accession numbers PRJNA485658 and PRJNA717716.
These new sequence data from Taiwan and the Philippines was combined with data from the 330 O. sativa ssp. japonica accessions from Gutaker et al. (2020). This data was downloaded in fastq format from the SRA using the FASTQ-DUMP tool v.2.8.2 with the option to split reads into forward and reverse reads, and sequences trimmed. All postsequencing steps are outlined in supplementary fig. S7, Supplementary Material online.
Alignment and Genotyping
Alignment of the sequencing reads and subsequent SNP calling was performed as described previously (Gutaker et al. 2020). Briefly, we used a Nextflow v.0.25.1.4460 pipeline (https://github.com/grafau/NextGatkSNPs, last accessed July 14, 2021) to produce the final set of SNPs via the following steps outlined below.
Sequencing reads in fastq format were first aligned to the Shuhui498 v.1.0 indica reference genome using BWA v.0.7.15 (Li and Durbin 2009) in “mem” mode (Li 2013). Sequences were sorted, those from the same sample but from different runs were merged, and amplification duplicates were removed using PICARD v.2.15.0 (http://broadinstitute.github.io/picard/, last accessed July 14, 2021). The resulting sam files were converted to bam files, validated, and indexed. The bam files were used to call haplotypes in gvcf format files via the HAPLOTYPECALLER function of GATK v3.8 (McKenna et al. 2010; Poplin et al. 2018), and the gvcf files were used to produce the raw set of SNPs segregating across the samples via the GENOTYPEGVCFS function of GATK.
SNP Filtering
The raw set of SNPs was subject to a series of filtering steps, as described previously (Gutaker et al. 2020). First, we kept only biallelic SNPs. Subsequently, we applied five filtering criteria: qualities normalized by depth (QD), mapping quality (MQ and MQRankSum), read position bias from Wilcoxon’s test (ReadPosRankSum), and strand bias from Fisher’s test (FS). Filtering thresholds for these criteria were trained dynamically using the VARIANTRECALIBRATOR function of GATK, referencing a true-positive set of SNPs that were discovered independently in the 3K-RG project (Wang et al. 2018), and in the rice diversity panel that was genotyped with a high-density SNP array. We applied the dynamic filter to the raw SNP set using the APPLYRECALIBRATION function of GATK, conservatively set to recover 90% of true positives. We also filtered out SNPs with excess observed heterozygosity as described previously (Gutaker et al. 2020), using a custom perl script. We interpret excessively heterozygous sites as mismapped reads in chromosomal regions with structural variants that are present in the resequencing data but not in the reference genome.
Next, we transformed vcf files into bed format files and filtered out any SNP that had a genotyping rate lower than 80%, using PLINK v.1.90 (Purcell et al. 2007). For some analyses, SNP sets were subject to additional two-step linkage-disequilibrium pruning. The first step was carried out with the INDEP-PAIRWISE function in windows of 10 kb, with variant shift = 1 and r2 = 0.8. The second step was carried out with the same function in windows of 50 variants.
Clustering and Discretization
Clustering and discretization were performed as described previously (Gutaker et al. 2020). Clustering was visualized using the multidimensional-scaling function of PLINK v.1.90 (Purcell et al. 2007) as described previously (Gutaker et al. 2020). Formal clustering of landraces was carried out on the basis of pairwise genetic matrices with the PAM method, implemented as the PAM function in the CLUSTER package for R v.4.0.2 (https://CRAN.R-project.org/package=cluster, last accessed July 14, 2021) followed by filtering with the DISCRETIZE algorithm implemented in R (https://github.com/grafau/discretize, last accessed July 14, 2021).
Clustering and discretization were carried out independently for a number of clusters, Kd, that varied from 2 to 12. Discrete clusters are considered subpopulations and their members are considered landraces conditional on a colocalized geographic distribution within each discrete cluster.
Admixture Graph Construction
Population admixture graphs for the Kd = 11 subpopulations with 19 accessions of Oryza barthii as the outgroup population were inferred using TreeMix (Pickrell and Pritchard 2012) and QPGRAPH (Patterson et al. 2012). TreeMix was run with m = 1 through 8, and k = 1, 200, 400, 600, 800, 1,000, 2,000, and 5,000. Results computed from different values of k were used as replicates to fit linear models to identify the optimal number of migration episodes using the OptM package on R.
We reconstructed admixture graphs using QPGRAPH as described previously (Gutaker et al. 2020). The CONVERTF function from ADMIXTOOLS (Patterson et al. 2012) was used to produce eigenstrat data files. Models were built using the ADMIXTUREGRAPH package (https://cran.r-project.org/web/packages/admixturegraph/index.html, last accessed March 1, 2021) in R v.4.0.2, and evaluated using the QPGRAPH function of ADMIXTOOLS.
We first explored all possible models with six subpopulations and two migrations, keeping only those with maximum absolute f4-statistic z-scores (|z-score|) < 3.0. For each model we kept, we attached an additional subpopulation in all possible nodes using ADMIXTUREGRAPH and tested the resulting models in ADMIXTOOLS, again keeping only models with maximum |z-score| < 3.0. We progressively added subpopulations until no more were present or until no models with maximum |z-score| < 3.0 were found. In the latter case, we kept all models with maximum |z-score| lower than 10.0. We then added an additional admixture event in all possible nodes using ADMIXTUREGRAPH and tested resultant models in ADMIXTOOLS, keeping only models with maximum |z-score| < 3.0. Beyond k = 9, we selected models with maximum |z-scores|< 3.5 after adding migration edges, as there were no models with maximum |z-score| < 3.0.
Migration events involving the Taiwanese subpopulations were validated using outgroup f3 and f4 statistics using the QP3POP and QPDSTAT functions, respectively, of the ADMIXTOOLS 2.0 package (https://github.com/uqrmaie1/admixtools/, last accessed July 14, 2021) in R v.4.0.2.
Admixture Proportion Modeling
We performed admixture proportion modeling on the Taiwanese subpopulations using the QPADM_ROTATE function of the ADMIXTOOLS 2.0 package in R v.4.0.2. In this method, feasibility of admixture (i.e., all admixture weights fall between 0 and 1) and a departure from a null model with no admixture are computed for a putatively admixed target population from designated source populations, with the remaining populations accounted for as reference populations. Each of the Taiwanese subpopulations was considered a target population, whereas all possible combinations of the remaining Kd = 11 subpopulations were considered as source and reference populations, respectively. The outgroup Oryza barthii was always considered a reference population. Feasible models with P > 0.05 were selected based on a nested model (Harney et al. 2021).
Demographic Modeling
Demographic modeling was performed using the method Diffusion Approximation for Demographic Inference (δaδi) (Gutenkunst et al. 2009). To derive the site frequency spectra (SFS), genic SNPs were filtered out with bedtools v2.28.0 and biallelic SNPs containing no missing data for the Taiwan 1 (n = 7), Northern Philippines (n = 21), NE Asian lowland temperate (n ≤ 49), Mainland SE Asia/Bhutan (n = 6), and Java/Sumatra/Sulawesi (n ≤ 32), subpopulations were extracted with PLINK v.1.90. The VCF2DADI function in R (https://github.com/cjbattey/vcf2dadi, last accessed July 14, 2021) was used to convert the vcf file into the format that δaδi can recognize and convert into an SFS. SNPs were polarized based on fixed alleles in our Oryza barthii set.
Demographic parameters were estimated using the Nelder-Mead algorithm via the dadi_pipeline v3.1.5 (Portik et al. 2017 ). A single optimization routine consisted of 100 replicates over four rounds, and each model was optimized over five independent routines. Optimization was run on GPUs using the dadi. CUDA extension (Gutenkunst 2021). To restrict the parameter space, we sought to run models with a fixed divergence time TA, between tropical and temperate japonica, which has been previously estimated using SMC++ (Terhorst et al. 2017). To do this in δaδi, it was also necessary to fix the ancestral effective population size, NA. The values for these fixed parameters were chosen to represent the modes and extremes of estimated ranges (Gutaker et al. 2020). Ancestral population size and divergence time were fixed via fixing theta as described previously (Bourgeois et al. 2019), using a mutation rate (µ) of 6.5 × 10⁻⁹ (Gaut et al. 1996 ). Only SNPs that occurred in nongenic regions, and that had fixed variants in the outgroup were considered in the analyses. The value for the fixed theta was computed using the formula: =4NAµ(Sf/ST)(LR − LG), where Sf are the number of SNPs that have fixed variants in the outgroup, ST is the total number of nonmissing SNPs in the nongenic regions, LR is the reference genome length and LG is the length of genic regions. In all models, inbreeding was included as an explicit parameter for all subpopulations (Blischak et al. 2020). A parameter for estimating the ancestral allele misidentification rate was also included to account for errors in polarization of the site frequency spectra. Illustrations of all tested models are in supplementary figure S6, Supplementary Material online.
In our first set of models, which included the topologies (Northern Philippines, [Taiwan 1, NE Asian lowland temperate]) and (NE Asian lowland temperate [Taiwan 1, northern Philippines]) with and without symmetrical, bidirectional gene flow with Taiwan 1 and the other subpopulations, we assessed the performance of combinations of TA = 3,100, 4,100, and 5,000 and NA = 5,000, 20,000, and 50,000. As models with TA = 4,100 and NA = 20,000 consistently performed best (supplementary fig. S8 and table S5, Supplementary Material online), we only considered these values in all subsequent models. In our second set of models, we set gene flow to be asymmetrical or unidirectional between Taiwan and the Philippines to compare with our best model from the first round—(Northern Philippines [Taiwan 1, NE Asian lowland temperate]) with symmetrical gene flow. In our final set of models in this iterative series, we fixed all the parameters of the best model from the previous round—(Northern Philippines [Taiwan 1, NE Asian lowland temperate]) with asymmetrical gene flow between Taiwan and the Philippines—and explored a pulsed migration model to estimate the relative timing of migration events.
We then ran models with topologies (NE Asian lowland temperate [mainland SE Asia/Bhutan, Java/Sumatra/Sulawesi]) and (NE Asian lowland temperate [Northern Philippines, Java/Sumatra/Sulawesi]) with no migration and with TA = 4,100 and NA = 20,000 to estimate split times between the SE subpopulations.
Parameters estimated by δaδi were converted to real units using a mutation rate of µ = 6.5 × 10⁻⁹, a generation time of 1 year, and a sequence length of 272,413,732 bp (rice chromosomes minus genic regions). Confidence intervals were estimated using the Godambe Information Matrix with 100 bootstrapped frequency spectra that were constructed by randomly sampling 1 Mb blocks with replacement until the total sequence length was as close as possible to the size of the full genome. For each model, a step size for numerical differentiation of 10-X was selected, when estimates of confidence intervals remained stable from 10−X to 10−X+1. The bootstrapped frequency spectra were also used to conduct an adjusted likelihood ratio test between nested models.
Selection Analysis
We used the GRoSS method (Refoyo-Martínez et al. 2019) to scan the genome for positive selection along each branch of our best-supported nine-population admixture graph (fig. 3A). The method yields an SB statistic with an associated P value for each SNP on each branch of the population graph. We computed P values for overlapping 10-SNP windows along the genome, and used P < 10−4 and 10−5 as thresholds to identify loci that have putatively undergone selective sweeps on any of the branches of the admixture graph. We mapped the identified loci to annotated genes along the Shuhui498 reference genome (Du et al. 2017), based on any overlap between the selected SNPs and gene coordinates. Finally, we examined whether genes associated with loci under selection contained known QTNs, using a recently reported rice database (Wei et al. 2021).
Supplementary Material
Supplementary data are available at Molecular Biology and Evolution online.
Supplementary Material
Acknowledgments
We would like to acknowledge our gratitude to the indigenous peoples of Taiwan and the Cordillera region of the Philippines, as well as all the traditional farmers of Asia, for their stewardship of traditional rice landraces. This work was supported by the Zegar Family Foundation to M.D.P. and J.d’A.G., the Taiwan Ministry of Science and Technology to Y.I.H., and the National Science Foundation Plant Genome Research Program and NYU Sulo: Philippine Studies Initiative to M.D.P.
Data Availability
The data underlying this article are available in NCBI Short Read Archive (SRA) database under the project accession numbers PRJNA485658 and PRJNA717716.
References
- Anggraeni ST, Bellwood P, Piper P.. 2014. Neolithic foundations in the Karama valley, West Sulawesi, Indonesia. Antiquity 88:740–756. [Google Scholar]
- Barron A, Datan I, Bellwood P, Wood R, Fuller DQ, Denham T.. 2020. Sherds as archaeobotanical assemblages: Gua Sireh reconsidered. Antiquity 94(377):1325–1336. [Google Scholar]
- Bedford S. 2006. Pieces of the Vanuatu puzzle: archaeology of the north, south and centre. Terra Australis 23. Canberra (ACT; ): Australian National University. [Google Scholar]
- Bellina B. 2017. Khao Sam Kaeo. An early port-city between the Indian Ocean and the South China Sea. Paris: École Française d'Extrême-Orient. [Google Scholar]
- Bellwood P. 1997. Prehistory of the Indo-Malaysian Archipelago. Honolulu (HI: ): University of Hawaii Press. [Google Scholar]
- Bellwood P. 2004. The origins and dispersals of agricultural communities in Southeast Asia. In: Bellwood P, Glover I, editors. Southeast Asia: from prehistory to history. London: Routledge Curzon. p. 21–40. [Google Scholar]
- Bellwood P. 2005. First farmers: the origins of agricultural societies. Oxford: Blackwell. [Google Scholar]
- Bellwood P. 2011. The checkered prehistory of rice movement southwards as a domesticated cereal—from the Yangzi to the equator. Rice 4(3–4):93–103. [Google Scholar]
- Blischak PD, Barker MS, Gutenkunst RN.. 2020. Inferring the demographic history of inbred species from genome-wide snp frequency data. Mol Biol Evol. 37(7):2124–2136. [DOI] [PMC free article] [PubMed] [Google Scholar]
- Blust R. 1995. The prehistory of the Austronesian-speaking peoples: a view from language. J World Prehist. 9(4):453–510. [Google Scholar]
- Bourgeois Y, Ruggiero RP, Manthey JD, Boissinot S.. 2019. Recent secondary contacts, linked selection, and variable recombination rates shape genomic diversity in the model species Anolis carolinensis. Genome Biol Evol. 11(7):2009–2022. [DOI] [PMC free article] [PubMed] [Google Scholar]
- Calo A. 2014. Ancient trade between India and Indonesia. Science 345(6202):1255. [DOI] [PubMed] [Google Scholar]
- Calo A, Bellwood P, Lankton J, Reinecke A, Bawono RA, Prasetyo B.. 2020. Trans-Asiatic exchange of glass, gold and bronze: analysis of finds from the late prehistoric Pangkung Paruk site, Bali. Antiquity 94(373):110–126. [Google Scholar]
- Carson MT, Hung HC.. 2018. Learning from paleo-landscapes: defining the land-use systems of the ancient Malayo-Polynesian homeland. Curr Anthro. 59(6):790–813. [Google Scholar]
- Castillo C. 2017. Development of cereal agriculture in prehistoric mainland Southeast Asia. Man India. 95:335–352. [Google Scholar]
- Castillo CC, Higham CFW, Miller K, Chang N, Douka K, Higham TFG, Fuller DQ.. 2018. Social responses to climate change in Iron Age north-east Thailand: new archaeobotanical evidence. Antiquity 92(365):1274–1291. [Google Scholar]
- Choi JY, Platts AE, Fuller DQ, Hsing Y-I, Wing RA, Purugganan MD.. 2017. The rice paradox: multiple origins but single domestication in Asian rice. Mol Biol Evol. 34(4):969–979. [DOI] [PMC free article] [PubMed] [Google Scholar]
- Cochrane E, Rieth T, Filimoehala D.. 2021. The first quantitative assessment of radiocarbon chronologies for initial pottery in Island Southeast Asia supports multi-directional Neolithic dispersal. PLoS One. 16(6):e0251407. [DOI] [PMC free article] [PubMed] [Google Scholar]
- Dal Martello R, Li X, Fuller DQ.. 2021. Two season agriculture and irrigated rice during the Dian: radiocarbon dates and archaeobotanical remains from Dayingzhuang, Yunnan, Southwest China. Arch Anthro Sci. 13:62. [DOI] [PMC free article] [PubMed] [Google Scholar]
- Deng Z, Hung HC, Carson MT, Bellwood P, Yang SL, Lu H.. 2018. The first discovery of Neolithic rice remains in eastern Taiwan: phytolith evidence from the Chaolaiqiao site. Archaeol Anthropol Sci. 10(6):1477–1484. [Google Scholar]
- Deng Z, Hung H, Carson MT, Oktaviana AA, Hakim B, Simanjuntak T.. 2020. Validating earliest rice farming in the Indonesian Archipelago. Sci Rep. 10(1):10984. [DOI] [PMC free article] [PubMed] [Google Scholar]
- Deng Z, Yan Z, Yu Z.. 2020. Bridging the gap on the southward dispersal route of agriculture in China: new evidences from the Guodishan site, Jiangxi province. Arch Anthro Sci. 12:1–10. [Google Scholar]
- Diamond J. 2001. Polynesian origins: slow boat to Melanesia? Nature 410(6825):167. [DOI] [PubMed] [Google Scholar]
- Diamond J, Bellwood P.. 2003. Farmers and their languages: the first expansions. Science 300(5619):597–603. [DOI] [PubMed] [Google Scholar]
- Donohue M, Denham T.. 2010. Farming and language in island Southeast Asia: reframing Austronesian history. Curr Anthropol. 51(2):223–256. [Google Scholar]
- Du H, Yu Y, Ma Y, Gao Q, Cao Y, Chen Z, Ma B, Qi M, Li Y, Zhao X, et al. 2017. Sequencing and de novo assembly of a near complete indica rice genome. Nat Commun. 8:15324.:doi:10.1038/ncomms15324 [DOI] [PMC free article] [PubMed] [Google Scholar]
- Fuller DQ. 2020. Transitions in productivity: rice intensification from domestication to urbanisation. Archaeol Int. 23:88–103. [Google Scholar]
- Fuller DQ. 2011. Pathways to Asian civilizations: tracing the origins and spread of rice and rice cultures. Rice 4(3–4):78–92. [Google Scholar]
- Gao Y, Dong G, Yang X, Chen F.. 2020. A review on the spread of prehistoric agriculture from southern China to mainland Southeast Asia. Sci China Earth Sci. 63(5):615–625. [Google Scholar]
- Gaut BS, , MortonBR, , McCaigBC, , Clegg MT.. 1996. Substitution rate comparisons between grasses and palms: synonymous rate differences at the nuclear gene Adh parallel rate differences at the plastid gene rbcL. Proc Natl Acad Sci U S A. 93(19):10274–10279. [DOI] [PMC free article] [PubMed] [Google Scholar]
- Gray RD, Jordan FM.. 2000. Language trees support the express-train sequence of Austronesian expansion. Nature 405(6790):1052–1055. [DOI] [PubMed] [Google Scholar]
- Gutaker RM, Groen SC, Bellis ES, Choi JY, Pires IS, Bocinsky RK, Slayton ER, Wilkins O, Castillo CC, Negrão S, et al. 2020. Genomic history and ecology of the geographic spread of rice. Nat Plants. 6(5):492–502. [DOI] [PubMed] [Google Scholar]
- Gutenkunst RN. 2021. dadi.CUDA: Accelerating population genetics inference with graphics processing units. Mol Biol Evol. 38(5):2177–2178. [DOI] [PMC free article] [PubMed] [Google Scholar]
- Gutenkunst RN, Hernandez RD, Williamson SH, Bustamante CD.. 2009. Inferring the joint demographic history of multiple populations from multidimensional SNP frequency data. PLoS Genet. 5(10):e1000695. [DOI] [PMC free article] [PubMed] [Google Scholar]
- Guedes JA, Hanson S, Lertcharnrit T, Weiss A, Pigott V, Higham C, Higham T, Weber S.. 2020. Three thousand years of farming strategies in Central Thailand. Antiquity 94(376):966–982. [Google Scholar]
- Haak W, Lazaridis I, Patterson N, Rohland N, Mallick S, Llamas B, Brandt G, Nordenfelt S, Harney E, Stewardson K, et al. 2015. Massive migration from the steppe was a source for Indo-European languages in Europe. Nature 522(7555):207–211. [DOI] [PMC free article] [PubMed] [Google Scholar]
- Hamilton M. 2014. When rice shakes the world. In: The importance of the first grain to world economic and political stability. Charleston (SC: ): Advantage Media. [Google Scholar]
- Harney E, Patterson N, Reich D, Wakeley J.. 2021. Assessing the performance of qpAdm: a statistical tool for studying population admixture. Genetics 217(4):iyaa045. [DOI] [PMC free article] [PubMed] [Google Scholar]
- Higham CFW. 2021. The later prehistory of Southeast Asia and southern China: the impact of exchange, farming and metallurgy. Asian Archaeol. 4(2):63–93. [Google Scholar]
- Hu D, Clift P, Böning P, Hannigan R, Hillier S, Blusztajn J, Wan S, Fuller DQ.. 2013. Holocene evolution in weathering and erosion patterns in the Pearl river delta. Geochem Geophys Geosyst. 14(7):2349–2368. [Google Scholar]
- Hung H, Nguyen KD, Bellwood P, Carson MT.. 2013. Coastal connectivity: long-term trading networks across the South China Sea. J Isl Coast Archaeol. 8(3):384–404. [Google Scholar]
- Hung H-C, Iizuka Y, Bellwood P, Nguyen KD, Bellina B, Silapanth P, Dizon E, Santiago R, Datan I, Manton JH.. 2007. Ancient jades map 3,000 years of prehistoric exchange in Southeast Asia. Proc Natl Acad Sci U S A. 104(50):19745–19750. [DOI] [PMC free article] [PubMed] [Google Scholar]
- Ishikawa R, Castillo C, Fuller DQ.. 2020. Genetic evaluation of domestication-related traits in rice: implications for the archaeobotany of rice origins. Arch Anthro Sci. 12:1–14. [Google Scholar]
- Iso E. 1954. Rice and crops in its rotation in subtropical zone. Tokyo (Japan: ): Japan FAO Association. [Google Scholar]
- Larena M, Sanchez-Quinto F, Sjödin P, McKenna J, Ebeo C, Reyes R, Casel O, Huang J-Y, Hagada KP, Guilay D, et al. 2021. Multiple migrations to the Philippines during the last 50,000 years. Proc Natl Acad Sci U S A. 118(13):e2026132118. [DOI] [PMC free article] [PubMed] [Google Scholar]
- Li H. 2013. Aligning sequence reads, clone sequences and assembly contigs with BWA-MEM. ArXiv: 1303.3997.
- Li H, Durbin R.. 2009. Fast and accurate short read alignment with Burrows-Wheeler transform. Bioinformatics 25(14):1754–1760. [DOI] [PMC free article] [PubMed] [Google Scholar]
- Lipson M, Cheronet O, Mallick S, Rohland N, Oxenham M, Pietrusewsky M, Pryce TO, Willis A, Matsumura H, Buckley H, et al. 2018. Ancient genomes document multiple waves of migration in Southeast Asian prehistory. Science 361(6397):92–95. [DOI] [PMC free article] [PubMed] [Google Scholar]
- Lipson M, Loh P-R, Patterson N, Moorjani P, Ko Y-C, Stoneking M, Berger B, Reich D.. 2014. Reconstructing Austronesian population history in island Southeast Asia. Nat Commun. 5:4689. [DOI] [PMC free article] [PubMed] [Google Scholar]
- Ma T, Rolett BV, Zheng Z, Zong Y.. 2020. Holocene coastal evolution preceded the expansion of paddy field rice farming. Proc Natl Acad Sci U S A. 117(39):24138–24143. [DOI] [PMC free article] [PubMed] [Google Scholar]
- McColl H, Racimo F, Vinner L, Demeter F, Gakuhari T, Moreno-Mayar JV, van Driem G, Wilken G, Seguin-Orlando A, de la Fuente C, et al. 2018. The prehistoric peopling of Southeast Asia. Science 361(6397):88–92. [DOI] [PubMed] [Google Scholar]
- McKenna A, Hanna M, Banks E, Sivachenko A, Cibulskis K, Kernytsky A, Garimella K, Altshuler D, Gabriel S, Daly M, et al. 2010. The Genome Analysis Toolkit: a MapReduce framework for analyzing next-generation DNA sequencing data. Genome Res. 20(9):1297–1303. [DOI] [PMC free article] [PubMed] [Google Scholar]
- Mörseburg A, Pagani L, Ricaut F-X, Yngvadottir B, Harney E, Castillo C, Hoogervorst T, Antao T, Kusuma P, Brucato N, et al. 2016. Multi-layered population structure in Island Southeast Asians. Eur J Hum Genet. 24(11):1605–1611. [DOI] [PMC free article] [PubMed] [Google Scholar]
- Park HL, Yoo Y, Hahn T-R, Bhoo SH, Lee S-W, Cho M-H.. 2014. Antimicrobial activity of UV-induced phenylamides from rice leaves. Molecules 19(11):18139–18151. [DOI] [PMC free article] [PubMed] [Google Scholar]
- Patterson N, Moorjani P, Luo Y, Mallick S, Rohland N, Zhan Y, Genschoreck T, Webster T, Reich D.. 2012. Ancient admixture in human history. Genetics 192(3):1065–1093. [DOI] [PMC free article] [PubMed] [Google Scholar]
- Pawley A. 2003. The Austronesian dispersal: languages, technologies and people. In: Bellwood P, Renfrew C, editors. Examining the farming/language dispersal hypothesis. Cambridge: McDonald Institute for Archaeological Reserarch. p. 233–273 [Google Scholar]
- Peng M, Shahzad R, Gul A, Subthain H, Shen S, Lei L, Zheng Z, Zhou J, Lu D, Wang S, et al. 2017. Differentially evolved glucosyltransferases determine natural variation of rice flavone accumulation and UV-tolerance. Nat Commun. 8(1):1975. [DOI] [PMC free article] [PubMed] [Google Scholar]
- Pickrell JK, Pritchard JK.. 2012. Inference of population splits and mixtures from genome-wide allele frequency data. PLoS Genet. 8(11):e1002967. [DOI] [PMC free article] [PubMed] [Google Scholar]
- Poplin R, Ruano-Rubio V, DePristo MA, Fennell TJ, Carneiro MO, Auwera G. D, Kling DE, Gauthier LD, Levy-Moonshine A, Roazen D, et al. 2018. Scaling accurate genetic variant discovery to tens of thousands of samples. bioRxiv: 201178. doi:10.1101/201178.
- Portik DM, , LeachéAD, , RiveraD, , BarejMF, , BurgerM, , HirschfeldM, , RödelM-O, , BlackburnDC, , Fujita MK.. 2017. Evaluating mechanisms of diversification in a Guineo-Congolian tropical forest frog using demographic model selection. Mol Ecol. 26(19):5245–5263. [DOI] [PubMed] [Google Scholar]
- Purcell S, Neale B, Todd-Brown K, Thomas L, Ferreira MAR, Bender D, Maller J, Sklar P, de Bakker PIW, Daly MJ, et al. 2007. PLINK: A tool set for whole-genome association and population-based linkage analyses. Am J Hum Genet. 81(3):559–575. [DOI] [PMC free article] [PubMed] [Google Scholar]
- Purugganan MD, Fuller DQ.. 2011. Archaeological data reveal slow rates of evolution during plant domestication. Evolution 65(1):171–183. [DOI] [PubMed] [Google Scholar]
- Qin L, Fuller DQ.. 2019. Why rice farmers don’t sail: coastal subsistence traditions and maritime trends in early China. In: Wu C, Rolett BV, editors. Prehistoric maritime cultures and seafaring in East Asia. Singapore: Springer Singapore. p. 159–191. [Google Scholar]
- Raghavan M, Skoglund P, Graf KE, Metspalu M, Albrechtsen A, Moltke I, Rasmussen S, Stafford TW Jr, Orlando L, Metspalu E, et al. 2014. Upper Palaeolithic Siberian genome reveals dual ancestry of Native Americans. Nature 505(7481):87–91. [DOI] [PMC free article] [PubMed] [Google Scholar]
- Refoyo-Martínez A, da Fonseca RR, Halldórsdóttir K, Árnason E, Mailund T, Racimo F.. 2019. Identifying loci under positive selection in complex population histories. Genome Res. 29(9):1506–1520. [DOI] [PMC free article] [PubMed] [Google Scholar]
- Sagart L, Hsu T-F, Tsai Y-C, Wu C-C, Huang L-T, Chen Y-C, Chen Y-F, Tseng Y-C, Lin H-Y, Y Hsing Y-I.. 2018. A northern Chinese origin of Austronesian agriculture: new evidence on traditional Formosan cereals. Rice 11(1):57. [DOI] [PMC free article] [PubMed] [Google Scholar]
- Silva F, Stevens CJ, Weisskopf A, Castillo C, Qin L, Bevan A, Fuller DQ.. 2015. Modelling the geographical origin of rice cultivation in Asia using the rice archaeological database. PLoS One. 10(9):e0137024. [DOI] [PMC free article] [PubMed] [Google Scholar]
- Snow BE, Shutler R, Nelson DE, Vogel JS, Southon JR.. 1986. Evidence of early rice cultivation in the Philippines. Philippine Q Cult Soc. 14:3–11. [Google Scholar]
- Spriggs M. 2003. Chronology of the Neolithic transition in Island Southeast Asia and the western Pacific: a view from 2003. Rev Arch. 24:57–80. [Google Scholar]
- Terhorst J, Kamm JA, Song YS.. 2017. Robust and scalable inference of population history from hundreds of unphased whole-genomes. Nat Genet. 49(2):303–309. [DOI] [PMC free article] [PubMed] [Google Scholar]
- Tsang C-H. 2000. Recent advances in the Iron Age archaeology of Taiwan. Bull Indo-Pac Prehistory Assoc. 20: 153–158. [Google Scholar]
- Wang C-C, Yeh H-Y, Popov AN, Zhang H-Q, Matsumura H, Sirak K, Cheronet O, Kovalev A, Rohland N, Kim AM, et al. 2021. Genomic insights into the formation of human populations in East Asia. Nature 591:413–419. [DOI] [PMC free article] [PubMed] [Google Scholar]
- Wang M, Li W, Fang C, Xu F, Liu Y, Wang Z, Yang R, Zhang M, Liu S, Lu S, et al. 2018. Parallel selection on a dormancy gene during domestication of crops from multiple families. Nat Genet. 50(10):1435–1441. [DOI] [PubMed] [Google Scholar]
- Wang W, Mauleon R, Hu Z, Chebotarov D, Tai S, Wu Z, Li M, Zheng T, Fuentes RR, Zhang F, et al. 2018. Genomic variation in 3,010 diverse accessions of Asian cultivated rice. Nature 557(7703):43–49. [DOI] [PMC free article] [PubMed] [Google Scholar]
- Wei X, Qiu J, Yong K, Fan J, Zhang Q, Hua H, Liu J, Wang Q, Olsen KM, Han B, et al. 2021. A quantitative genomics map of rice provides genetic insights and guides breeding. Nat Genet. 53(2):243–253. [DOI] [PubMed] [Google Scholar]
- Yang MA, Fan X, Sun B, Chen C, Lang J, Ko Y-C, Tsang C, Chiu H, Wang T, Bao Q, et al. 2020. Ancient DNA indicates human population shifts and admixture in northern and southern China. Science 369(6501):282–288. [DOI] [PubMed] [Google Scholar]
Associated Data
This section collects any data citations, data availability statements, or supplementary materials included in this article.
Supplementary Materials
Data Availability Statement
The data underlying this article are available in NCBI Short Read Archive (SRA) database under the project accession numbers PRJNA485658 and PRJNA717716.