

Abstract
Sulfur mustard (SM) has been widely used as a chemical warfare agent including most recently in Syria. Mice exposed to SM exhibit an increase in pro-inflammatory cytokines followed by immune cell infiltration in the lung, however, the mechanisms leading to these inflammatory responses has not been completely elucidated. Mast cells are one of the first responding innate immune cells found at the mucosal surfaces of the lung and have been reported to be activated by SM in the skin. Therefore, we hypothesized that nitrogen mustard (NM: a surrogate for SM) exposure promotes activation of mast cells causing chronic respiratory inflammation. To assess the role of mast cells in NM-mediated pulmonary toxicity, we compared the effects of NM exposure between C57BL/6 and B6.Cg-KitW-sh/HNihrJaeBsmJ (KitW-sh; mast cell deficient) mice. Lung injury was observed in C57BL/6J mice following NM exposure (0.125 mg/kg) at 72 h, which was significantly abrogated in KitW-sh mice. Although both strains exhibited damage from NM, C57BL/6J mice had higher inflammatory cell infiltration and more elevated prostaglandin D2 (PGD2) present in bronchoalveolar lavage fluid compared with KitW-sh mice. Additionally, we utilized murine bone marrow-derived mast cells to assess NM-induced early and late activation. Although NM exposure did not result in mast cell degranulation, we observed an upregulation in PGD2 and IL-6 levels following exposure to NM. Results suggest that mast cells play a prominent role in lung injury induced by NM and may contribute to the acute and potentially long-term lung injury observed caused by SM.
Keywords: sulfur mustard, chemical warfare agents, inhalation exposure, oxylipin, lipid mediator, metabolomics
Sulfur mustard (SM; 2,2-dichloroethyl sulfide) is a chemical warfare agent that has been used extensively in numerous conflicts (Centers for Disease and Prevention, 2013). SM is a potent bifunctional alkylating agent that has adversely affected countless military personnel and civilians since its first use in World War I (Jiang and Maibach, 2018; Shakarjian et al., 2010). The use of SM remains an ongoing issue despite worldwide regulations and bans (Wolfe et al., 2019). SM has extensively been used in the Iran-Iraq War, the Persian Gulf War, and its continued usage was reported as recent as 2015–2018 in the ongoing conflicts in Syria (Brimfield, 2012; Nokhodian et al., 2015; Sezigen et al., 2020). Despite its comprehensive use in military conflicts, the mechanism of its toxicity is not well studied, and an effective therapeutic or prophylactic treatment remains elusive.
Respiratory exposure is the primary route of exposure leading to chronic toxicity and mortality. More than 40% of veterans from the Iran-Iraq war, as well as 30% of veterans who served in the Persian Gulf War, have suffered acute as well as long-term respiratory complications. This could be a result of persistent lung inflammation due to multiple chemical exposures including SM (Darchini-Maragheh and Balali-Mood, 2018; Pearson, 1993). Respiratory symptoms which have led to long-term disability amongst veterans of the Iran-Iraq war include breathing complications, bronchitis, asthma, pulmonary fibrosis, and chronic obstructive pulmonary disease (Balali-Mood and Abdollahi, 1993; Darchini-Maragheh and Balali-Mood, 2018). Despite low mortality, chronic toxicity from SM causes lifelong respiratory problems originating from systemic inflammation that negatively impacts the lungs (Veress et al., 2013).
Acute and chronic inflammation in the lung as a result of SM exposure is well documented. There have been several mechanisms proposed for SM-mediated inflammation, but no model fully encapsulates the inflammatory response observed in vivo (Korkmaz et al., 2008). Proposed mechanisms that have been explored encompass DNA alkylation, upregulation of cellular proliferation in the bone marrow, the production of reactive oxygen species (ROS) and electrophilic species, and an upregulation in proinflammatory cytokines (Korkmaz et al., 2008; Shakarjian et al., 2010). In rabbits, inhalation to SM induced leukocyte proliferation and cellular abnormalities in the bone marrow (Levels SoAEG, 2002). In addition, in rodent models, inhalation of SM resulted in an upregulation in cytokine formation, such as tumor necrosis factor alpha (TNF-α), interleukins (ILs) such as IL-1β, IL-6, and IL-8, platelet activating factor, and the bioactive arachidonic acid metabolites which led to the infiltration of macrophages and neutrophils in the lung (Malaviya et al., 2020; McGraw et al., 2018). Although we know that SM-induces inflammation, the exact mechanism(s) remains unknown. In this study, we examined the role of mast cells due to increasing evidence that suggests mediators generated from mast cells are pivotal in the pathogenesis of SM-induced acute and long-term toxicity. In the mouse skin, SM induced mast cell accumulation and activation through mast cell degranulation, histamine release, prostaglandin E2 formation, and cytokine release; IL-1β, TNF-α, IL-2, IL-6, and matrix metalloproteinase-9 (MMP-9) activation (Chang et al., 2018; Sabourin et al., 2000).
Mast cells are one of the “first responders” of the immune system, contributing to a wide range of inflammatory reactions. Upon activation, mast cells will rapidly release several preformed and newly synthesized mediators such as histamine, prostaglandins, and proinflammatory cytokines and chemokines (Krystel-Whittemore et al., 2015). These factors aid in immune cell recruitment, vascular permeability, and smooth muscle contraction, all playing a central role in pulmonary toxicity (Gurish and Boyce, 2006; Krystel-Whittemore et al., 2015). Due to their location at the mucosal interface of the lung, their role in other pulmonary diseases, and contribution to inflammation, we investigated the activation of mast cells by SM.
To investigate the role of mast cells in response to SM exposure, we utilized a less toxic, safer analog, nitrogen mustard (NM; bis(2-chlorethyl) [Calvet et al., 1999]). Similar to SM, NM is a bi-functional alkylating agent that causes comparable histological and molecular damage in the lung, skin, and eyes (Anderson et al., 2009; Goswami et al., 2019; Jain et al., 2014; Sunil et al., 2011). We hypothesized that mast cells play a critical role in initiating a robust inflammatory response stimulated by NM exposure in the lung. To assess this, we examined in vitro activation of mast cells by NM, and used both wild type and mast cell deficient mice to examine the lung inflammation following NM exposure. The B6.Cg-KitW-sh/HNihrJaeBsm (KitW-sh; mast cell deficient) mice have a transversion mutation on the c-KIT receptor, necessary for the proliferation and maturation of mast cells and have been used extensively to define the role of mast cells in various diseases (Brown et al., 2007; Grimbaldeston et al., 2005). These studies explored the novel concept that mast cells play a critical role in pulmonary inflammation following SM exposure and may provide a novel therapeutic target in SM toxicity.
MATERIALS AND METHODS
Animals
Wild type (C57BL/6J) and B6.Cg-KitW-sh/HNihrJaeBsm (KitW-sh; mast cell deficient) male mice were purchased from Jackson Laboratories at 4 weeks of age (Bar Harbor, ME). Mice were allowed to acclimate to the vivarium for 3 weeks prior to the start of the experiment and were used between 7 and 8 weeks of age. Mice were kept in a temperature-controlled environment with 12-h light-dark cycles. Mice were provided standard chow and water ad libitum. All animals utilized for this study complied with the guidelines approved by the University of Colorado’s Institutional Animal Care and Use Committee.
Oropharyngeal Aspiration
Mice were anesthetized using 3% isoflurane for 2 min prior to oropharyngeal aspiration. Mice were placed on a 60° inclined intubation platform (Braintree Scientific Inc., Braintree, Massachusetts) by their front teeth. With forceps, the tongue of the mouse was gently pulled out and held down as mice were dosed with either NM (Sigma-Aldrich, St. Louis, Missouri) or phosphate-buffered saline (PBS) toward the distal part of the oral cavity using a pipette. NM was diluted in phosphate-buffered saline for a concentration of 0.1 mg/ml stock. Mice were each dosed once with 0.125 mg/kg of NM according to their body weight. The dose was similar to that found in the literature for the NM studies (Malaviya et al., 2015; Sunil et al., 2014). We also observed in an earlier timepoint (24 h) and lower dosage (0.063 mg/kg) that peak immune response occurred at the dose previously described above and in literature. Mast cells are also known for their immediate response therefore it was important to determine if they were being activated within 72 h at 0.125 mg/kg NM and not longer, due to damage observed. Control mice were dosed with an equal volume of PBS. Once dosed, the tongue was released after 20 s of administration. Animals were then placed in a dry box to make sure mice did not regurgitate treatment. Mice were then sacrificed 72 h after exposure to study the acute immune response initiated by NM.
Animal Lavage and Bronchoalveolar Lavage Fluid Analysis
Seventy-two hours after oropharyngeal aspiration, mice were sacrificed via CO2. Tracheostomies were performed on mice and 22 gauge × ½ inch luer stubs (Harvard Apparatus, Holliston, Massachusetts) were inserted into the trachea. The lungs were lavaged with Hanks’ Balanced Salt solution (HBSS; Gibco, Waltham, Massachusetts) at an initial volume of 700 µl and bronchoalveolar lavage fluid (BALF) was collected. Proceeding the initial collection, this procedure was repeated 3 times for a total volume of 3 ml of BALF placed in a separate tube. To separate cells from the initial lavage and the lavages proceeding, BALF was centrifuged at 1200 g for 5 min to isolate cells. Cells were pooled from both initial lavage and proceeding lavages and resuspended in sterile Dulbecco’s PBS (dPBS; Sigma-Aldrich). Cytospin slides were prepared using a Thermo Shandon Cytospin 4 (ThermoFisher Scientific, Waltham, Massachusetts). The slides were then stained with the Hema 3 set (Biochemical Sciences, Swedesboro, New Jersey) for differential cell counts as described by manufacturer’s protocol. BALF was analyzed (without cells) for total protein content utilizing the Pierce BCA protein assay kit following the manufacturer’s protocol (ThermoFisher Scientific).
Lung Histology: H&E and Toluidine Blue Staining
Seventy-two hours after oropharyngeal aspiration, mice were sacrificed as previously described. Tracheostomies were performed on mice and 22 gauge × ½ inch luer stubs (Harvard Apparatus) were inserted into the trachea. The left lung was inflated with 1 ml of formalin solution (neutral buffered, 10%, Sigma-Aldrich), and after 24 h fixation, taken to the university of Colorado Cancer Center Histology Core for processing. The Colorado Cancer Center Histology Core stained the slides with H&E to visualize cellular damage and toluidine blue to visualize mast cells.
Lung scoring analysis
Histologic analyses were performed by 2 blinded investigators. Hematoxylin and eosin stained slides were imaged at 20× magnification using a Leica Aperio CS2 slide scanner (Aperio ScanScope software, version 102.0.7.5). Scanned images were then viewed using Aperio ImageScope software (version 12.4.3.500B), and regions of interest (ROI) were selected by overlaying whole images with a grid to allow for the identification of 20 ROI’s using standardized uniform random sampling (Hsia et al., 2010). Selected ROI’s (0.05 mm2 areas each) were examined at high resolution and scored using an acute lung injury index to account for alveolar and interstitial neutrophilia, alveolar thickening, and debris in airspaces (Matute-Bello et al., 2011).
Lactate dehydrogenase lung tissue staining
Slides were deparaffinized and antigen retrieval method was done to visualize lactate dehydrogenase (LDH). In brief, after slides were deparaffinized they were placed in a pressure cooker with 1× Citrate antigen retrieval buffer (Sigma-Aldrich). Slides were microwaved for 20 min at 50% power. Slides were then washed with PBS and Mouse on Mouse (M.O.M) IgG blocking reagent was used on each tissue section and incubated for 1 h (Mouse on Mouse (M.O.M.) ImmPRESS Polymer Kit, Peroxidase kit, Vector Laboratories, Burlingame, California). After incubation, slides were then washed with PBS and M.O.M 2.5% Normal Horse Serum (NHS) (Vector Laboratories ImmPRESS Polymer Kit, Peroxidase kit, Vector Laboratories) was added for 10 min. NHS was then tipped off and LDH primary antibody (ab52488, Abcam, Cambridge, Massachusetts) was added at a 1:500 dilution in a humidified chamber overnight at 4°C. The next day slides were washed in PBS and secondary antibody Alexa Fluor 647 (ab150083, Abcam) was added at a 1:500 dilution for 1 h. Slides were washed with PBS and slides were mounted with ProLong Diamond Antifade Mountant (Invitrogen, San Diego, California). Images were taken using the Cytation 1 Cell Imaging Multi-Mode Reader (Biotek, Agilent, Winooski, Vermont).
Cell Culture
Bone marrow derived mast cells (BMMCs) were obtained from bone barrow isolated from femurs of C57BL/6J mice (Jackson Laboratories, Bar Harbor, Maine) at 5–8weeks of age. For each flask there were a total of 4 femurs flushed representing an n = 1. Cells were cultured at 37°C and 5% CO2 for 5–7 weeks in RPMI 1640 medium (Corning, Manassas, Virginia), supplemented with 10% FBS (Corning), 25mM HEPES (Corning), 1.0mM sodium pyruvate (Sigma-Aldrich), 1.0mM non-essential amino acids (Sigma-Aldrich), 100U/ml penicillin, 100μg/ml streptomycin (Life Technologies, Carlsbad, California), 100μg/ml Primocin (Invitrogen, San Diego, CA), 0.0035% β-mercaptoethanol and 30ng/ml recombinant murine IL-3 (Biolegend, San Diego, California).
BMMC Maturity Assay
Maturity of BMMCs was confirmed at 4 weeks. Fifty-thousand cells were transferred and pelleted by centrifuging at 800 g for 5 min at 4°C. Cells were washed 2× with stain buffer (BD Pharmigen, San Diego, California) prior to incubation in their respective stains at room temperature for 30 min. Control cells only contained stain buffer, isotype control contained Rat IgG2b kappa isotype control (APC) and Armenian Hamster IgG isotype control (PE) diluted 1:200 (Invitrogen) and antibody stain contained anti-Mo CD117 (c-kit) (APC) and anti-Mo FcεR1alpha (PE) diluted 1:200 (Invitrogen). After incubation, the fluorescent signals were read on a flow cytometer (BD AccuriTM C6, BD Biosciences, San Jose, California).
Viability Assay
To assess cell viability, annexin V (BD Biosciences)/propidium iodide (PI) (Invitrogen) stain was utilized to look at apoptosis and necrosis, respectively. BMMCs were plated at 1 × 10⁵ cells/well and then exposed to NM at varying concentrations (1–100 μM) for 1, 6, and 24 h. Concentration ranges were similar to what was found in literature and to what veterans were potentially exposed to (Kehe et al., 2008; Agency for Toxic Substances and Disease Registry, 2003). Hydrogen peroxide was used as positive control (10 mM for 1 h). After exposure, cells were washed 2× with PBS and resuspended in propidium iodide (PI)-containing stain buffer at a final concentration of 3 μM. About 2 μl of annexin-V was added directly to each sample and gently vortexed. Samples were incubated in the dark at room temperature for 15 min and the fluorescent signal was measured on a BD Accuri flow cytometer (BD Accuri C6, BD Biosciences).
Degranulation Assay
Mast cell degranulation was measured by the release of β-hexosaminidase and lysosomal associated membrane protein 2 (LAMP2) expression. For the release of β-hexosaminidase, cells were plated in HEPES biological buffer at 5 × 10⁴ cells per well in a 96-well plate. Cells were exposed to NM, at varying concentrations (1–50 μM) for 1, 6, and 24 h. For the assay’s positive control, a subset of mast cells was sensitized with IgE anti-dinitrophenyl (anti-DNP) (100 ng/ml) (Sigma-Aldrich) for a minimum of 2 h followed by addition of DNP human serum albumin (DNP-HSA) (100 ng/ml) (Sigma-Aldrich) for 1 h to generate an IgE mediated response. After exposures, the plate was centrifuged at 300 g for 5 min to pellet cells. About 50 μl of supernatant was removed without disturbing cell pellet and transferred to a new 96-well plate. About 150 μl of Triton-X was added to the plate with the cell pellet to lyse the cells. About 50 μl of this cell lysate was transferred into new 96-well plate. About 100 μl of p-nitrophenyl-N-acetyl-b-D-glucopyranoside (PNAG) (Sigma-Aldrich), a chromogenic substrate, was added to both the supernatant and lysed cells and incubated at 37°C for 90 min. To stop the reaction, 100 μl of glycine was added to all wells and optical density was read at 405 nm on uv vis spectrophotometer (Biotek Synergy HT microplate reader, Agilent). Percentage of degranulation was calculated as follows: [(supernatant × 2)/(lysate × 4)]×100.
To confirm β-hexosaminidase, LAMP2 was measured to verify the presence of mast cell degranulation. Cells were exposed to NM, at varying concentrations (0.1 µM- 100 µM) for 1 and 24 h time points for BMMCs. Alongside the treatments was a no treatment negative control and IgE positive control. After exposure, cells were washed and incubated with LAMP 2 (CD117, Cell Signaling Technology, Danvers, Massachusetts ) antibody. Flow Cytometry (BD AccuriTM C6, BD Biosciences, San Jose, CA) was used to measure the fluorescently labeled LAMP2 expression found on the cell surface of activated cells. All experiments were completed in triplicates from 3 to 4 individual batches of mast cells from 6 to 8 mice.
Gene Expression for In Vivo and In Vitro by Real Time (RT)PCR
Gene expression was measured through the amplification of mRNA transcripts using real time PCR. For in vitro studies, cells were seeded in a 24 well plate at 1 × 10⁶ cells/well and then exposed to NM at varying concentrations (1–50 μM) for 1, 3, and 6 h. Post exposure, cells were centrifuged, and supernatants were discarded. To lyse the cells, pellets was reconstituted in 400 µl of TRI reagent (Sigma-Aldrich) and placed in −80°C until further processing. RNA was isolated using the Direct-20L RNA MiniPrep kit for each cell sample. To determine the quality and concentration of the RNA, we utilized a NanoDrop 2000 (ThermoFisher Scientific, Waltham, MA) followed by cDNA production. Using the iScript cDNA Synthesis kit. SYBR green supermix was used (Bio-Rad, Hercules, California) and the following primers [Prostaglandin-endoperoxide synthase 2 (Ptgs2; Cox2), Tnfα, Il6, and Il1β (Qiagen, Germantown, Maryland)] were added to cDNA to perform RT-PCR. All experiments were completed in triplicates from 3 individual batches of mast cells. Gene expression was quantified using ΔΔCT method, relative to the GAPDH control (housekeeping gene). For animal tissues, the right lung lobe was removed and placed in 2 ml of RNAlater (Invitrogen, Thermo Scientific, Rockford, Illinois) and placed in the −20 freezer. Twenty to thirty mg of lung tissue was removed and homogenized using the Fast prep 5G homogenizer (MP Biomedicals) in 700 μl of TRI reagent. Supernatant was collected and processed for RT-PCR as described above.
Cytokine Release by Enzyme-Linked Immunosorbent Assay In Vitro
IL-6 and prostaglandin 2 (PGD2) was measured in BMMCs. For IL-6, cells were plated in 24 well plate at 1 × 10⁶ cells/well and then exposed to NM at varying concentrations (1–50 μM) for 24 h. For PGD2 cells were plated in 24 well plate at 1 × 10⁶ cells/well and then exposed to NM at varying concentrations (1–50 μM) for 6 h. After exposure, cells were centrifuged at 800 g at 4°C for 5 min and supernatants were collected and stored at −80°C until further processing. IL-6 cytokine release was measured with DuoSet enzyme-linked immunosorbent assay (ELISA) Development Systems (R&D Systems, Minneapolis, Minnesota) according to the manufacturer protocol. PGD2 express ELISA Kit (Cayman, Ann Arbor, Michigan) was carried out according to the manufacturer protocol. All experiments were completed in duplicates from 4 individual batches of mast cells.
Oxylipin Sample Preparation
All standards and internal standards used for LC/MS/MS analysis of arachidonic acid, docosahexaenoic acid and linoleic acid derived lipid mediators were purchased from Cayman Chemical (Ann Arbor, Michigan). All HPLC solvents and extraction solvents were HPLC grade or better. All analysis was done at the University of Colorado School of Pharmacy mass spectrometry facility.
Bronchoalveolar lavage fluid (BALF) samples were pretreated for solid phase extraction. Briefly, samples were diluted in a 9% methanol, 1% ethanol solution by adding 100 µl methanol and 10 µl of the internal standard solution (10 pg/µl each of 5(S)-HETE-d8, 8-iso-PGF2a-d4, 9(S)-HODE-d4, LTB4-d4, LTD4-d5, LTE4-d5, PGE2-d4, PGF2a-d9 and RvD2-d5 in ethanol) and sufficient water to create 1 ml of solution. Samples were then homogenized by vortexing and purified by solid phase extraction (SPE).
Lipid mediators from cells were isolated and purified using SPE as follows. The reconstituted extracts were loaded on a Strata-X 33 µm 30 mg/1 ml SPE column (Phenomenex, Torrance, California) preconditioned with 2 volumes of 1.0 ml methanol. The SPE column was then washed with 10% methanol and then eluted directly into a reduced surface activity/maximum recovery glass autosampler vial with 1.0 ml of methyl formate. The methyl formate was evaporated completely from the vial with a stream of nitrogen and then the SPE cartridge was then eluted with 1.0 ml of methanol directly into the same autosampler vial. The methanol was evaporated to dryness with a stream of nitrogen and then the sample was reconstituted with 20 μl of ethanol. The samples are analyzed immediately or frozen at −70°C until analysis.
Liquid Chromatography-Mass Spectrometry
Quantitation of lipid mediators was performed using 2-dimensional reverse phase HPLC tandem mass spectrometry (LC/MS/MS). The HPLC system consisted of an Agilent 1290 autosampler (Agilent Technologies, Santa Clara, California), an Agilent 1200 binary SL loading pump (pump 1), an Agilent 1290 binary analytical pump (pump 2) and a 6 port switching valve. Pump 1 buffers consisted of 0.1% formic acid in water (solvent A) and 9:1 v: v acetonitrile: water with 0.1% formic acid (solvent B). Pump 2 buffers consisted of 0.01% formic acid in water (solvent C) and 1:1 v: v acetonitrile: isopropanol (solvent D).
About 5 μl of extracted sample was injected onto an Agilent SB-C18 2.1 × 5 mm 1.8 μm trapping column using pump 1 at 2 ml/min for 0.5 min with a solvent composition of 97% solvent A: 3% solvent B. At 0.51 min the switching valve changed the flow to the trapping column from pump 1 to pump 2. The flow was reversed, and the trapped lipid mediators were eluted onto an Agilent Eclipse Plus C-18 2.1 × 150 mm 1.8 um analytical column using the following gradient at a flow rate of 0.3 ml/min: hold at 75% solvent A : 25% solvent D from 0 to 0.5 min, then a linear gradient from 25% to 75% D over 20 min followed by an increase from 75% to 100% D from 20 to 21 min, then holding at 100% D for 2 min. During the analytical gradient pump 1 washed the injection loop with 100% B for 22.5 min at 0.2 ml/min. Both the trapping column and the analytical column were re-equilibrated at starting conditions for 5 min before the next injection.
Mass spectrometric analysis was performed on an Agilent 6490 triple quadrupole mass spectrometer in negative ionization mode. The drying gas was 250°C at a flow rate of 15 ml/min. The sheath gas was 350°C at 12 ml/min. The nebulizer pressure was 35 psi. The capillary voltage was 3500 V. Data for lipid mediators was acquired in dynamic MRM mode using experimentally optimized collision energies obtained by flow injection analysis of authentic standards. Calibration standards for each lipid mediator were analyzed over a range of concentrations from 0.25 to 250 pg on column. Calibration curves for each lipid mediator were constructed using Agilent Masshunter Quantitative Analysis software. Samples were quantitated using the calibration curves to obtain the on-column concentration, followed by multiplication of the results by the appropriate dilution factor to obtain the concentration in pg/ml.
Statistical Analysis
Animal data are presented as mean ± standard deviation (SD). Two-way ANOVA with Turkey’s post-hoc testing which was utilized to test for significant differences between multiple treatment groups (C57BL/6J vs KitW-sh). Significant differences are *p ≤ .05 compared with its respective control, †p ≤ .05 compared between treated strains. Cellular data (BMMC’s) are presented as mean ± standard error of mean (SEM). One-way ANOVA with Dunnett’s post hoc testing was utilized to test for significant differences between treatment groups compared with control. Significant differences are at p < .05. Each flask of cells pooled from 2 separate mice was considered a biological replicate (N = 3–4).
RESULTS
Nitrogen Mustard Exposure Causes Significant Lung Injury in C57BL/6J Mice Compared with KitW-sh Mice
To establish a role for mast cells in NM mediated pulmonary toxicity, we compared lung histopathology following NM exposure between C57BL/6J and KitW-sh (mast cell deficient) mice. Mice were exposed via oropharyngeal aspiration to PBS (control) or NM (0.125 mg/kg) and sacrificed at 72 h (n = 5–7/group) to assess inflammation and tissue damage. Our findings indicate significant lung injury in C57BL/6J following NM exposure (Figure 1B). Lung injury was characterized by massive immune cell infiltration and thickening of bronchioles (Figure 1B). In contrast, lung injury in KitW-sh mice was minimal as compared with the C57BL/6 mice (Figure 1D;Supplementary Figure 1). These results suggest that mast cells play a critical role in initiating the inflammatory response that is observed through histological changes in C57BL/6J mice, which is largely absent in KitW-sh mice. To confirm changes seen in Figure 1, we looked at the expression of LDH in C57BL/6J and KitW-sh mice (Figure 2). C57BL/6J mice had higher amounts of LDH present in tissue compared with KitW-sh mice (Figure 2). To further characterize lung injury, we counted immune cell infiltration in the BALF of C57BL/6J and KitW-sh mice following exposure to NM (n = 4–6/group). Although the total cell count for the controls in both strains, C57BL/6J and KitW-sh mice, were similar (Figure 3A), the NM treated C57BL/6J mice had significantly greater number of total inflammatory cells than its respective control and compared with KitW-sh NM treated mice (Figure 3A). In addition to examining total cell counts, we evaluated the immunological cell components that comprised the BALF.
Figure 1.

Significant lung injury is observed in C57BL/6J mice that is largely absent in KitW-sh mice after nitrogen mustard exposure. Representative histological findings in mice treated via oropharyngeal aspiration with phosphate-buffered saline (PBS) (control) (A and C) or nitrogen mustard (0.125 mg/kg) for 72 h (B and D) (N = 5–9 mice/group). The left lobe of the lung was removed and stained with hematoxylin and eosin (H&E). Black arrows indicate immune cells (B), white arrows are pointing at thickening of bronchioles (B), and the red star represents immune cell infiltration (B). Images were obtained using an Olympus light microscope at a 4× objective (indicated by 200 μm scale) and a 20× objective (indicated by 50 μm scale).
Figure 2.

Nitrogen mustard treated C57BL/6J mice had increased staining for lactate dehydrogenase in the lung compared with KitW-sh. Representative histological findings in mice treated via oropharyngeal aspiration with phosphate-buffered saline (PBS) (control) or nitrogen mustard (0.125 mg/kg) for 72 h (N = 5–9 mice/group). The left lobe of the lung was removed and stained with lactate dehydrogenase (LDH). White arrows indicate LDH positive areas. Images were taken using the Cytation 1 Cell Imaging Multi-Mode Reader (Biotek, Agilent).
Figure 3.

Nitrogen mustard exposure leads to increased lung cellular infiltration in C57BL/6J mice compared with KitW-sh mice. To assess lung cellular inflammation following exposure to nitrogen mustard (NM) (0.125 mg/kg) at 72 h, lungs were lavaged to collect bronchoalveolar lavage fluid (BALF) for analysis. There was a significant increase in total cell counts (A), monocytes (B), eosinophils (D), and lymphocytes (E) in C57BL/6J mice that was largely absent in KitW-sh mice following NM exposure. There was a significant decrease in macrophages (C) in C57BL/6J mice compared with KitW-sh mice following NM exposure. Data are presented as the mean±SD (n = 4–6 animals/group); two-way ANOVA with Tukey’s post hoc test, *p ≤ .05, **p ≤ .01, ***p ≤ .001, ****p ≤ .0001.
The NM treated C57BL/6J mice exhibited a significant increase in monocytes (15.62 ± 3.524 vs 0.4000 ± 0.5477; mean ± SD; NM treated vs control), eosinophils (3.883 ± 0.6912 vs 0.2667 ± 0.4346; mean ± SD; NM treated vs control), polymorphonuclear cells (PMNs) (32.94 ± 4.991 vs 0.00 ± 0.00; mean ± SD; NM treated vs control), and lymphocytes (26.00 ± 4.975 vs 0.1333 ± 0.1826; mean ± SD; NM treated vs control) compared with the C57BL/6J control mice (Table 1; Figs. 3B–E). The KitW-sh NM treated mice exhibited an increase in PMNs (38.50 ± 7.037 vs 0.08333 ± 0.1667; mean ± SD; NM treated vs control) and lymphocytes (17.17 ± 5.588 vs 2.250 ± 1.167; mean ± SD; NM treated vs control) compared with KitW-sh control mice (Table 1; Figure 3E). C57BL/6J treated mice had more lymphocyte (26.00 ± 4.975 vs 17.17 ± 5.588; mean ± SD; NM treated C57BL/6J vs NM treated KitW-sh), monocyte (15.61 ± 3.524 vs 3.833 ± 2.082; mean ± SD; NM treated C57BL/6J vs NM treated KitW-sh), eosinophil (3.883 ± 0.6912 vs 1.125 ± 0.7622; mean ± SD; NM treated C57BL/6J vs NM treated KitW-sh) infiltration compared with the treated KitW-sh mice (Figs. 3B, 3D, and 3E). Conversely, treated KitW-sh mice had more macrophages (34.58 ± 4.810 vs 16.28 ± 5.339; mean ± SD; NM treated KitW-sh vs NM treated C57BL/6J) compared with treated C57BL/6J mice (Figure 3C). The total cell counts and immune cell differentials in BALF demonstrated that NM caused damage in the lungs of both mice strains. However, C57BL/6J NM treated mice exhibited greater damage as evidenced by the ≈ 6-fold increase in total cell count compared with the control (Figure 3A) accompanied with the increase in monocyte, eosinophils, PMNs, and lymphocyte cell populations in the BALF (Table 1; Figs. 3A, 3B, 3D, and 3E)). Another indication of damage and NM toxicity was the substantial weight loss (Supplementary Figure 2; n = 10–27/group) observed in C57BL/6J NM treated mice compared with C57BL/6J control mice (−6.410 ± 1.085 vs 0.6957 ± 0.4048%; mean % weight change ± S.E.M; NM treated vs control, p < .05). KitW-sh NM treated mice experienced minor weight loss that was not significant (−1.317 ± 0.7881 vs 1.330 ± 0.5740%; mean % weight change ± S.E.M; NM treated vs control). In KitW-sh NM treated mice, there is evidence that an immune response is occurring but to a much lesser degree as demonstrated in the lung total cell count and cellular differentials.
Table 1.
Differences in Immune Cell Composition in BALF Following Nitrogen Mustard Exposure
| Macrophage (% ± SD) | Monocytes (% ± SD) | Eosinophils (% ± SD) | PMNs (% ± SD) | Epithelial (% ± SD) | Lymphocyte (% ± SD) | |
|---|---|---|---|---|---|---|
| C57BL/6J Control | 75.87 ± 5.67 | 0.4 ± 0.55 | 0.27 ± 0.43 | 0.00 ± 0.00 | 23.47 ± 5.74 | 0.13 ± .18 |
| C57BL/6J Treated | 16.28 ± 5.34 *† | 15.61 ± 3.52 *† | 3.83 ± 0.69 *† | 32.94 ± 4.99 * | 4.83 ± 1.36 * | 26 ± 4.98 *† |
| KitW- sh Control | 72.67 ± 3.68 | 0.92 ± 0.42 | 0.33 ± 0.27 | 0.083 ± 0.17 | 24.5 ± 5.87 | 2.25 ± 1.17 |
| KitW- sh Treated | 34.58 ± 4.81 *† | 3.83 ± 2.08 † | 1.13 ± 0.76 † | 38.5 ± 7.04 * | 4.83 ± 3.51* | 17.17 ± 5.59 *† |
To determine if there are differences in the immune cell composition of the BALF, we stained the slides and analyzed the differences in populations. C57BL/6J NM treated mice had more lymphocytes, monocytes, and eosinophil infiltration compared with KitW-sh NM treated group. Data are presented as the mean±SD (n = 4–6 animals/group); two-way ANOVA with Tukey’s post hoc test, *p ≤ .05 compared with its respective control, †p ≤ .05 compared between treated strains, italicized values are p ≤ .05.
Nitrogen Mustard Exposure Causes Significant Proinflammatory Cytokine Expression in Lungs of C57BL/6J Mice Compared with KitW-sh Mice
We analyzed various proinflammatory cytokines in the same BALF described above and right lung lobe at 72 h following NM exposure. To look at mRNA gene expression the right lung lobe was used. For C57BL/6J NM treated mice, there was an upregulation in mRNA expression of Ptgs2 (4.174 ± 4.714; NM treated fold-change average ± fold-change SD compared with control (1)), Il6 (6.078 ± 3.879; NM treated fold-change average ± fold-change SD compared with control (1)), and Tnfα (4.591 ± 4.775; NM treated fold-change average ± fold-change SD compared with control (1)) that was not observed in KitW-sh NM treated mice (Figure 4). All genes in the KitW-sh NM treated mice did not change relative to control at 72 h (Figure 4). To further evaluate protein production, we measured PGD2, which is downstream from Ptgs2, via mass spectrometry. There was an increase in PGD2 in the BALF of C57BL/6J treated mice relative to its respective control and to KitW-sh NM treated mice (Figure 5). In the lung, PGD2 is primarily produced by activated mast cells, and to a smaller degree by a subset of T cells (T helper cell 2: Th2) and dendritic cells (Arima and Fukuda, 2011). In summary, the major differences observed between C57BL/6J and KitW-sh NM treated mice suggests that mast cells play a prominent role in the initiation and prolonged inflammation observed at 72 h.
Figure 4.
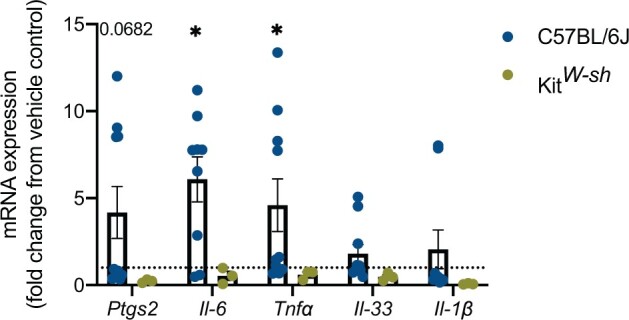
Upregulation in proinflammatory cytokine mRNA gene expression in C57BL/6J mice that is absent in KitW-sh mice following nitrogen mustard (NM) exposure. To evaluate the presence of proinflammatory cytokines in C57BL/6J and KitW-sh strains, we further analyzed the lung tissue. C57BL/6J treated mice exhibited upregulation in Ptgs2, Il-6, and Tnfα, whereas mRNA gene expression in KitW-sh NM treated mice exhibited no change compared with control. Data are presented as the mean±SD (n = 3–10 animals/group), compared with fold change from control (normalized to 1); two-way ANOVA with Tukey’s post hoc test, *p ≤ .05, **p ≤ .01, ***p ≤ .001, ****p ≤ .0001.
Figure 5.
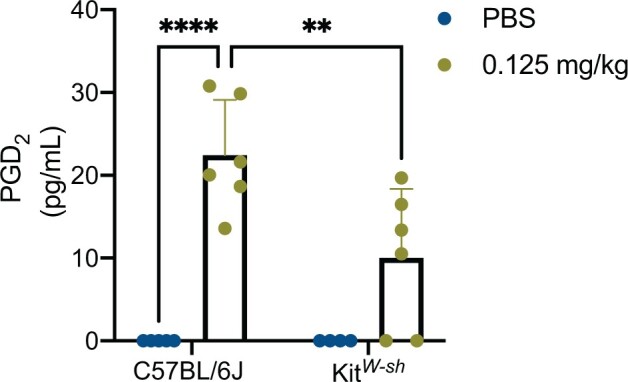
Nitrogen mustard elicits an increase in PGD2 in C57BL/6J mice compared with KitW-sh mice. To further explore the downstream effects of nitrogen mustard (NM) in the lungs of treated C57BL/6J and KitW-sh mice, we analyzed the lipid mediator, PGD2, via mass spectrometry, in the bronchoalveolar lavage fluid (BALF). NM treated C57BL/6J mice had an increase in PGD2 compared with its respective control and KitW-sh NM treated mice. Data is presented as the mean±SD (n = 4–6 animals/group); two-way ANOVA with Tukey’s post hoc test, *p ≤ .05, **p ≤ .01, ***p ≤ .001, ****p ≤ .0001.
Linoleic acid Metabolites in NM Treated C57BL/6J Mice Are Significantly Elevated in Relation to KitW-sh Mice
To further understand the role mast cells play in initiating the immune response seen, we examined BALF for additional bioactive lipid metabolites utilizing a targeted mass spectrometry approach (see Supplementary Table 1 for a complete list of targeted lipid mediators). In our analysis we found significant differences in epoxy-octadecenoic acids (EpOME) and dihydroxy-octadecenoic acids (DiHOMES) which are produced by neutrophils, macrophages, and mast cells (Astarita et al., 2015; Gabbs et al., 2015). In our experiments, NM treated C57BL/6J mice and NM treated KitW-sh mice exhibited a significant increase in 12(13)-EpOME, whereas 9(10)-EpOME trended toward increased expression (Figures 6A and 6C). In addition to the parent compounds being elevated, their metabolites 12 (13)-DiHOME and 9(10)-DiHOME are significantly increased compared with its respective control in the NM treated C57BL/6J mice (Figures 6B and 6D). Although there was a similar trend for 12 (13)-DiHOME and 9(10)-DiHOME in NM treated KitW-sh mice these were not significantly different from control mice. This evidence of additional bioactive lipids further strengthens the role of mast cells in contributing to the pulmonary toxicity observed in NM treated C57BL/6J mice.
Figure 6.

Nitrogen mustard exposure causes significant increases in linoleic acid pathway metabolites in C57BL/6J mice. In assessing the oxylipin profiles in both C57BL/6J mice and KitW-sh mice via targeted mass spectrometry, we further looked into the linoleic acid pathway in bronchoalveolar lavage fluid (BALF). We examined 12(13)-EpOME (A), 12(13)-DiHOME (B), 9(10)-EpOME (C), and 9(10)-DiHOME (D).The metabolites 12(13) and 9(10)-DiHOME were only significantly elevated in nitrogen mustard (NM) treated C57BL/6J mice (B and D) compared with its respective control. Data are presented as the mean±SD (n = 4–6 animals/group); two-way ANOVA with Tukey’s post hoc test, *p ≤ .05, **p ≤ .01, ***p ≤ .001, ****p ≤ .0001.
Nitrogen Mustard Does Not Cause Toxicity in Bone Marrow Derived Mast Cells at 1 and 6 h but Does at 24 h
To further characterize the role of mast cells in NM mediated toxicity, we examined mast cell activation in vitro. Prior to characterizing mast cell activation, we examined cytotoxicity in BMMCs following NM exposure. Cytotoxicity was assessed by staining BMMCs with propidium iodide (PI) and Annexin V after NM exposure (concentrations 0.1–100 μM) for 1 (A), 6 (B), and 24 (C) h (Figure 7). At 1 and 6 h NM exposure did not exhibit any significant cytotoxicity in BMMC’s (Figures 7A and 7B; Supplementary Figures 5 and 6). However, at 24 h BMMC’s exhibited an increase in late apoptosis at a concentration 20–100 μM and necrosis at 20 μM and 100 μM compared with control (Figure 7C;Supplementary figure 7).
Figure 7.

Cell viability is not compromised following 1 and 6 h but is at 24 h following nitrogen mustard exposure in bone marrow derived mast cells (BMMCs). Cell death was measured by staining BMMCs with propidium iodide (PI) which measures necrosis and Annexin V which measures apoptosis after NM exposure. Although the earlier time points 1 and 6 h (A and B, respectively) of NM exposure were not toxic to BMMCs, at 24 h (C), NM was toxic to the BMMC’s indicated by the significant late apoptosis and necrosis observed. Data are presented as the mean±SEM (n = 3); one way ANOVA with Dunnett’s post hoc test, * late apoptosis = p ≤ .05 from control group, †necrosis= p ≤ .05 from control group, # early apoptosis =p ≤ .05 from control group.
Nitrogen Mustard Does Not Induce Mast Cell Degranulation In Vitro
Mast cell activation is characterized through early and late phase activation. To assess early phase activation which typically occurs in a matter of seconds to minutes, we measured mast cell degranulation by the release of β-hexosaminidase (granule associated enzyme) and by surface expression of LAMP2. BMMCs were exposed to NM (concentrations 1–100 μM) and IgE/DNP (positive control; allergen-mediated mast cell activation) for 1 h. Our results demonstrate that NM does not induce early phase activation in BMMCs (Figures 8A and 8B). Based on the absence of an early phase response, we explored late phase activation after NM exposure.
Figure 8.

Early phase activation is absent in mast cells after 1 h of nitrogen mustard (NM) exposure. Degranulation was assessed through the release of (A) β-hexosaminidase (lysosomal enzyme) which was measured in supernatants relative to lysed cells and the (B) expression of LAMP2 extracellularly, in bone marrow derived mast cells. At 1 h NM exposure, (A) β-hexosaminidase and (B) LAMP2 expression exhibited no differences compared with control. Data are presented as the mean±SEM (n = 3); one way ANOVA with Dunnett’s post hoc test, *p ≤ .05 treatments compared with control.
Late Phase Activation in Mast Cells Occurs following Nitrogen Mustard Exposure through Upregulation of Cytokine Production
Late phase activation was first examined by mRNA gene expression of proinflammatory cytokines; Il6, Tnfα, Il1β and the COX-2 (Ptgs2). Late phase activation occurs within a matter of minutes to hours and is exhibited through the de novo synthesis of various bioactive lipids such as PGD2 and release of proinflammatory cytokines. BMMC’s were treated with NM at concentrations of 1–50 μM for 1, 3, and 6 h (Figs. 9A–C). Ptgs2 and Tnfα mRNA gene expression were upregulated (9.799 ± 1.239 and 2.273 ± 0.3771; fold-change average ± fold-change SEM compared with control (1), respectively) at 1 h following NM treatment at a concentration of 50 μM (Figure 9A) while Il1β mRNA gene expression was upregulated at concentrations of 20–50 μM (1.336 ± 0.00658 and 1.568 ± 0.3544; fold-change average ± fold-change SEM compared with control (1), respectively) (Figure 8A). At 3 h, Il6 mRNA gene expression was upregulated at concentrations of 20 and 50 μM (4.498 ± 0.2995 and 2.816 ± 0.6326; fold-change average ± fold-change SEM compared with control (1), respectively) and Tnfα mRNA gene expression was upregulated at concentrations of 20 and 50 μM (4.275 ± 1.107 and 4.593 ± 0.6987; fold-change average ± fold-change SEM compared with control (1), respectively) (Figure 9B). Although Ptgs2 was not statistically significant, there was trend of increased mRNA gene expression at concentrations ranging from 10–50 μM (Figure 9B). By 6 h, all genes were down regulated except for Ptgs2 which exhibited a persistent trend of increased expression at concentrations from 10–50 μM (Figure 9C). Additionally, we measured the formation of the lipid mediator PGD2 at 6 h following NM treatment via ELISA. There was a significant increase in PGD2 following exposure to 50 μM NM (Figure 10A). In addition, IL-6 production by BMMCs post 24 h exposure to NM demonstrated significant increase at 20 μM and 50 μM, indicative of late phase activation (Figure 10B). Thus, NM exposure (1–100 μM) did not result in mast cell early phase activation, however, it did result in significant late phase activation.
Figure 9.

Nitrogen mustard causes significant cytokine mRNA gene expression in various proinflammatory cytokines in vitro. To assess the direct effect of nitrogen mustard (NM) on bone marrow derived mast cells (BMMCs), proinflammatory mRNA gene expression (Ptgs2, Il-6, and Tnfα, Il-1β) was measured. There was an increase in Il-6 (B), Ptgs2 (A–C), Tnfα (A–B), and Il-1β (A) in BMMCs exposed to NM. Data are presented as the mean±SEM (n ≥ 3), compared with fold change from control (normalized to 1); one-way ANOVA with Dunnett’s post hoc test, *p ≤ .05 treatments compared with control.
Figure 10.

Late-phase activation in mast cells is present following nitrogen mustard (NM) exposure. Late phase activation was measured in bone marrow derived mast cells (BMMCs) via the release of lipid mediator (A) PGD2 following 6 h NM exposure and release of proinflammatory cytokine (B) IL-6 following 24 h NM exposure. Protein production of prostaglandin D2 (PGD2) was present at 6 h (A) as well as an increase in IL-6 at 24 h (B) following NM exposure in BMMCs. Lipid mediator and cytokine release were measured using Enzyme-Linked Immunosorbent Assay (ELISA). Data are presented as the mean±SEM (n ≥ 3); one-way ANOVA with Dunnett’s post hoc test, *p ≤ .05 from control.
DISCUSSION
The chemical warfare agent SM represents a continued threat to military personnel and civilians alike, due to its ease in production and its massive global stockpiles (Szinicz, 2005). SM’s hydrophobic characteristics poses an environmental threat, persisting in the environment well after initial use. After WWII, the US military moved SM stockpiles from 1 ton storage units to designated stockpiles across the US, disposing of excess SM in the ocean (Agency for Toxic Substances and Disease Registry, 2003). As recently as 2012, commercial fishing companies have reported catching SM-compromised containers, which puts their workers at risk and poses an environmental threat (Centers for Disease and Prevention, 2013). In addition to the persistent environmental SM contamination from previous military altercations, continued use of SM in Syria has been reported as recently as 2015–2018 emphasizing this chemical as an ongoing global threat (Sezigen et al., 2020). Respiratory symptoms manifested as a result of SM exposure closely mirror those seen in veterans with known SM exposure who served in the Iran-Iraq war as well as those in the Gulf War (GW) diagnosed with Gulf war illness (GWI) (Balali-Mood and Hefazi, 2006; Ghanei et al., 2008; Karlinsky et al., 2004).
Several studies have demonstrated an increase in inflammatory cell recruitment following SM exposure in the lung (Ahmad and Ahmad, 2016; Weinberger et al., 2011). Mast cells, derived from the hematopoietic progenitor cell population of the bone marrow, are first responder innate immune cells that heavily populate the lungs (Krystel-Whittemore et al., 2015). Although information is limited on inhalation exposure to SM, it has been shown that SM induces mast cell activation and recruitment in the skin leading to the release of several proinflammatory cytokines such as IL-6, IL-8, IL-2, TNF-α, and MMP9 (Joseph et al., 2018; Mishra et al., 2012). The focus of our study was to determine if mast cells are activated by NM (a surrogate for SM) exposure. This was evaluated by examining lung inflammation in wild type mice (C57BL/6J) and mast cell deficient mice (KitW-sh) as well as investigating mast cell activation in vitro through the utilization of BMMCs. We found that 72 h after mice were exposed to 0.125 mg/kg of NM, we discovered C57BL/6J mice exhibited significant lung injury that was largely absent in KitW-sh mice (Figures 1B and 1D) characterized by lung pathology as well as increases in total cell counts (Figure 3A) and major differences in our cell differentials seen in BALF (Figure 3; Table 1). Although C57BL/6J mice exhibited a decrease in macrophages after NM exposure compared with its respective control, KitW-sh mice macrophage numbers slightly decreased in comparison to C57BL/6J NM treated mice. These changes may be a result of differences in macrophage phenotype in the absence of the mast cells attempting to initiate an inflammatory response compensating for the lack of mast cells. In addition to this finding, BALF of C57BL/6J mice had increased levels of PGD2, a major lipid mediator abundantly produced by mast cells (Figure 5) (Robinson et al., 1985). In humans, the majority of PGD2 secreted in the lungs can be attributed mostly to mast cells (Arima and Fukuda, 2011; Dahlen and Kumlin, 2004). Although other cells have the ability to produce PGD2 such as macrophages, platelets and certain T-cells, it is reported that the amounts produced by these cells are 100–1000 times lower than those produced when mast cells are activated (Dahlen and Kumlin, 2004). In mouse models of airway constriction, PGD2 has a profound proinflammatory effect (Matsuoka et al., 2000). PGD2 is known for attracting eosinophils, increasing airway hyper reactivity, and causing substantial mucus production (Matsuoka et al., 2000; Peinhaupt et al., 2017). In our study, in conjunction with the upregulation in PGD2 in C57BL/6J mice we also observed an increase in eosinophils that was absent in KitW-sh mice (Figure 3D;Table 1) potentially linking PGD2 to this response. Veterans who have been exposed to SM who had no respiratory issues prior to serving, have reported an increase incidence of COPD and asthma—like pathologies compared with those veterans who have served in areas not in affected by SM (Institute of Medicine (U.S.). Committee on Gulf War and Health: Literature Review of Pesticides and Solvents and Institute of Medicine (U.S.). Board on Health Promotion, 2005). Considering the role of mast cells in disease pathologies such as asthma and COPD, this strengthens the argument that mast cell activation as a result of SM could be contributing to these long-term disease pathologies. Mast cells being one of the major cell sources of PGD2 in lung, has provided us with insight on a potential mechanism that may also be important in SM inhalation and toxicity.
Moreover, our in-depth bioactive lipid mediator analysis of the BALF (Figures 5 and 6; Table S1) not only revealed that PGD2 was upregulated in C57BL/6J, but also linoleic acid metabolites were found to be highly expressed in C57BL/6J mice as compared with controls. Although, we observed trends toward an increase in linoleic acid metabolites in KitW-sh mice following NM, these metabolites did not reach significance as compared with control mice. Although literature defining a role of linoleic acid metabolites in lung inflammation is limited, studies suggest that 9(10) and 12(13)-EpOME are protoxins and are protective, whereas others suggest that these compounds are critical in acute respiratory distress syndrome, cause pulmonary edema, vasodilation, and mitochondrial uncoupling, which similarly experienced by veterans and civilians exposed to SM (Askari et al., 2014; Balgoma et al., 2016; Thompson and Hammock, 2007). Although EpOME effects remain unclear in literature, its metabolites, dihydroxy-octadecenoic acids are known for their immunotoxicity, inducing pro-allergic immune dysfunction by decreasing dendritic cell secretion of IL-10, mitochondrial dysfunction, and is elevated in the BALF of asthmatic patients (Gabbs et al., 2015; Levan et al., 2019). In spite of being present in BALF of asthmatic patients, 12(13) and 9(10)-DiHOME exact function in the disease pathology remains unclear. Our research in conjunction with Lundstrom et al. suggest that activated mast cells produce EpOME and DiHOME and further strengthens our hypothesis (Lundstrom et al., 2013). In our studies, although 12(13)-EpOME is elevated (Figure 6) in both mouse strains after NM exposure, 12(13) and 9(10)-DiHOME are significantly elevated in C57BL/6J mice whereas it is not elevated in KitW-sh mice. These novel in vivo findings further solidify a role for mast cells in initiating inflammation to NM.
Similar to what we found in vivo, our in vitro studies utilizing BMMCs further suggests a pivotal role for mast cells in NM toxicity. Mast cell activation is characterized as early (occurs in seconds to minutes) and/or late phase activation (occurs in hours) (Krystel-Whittemore et al., 2015). Although many compounds are known to activate mast cells leading to early phase activation, our findings demonstrate that NM activates mast cells via late phase activation after 6 h and 24 h through the upregulation and production of PGD2 and IL-6, respectively(Figures 8 and 9). At 24 h, we observed a dose dependent increase in mast cell death at 20–100 μM (Figure 7C) and observe an increase in IL-6 production from 20 μM to 50 μM. Cell death had an impact at 24 h where we observed cells likely releasing granules due to cytotoxicity and not active degranulation (Supplementary Figure 8), but this shouldn’t impact IL-6 production as IL-6 isn’t inherently present in the granules and needs to be synthesized. We show mRNA gene expression changing at earlier timepoints (Figure 9) and then release of IL-6 at 24 h (Figure 10B). At 50 µM we see a decrease in IL-6 compared with 20 µM, although significant compared with the control, this decrease can be attributed to cell death occurring (Figure 10B). This information is critical when studying acute effects of NM in vivo, because the increase in certain mediators can be attributed to mast cell activation and toxicity of NM in the environment. Future studies are needed to determine if immature mast cells begin to replace the resident mast cells and how this plays a role in chronic inflammation seen in individuals who are exposed to SM. An abundance of IL-6 will lead to damage through extracellular matrix deposition, excess mucus production, and mast cell proliferation and activation. Given the persistent inflammation and the toxic nature of NM, it is likely that IL-6 and PGD2 are contributing to the immune response in the respiratory system because mast cells are unable to “switch off” or become inactivated. Our in vitro data corresponds with what was observed in C57BL/6J mice through the upregulation in Il6, Ptgs2, and Tnfα (Figures 4 and 9) as well as the production of PGD2 (Figure 10A). Although we do not know the exact mechanism by which NM is activating mast cells (via receptor activation, oxidative stress or cellular membrane damage) within the lung, further studies are needed to determine the mechanism of action to better identify potential effective mast cell therapeutics. What our in vitro studies do suggest is that NM will directly activate mast cells via late phase activation and the bioactive lipid mediator and proinflammatory cytokines produced could potentially be contributing to the robust inflammation observed in vivo.
There are several chemicals that cause mast cell activation through unknown non-IgE mechanisms such as but not limited to silver nanoparticles, atrazine, and glyphosphate (Redegeld et al., 2018). Mechanisms of mast cell activation exhibited by these environmental chemicals may provide some insight and common pathways by which NM could elicit a non-IgE mast cell response. In addition to previously mentioned chemicals there are therapeutics such as fluoroquinolones and vancomycin that activate mast cells via the Mas-Related G Protein-Coupled Receptor-X2 (MRGPRX2) (Manorak et al., 2018; Subramanian et al., 2016). This receptor has been reported to contribute to multiple drug allergies however nothing is known regarding whether it may contribute to mast cell activation by environmental exposures such as NM.
Due to the toxic nature and various restrictions on SM, we used a viable, less toxic surrogate, NM. Further studies are needed to determine if SM will elucidate the same response as seen in our studies. Although our studies will help identify certain biomarkers of mast cell activation, future studies are needed in GWI veterans and civilians (such as fisherman) who have been exposed to SM to determine if these mast cell activation markers are upregulated in the same manner in the lung. Another major consideration is the unknown potential interactions and exposures such as burn pits that collectively could lead to increased asthma and many other lung diseases that need to be addressed in conjunction with SM exposure in war areas (Institute of Medicine (U.S.). Committee on Gulf War and Health: Literature Review of Pesticides and Solvents and Institute of Medicine (U.S.). Board on Health Promotion, 2005).
In summary, mast cell activation is critical in initiating a robust inflammatory response following NM exposure in both in vivo and in vitro through the release of proinflammatory cytokines and lipid mediators. These findings may contribute to symptoms observed in veterans exposed to SM. In lieu of future studies, these results will help us better understand mechanisms of SM toxicity and will aid in the development of novel prophylactic treatments or therapeutics.
SUPPLEMENTARY DATA
Supplementary data are available at Toxicological Sciences online.
DECLARATION OF CONFLICTING INTERESTS
The authors declared no potential conflicts of interest with respect to the research, authorship, and/or publication of this article.
Supplementary Material
ACKNOWLEDGMENTS
The authors wish to thank the University of Colorado School of Pharmacy, Mass Spectrometry Facility for analyzing samples in particular Jonathan Manke and Mike Armstrong. The authors appreciate the contribution to this research made by E. Erin Smith, HTL (ASCP)CM QIHC; Allison Quador, HTL(ASCP)CM; and Jessica Arnold HTL(ASCP)CM of the University of Colorado Cancer Center Pathology Shared Resource. This resource is supported in part by the Cancer Center Support Grant (P30CA046934). Contents are the author's sole responsibility. The authors would also like to thank Dr. Rebecca McCullough, Paige Anton, Courtney Capper, and Keegan Rogers for assistance in animal necropsy.
FUNDING
This research was supported by the National Institute of Environmental Health Sciences R01 ES019311S1 (J.M.B.) and T32 ES029074 (A.C.H.) grants; and U.S. Army Medical Research Grant W81XWH1810169 (N.T.S.).
REFERENCES
- Agency for Toxic Substances and Disease Registry (ATSDR). (2003). Toxicological profile for Sulfur Mustard. U.S. Department of Health and Human Services, Public Health Service, Atlanta, GA. Available at: https://wwwn.cdc.gov/TSP/ToxProfiles/ToxProfiles.aspx?id=905&tid=184 [PubMed] [Google Scholar]
- Ahmad S., Ahmad A. (2016). Emerging targets for treating sulfur mustard-induced injuries. Ann. N. Y. Acad. Sci. 1374, 123–131. [DOI] [PMC free article] [PubMed] [Google Scholar]
- Anderson D. R., Taylor S. L., Fetterer D. P., Holmes W. W. (2009). Evaluation of protease inhibitors and an antioxidant for treatment of sulfur mustard-induced toxic lung injury. Toxicology 263, 41–46. [DOI] [PubMed] [Google Scholar]
- Arima M., Fukuda T. (2011). Prostaglandin d(2) and t(h)2 inflammation in the pathogenesis of bronchial asthma. Korean J. Intern. Med. 26, 8–18. [DOI] [PMC free article] [PubMed] [Google Scholar]
- Askari A. A., Thomson S., Edin M. L., Lih F. B., Zeldin D. C., Bishop-Bailey D. (2014). Basal and inducible anti-inflammatory epoxygenase activity in endothelial cells. Biochem. Biophys. Res. Commun. 446, 633–637. [DOI] [PMC free article] [PubMed] [Google Scholar]
- Astarita G., Kendall A. C., Dennis E. A., Nicolaou A. (2015). Targeted lipidomic strategies for oxygenated metabolites of polyunsaturated fatty acids. Biochim. Biophys. Acta 1851, 456–468. [DOI] [PMC free article] [PubMed] [Google Scholar]
- Balali-Mood M., Abdollahi M. (1993). Basic and Clinical Toxicology of Mustard Compounds. Springer, Cham. [Google Scholar]
- Balali-Mood M., Hefazi M. (2006). Comparison of early and late toxic effects of sulfur mustard in Iranian veterans. Basic Clin. Pharmacol. Toxicol. 99, 273–282. [DOI] [PubMed] [Google Scholar]
- Balgoma D., Yang M., Sjodin M., Snowden S., Karimi R., Levanen B., Merikallio H., Kaarteenaho R., Palmberg L., Larsson K., et al. (2016). Linoleic acid-derived lipid mediators increase in a female-dominated subphenotype of COPD. Eur. Respir. J. 47, 1645–1656. [DOI] [PubMed] [Google Scholar]
- Brimfield A. A. (2012). Chemicals of military deployments: Revisiting gulf war syndrome in light of new information. Prog. Mol. Biol. Transl. Sci. 112, 209–230. [DOI] [PubMed] [Google Scholar]
- Brown J. M., Swindle E. J., Kushnir-Sukhov N. M., Holian A., Metcalfe D. D. (2007). Silica-directed mast cell activation is enhanced by scavenger receptors. Am. J. Respir. Cell Mol. Biol. 36, 43–52. [DOI] [PMC free article] [PubMed] [Google Scholar]
- Calvet J. H., Feuermann M., Llorente B., Loison F., Harf A., Marano F. (1999). Comparative toxicity of sulfur mustard and nitrogen mustard on tracheal epithelial cells in primary culture. Toxicol. In Vitro 13, 859–866. [DOI] [PubMed] [Google Scholar]
- Centers for Disease and Prevention. (2013). Notes from the field: Exposures to discarded sulfur mustard munitions – mid-Atlantic and New England states 2004-2012. MMWR Morb. Mortal. Wkly. Rep. 62, 315–316. [PMC free article] [PubMed] [Google Scholar]
- Chang Y. C., Soriano M., Hahn R. A., Casillas R. P., Gordon M. K., Laskin J. D., Gerecke D. R. (2018). Expression of cytokines and chemokines in mouse skin treated with sulfur mustard. Toxicol. Appl. Pharmacol. 355, 52–59. [DOI] [PMC free article] [PubMed] [Google Scholar]
- Dahlen S. E., Kumlin M. (2004). Monitoring mast cell activation by prostaglandin d2 in vivo. Thorax 59, 453–455. [DOI] [PMC free article] [PubMed] [Google Scholar]
- Darchini-Maragheh E., Balali-Mood M. (2018). Delayed complications and long-term management of sulfur mustard poisoning: Recent advances by Iranian researchers (part I of II). Iran J. Med. Sci. 43, 103–124. [PMC free article] [PubMed] [Google Scholar]
- Gabbs M., Leng S., Devassy J. G., Monirujjaman M., Aukema H. M. (2015). Advances in our understanding of oxylipins derived from dietary PUFAs. Adv. Nutr. 6, 513–540. [DOI] [PMC free article] [PubMed] [Google Scholar]
- Ghanei M., Adibi I., Farhat F., Aslani J. (2008). Late respiratory effects of sulfur mustard: How is the early symptoms severity involved? Chron. Respir. Dis. 5, 95–100. [DOI] [PubMed] [Google Scholar]
- Goswami D. G., Kant R., Ammar D. A., Kumar D., Enzenauer R. W., Petrash J. M., Tewari-Singh N., Agarwal R. (2019). Acute corneal injury in rabbits following nitrogen mustard ocular exposure. Exp. Mol. Pathol. 110, 104275. [DOI] [PMC free article] [PubMed] [Google Scholar]
- Grimbaldeston M. A., Chen C. C., Piliponsky A. M., Tsai M., Tam S. Y., Galli S. J. (2005). Mast cell-deficient w-sash c-kit mutant kit w-sh/w-sh mice as a model for investigating mast cell biology in vivo. Am. J. Pathol. 167, 835–848. [DOI] [PMC free article] [PubMed] [Google Scholar]
- Gurish M. F., Boyce J. A. (2006). Mast cells: Ontogeny, homing, and recruitment of a unique innate effector cell. J. Allergy Clin. Immunol. 117, 1285–1291. [DOI] [PubMed] [Google Scholar]
- Hsia C. C. W., , HydeD. M., , OchsM., and , Weibel E. R. (2010). An official research policy statement of the American Thoracic Society/European Respiratory Society: standards for quantitative assessment of lung structure. Am. J. Respir. Crit. Care Med. 181, 394–418. [DOI] [PMC free article] [PubMed] [Google Scholar]
- Institute of Medicine (U.S.). Committee on Gulf War and Health: Literature Review of Pesticides and Solvents, Institute of Medicine (U.S.). Board on Health Promotion. (2005). Gulf War and Health. Volume 3, Fuels, Combustion Products, and Propellants. The National Academies Press, Washington, DC.
- Jain A. K., Tewari-Singh N., Inturi S., Orlicky D. J., White C. W., Agarwal R. (2014). Histopathological and immunohistochemical evaluation of nitrogen mustard-induced cutaneous effects in SKH-1 hairless and C57BL/6 mice. Exp. Toxicol. Pathol. 66, 129–138. [DOI] [PMC free article] [PubMed] [Google Scholar]
- Jiang A., Maibach H. (2018). Dermatotoxicology of sulfur mustard: Historical perspectives from World War I. J. Appl. Toxicol. 38, 108–112. [DOI] [PubMed] [Google Scholar]
- Joseph L. B., Composto G. M., Perez R. M., Kim H. D., Casillas R. P., Heindel N. D., Young S. C., Lacey C. J., Saxena J., Guillon C. D., et al. (2018). Sulfur mustard induced mast cell degranulation in mouse skin is inhibited by a novel anti-inflammatory and anticholinergic bifunctional prodrug. Toxicol. Lett. 293, 77–81. [DOI] [PMC free article] [PubMed] [Google Scholar]
- Karlinsky J. B., Blanchard M., Alpern R., Eisen S. A., Kang H., Murphy F. M., Reda D. J. (2004). Late prevalence of respiratory symptoms and pulmonary function abnormalities in Gulf War I veterans. Arch. Intern. Med. 164, 2488–2491. [DOI] [PubMed] [Google Scholar]
- Kehe K., Balszuweit F., Emmler J., Kreppel H., Jochum M., Thiermann H. (2008). Sulfur mustard research–strategies for the development of improved medical therapy. Eplasty 8, e32. [PMC free article] [PubMed] [Google Scholar]
- Korkmaz A., Tan D. X., Reiter R. J. (2008). Acute and delayed sulfur mustard toxicity; novel mechanisms and future studies. Interdiscip. Toxicol. 1, 22–26. [DOI] [PMC free article] [PubMed] [Google Scholar]
- Krystel-Whittemore M., Dileepan K. N., Wood J. G. (2015). Mast cell: A multi-functional master cell. Front. Immunol. 6, 620. [DOI] [PMC free article] [PubMed] [Google Scholar]
- Levan S. R., Stamnes K. A., Lin D. L., Panzer A. R., Fukui E., McCauley K., Fujimura K. E., McKean M., Ownby D. R., Zoratti E. M., et al. (2019). Elevated faecal 12,13-dihome concentration in neonates at high risk for asthma is produced by gut bacteria and impedes immune tolerance. Nat. Microbiol. 4, 1851–1861. [DOI] [PMC free article] [PubMed] [Google Scholar]
- Levels SoAEG. (2002). Acute Exposure Guideline Levels for Selected Airborne Chemicals: Volume 3. National Academies Press, Washington, DC. [PubMed] [Google Scholar]
- Lundstrom S. L., Saluja R., Adner M., Haeggstrom J. Z., Nilsson G., Wheelock C. E. (2013). Lipid mediator metabolic profiling demonstrates differences in eicosanoid patterns in two phenotypically distinct mast cell populations. J. Lipid Res. 54, 116–126. [DOI] [PMC free article] [PubMed] [Google Scholar]
- Malaviya R., Abramova E. V., Rancourt R. C., Sunil V. R., Napierala M., Weinstock D., Croutch C. R., Roseman J., Tuttle R., Peters E., et al. (2020). Progressive lung injury, inflammation, and fibrosis in rats following inhalation of sulfur mustard. Toxicol. Sci. 178, 358–374. [DOI] [PMC free article] [PubMed] [Google Scholar]
- Malaviya R., Sunil V. R., Venosa A., Verissimo V. L., Cervelli J. A., Vayas K. N., Hall L., Laskin J. D., Laskin D. L. (2015). Attenuation of nitrogen mustard-induced pulmonary injury and fibrosis by anti-tumor necrosis factor-alpha antibody. Toxicol. Sci. 148, 71–88. [DOI] [PMC free article] [PubMed] [Google Scholar]
- Manorak W., Idahosa C., Gupta K., Roy S., Panettieri R. Jr.,, Ali H. (2018). Upregulation of mas-related g protein coupled receptor x2 in asthmatic lung mast cells and its activation by the novel neuropeptide hemokinin-1. Respir. Res. 19, 1. [DOI] [PMC free article] [PubMed] [Google Scholar]
- Matsuoka T., Hirata M., Tanaka H., Takahashi Y., Murata T., Kabashima K., Sugimoto Y., Kobayashi T., Ushikubi F., Aze Y., et al. (2000). Prostaglandin d2 as a mediator of allergic asthma. Science 287, 2013–2017. [DOI] [PubMed] [Google Scholar]
- Matute-Bello G., , DowneyG., , MooreB. B., , GroshongS. D., , MatthayM. A., , SlutskyA. S., and , Kuebler W. M. (2011). An official American Thoracic Society workshop report: features and measurements of experimental acute lung injury in animals. Am. J. Respir. Cell Mol. Biol. 44, 725–738. [DOI] [PMC free article] [PubMed] [Google Scholar]
- McGraw M. D., Dysart M. M., Hendry-Hofer T. B., Houin P. R., Rioux J. S., Garlick R. B., Loader J. E., Smith R., Paradiso D. C., Holmes W. W., et al. (2018). Bronchiolitis obliterans and pulmonary fibrosis after sulfur mustard inhalation in rats. Am. J. Respir. Cell Mol. Biol. 58, 696–705. [DOI] [PMC free article] [PubMed] [Google Scholar]
- Mishra N. C., Rir-sima-ah J., Grotendorst G. R., Langley R. J., Singh S. P., Gundavarapu S., Weber W. M., Pena-Philippides J. C., Duncan M. R., Sopori M. L. (2012). Inhalation of sulfur mustard causes long-term t cell-dependent inflammation: Possible role of th17 cells in chronic lung pathology. Int. Immunopharmacol. 13, 101–108. [DOI] [PMC free article] [PubMed] [Google Scholar]
- Nokhodian Z., ZareFarashbandi F., Shoaei P. (2015). Mustard gas exposure in Iran-Iraq War – A scientometric study. J. Educ. Health Promot. 4, 56. [DOI] [PMC free article] [PubMed] [Google Scholar]
- Pearson G. S. (1993). Veterans at risk – The health-effects of mustard gas and Lewisite – Pechura, CM, Rall, DP. Nature 365, 218–218. [DOI] [PubMed] [Google Scholar]
- Peinhaupt M., Sturm E. M., Heinemann A. (2017). Prostaglandins and their receptors in eosinophil function and as therapeutic targets. Front. Med. 4, 104. [DOI] [PMC free article] [PubMed] [Google Scholar]
- Redegeld F. A., Yu Y., Kumari S., Charles N., Blank U. (2018). Non-IgE mediated mast cell activation. Immunol. Rev. 282, 87–113. [DOI] [PubMed] [Google Scholar]
- Robinson C., Hardy C. C., Holgate S. T. (1985). Pulmonary synthesis, release, and metabolism of prostaglandins. J. Allergy Clin. Immunol. 76, 265–271. [DOI] [PubMed] [Google Scholar]
- Sabourin C. L., Petrali J. P., Casillas R. P. (2000). Alterations in inflammatory cytokine gene expression in sulfur mustard-exposed mouse skin. J. Biochem. Mol. Toxicol. 14, 291–302. [DOI] [PubMed] [Google Scholar]
- Sezigen S., Eyison R. K., Ortatatli M., Kilic E., Kenar L. (2020). Myelosuppression and acute hematological complications of sulfur mustard exposure in victims of chemical terrorism. Toxicol. Lett. 318, 92–98. [DOI] [PubMed] [Google Scholar]
- Shakarjian M. P., Heck D. E., Gray J. P., Sinko P. J., Gordon M. K., Casillas R. P., Heindel N. D., Gerecke D. R., Laskin D. L., Laskin J. D. (2010). Mechanisms mediating the vesicant actions of sulfur mustard after cutaneous exposure. Toxicol. Sci. 114, 5–19. [DOI] [PMC free article] [PubMed] [Google Scholar]
- Subramanian H., Gupta K., Ali H. (2016). Roles of mas-related g protein-coupled receptor x2 on mast cell-mediated host defense, pseudoallergic drug reactions, and chronic inflammatory diseases. J. Allergy Clin. Immunol. 138, 700–710. [DOI] [PMC free article] [PubMed] [Google Scholar]
- Sunil V. R., Patel K. J., Shen J., Reimer D., Gow A. J., Laskin J. D., Laskin D. L. (2011). Functional and inflammatory alterations in the lung following exposure of rats to nitrogen mustard. Toxicol. Appl. Pharmacol. 250, 10–18. [DOI] [PMC free article] [PubMed] [Google Scholar]
- Sunil V. R., Vayas K. N., Cervelli J. A., Malaviya R., Hall L., Massa C. B., Gow A. J., Laskin J. D., Laskin D. L. (2014). Pentoxifylline attenuates nitrogen mustard-induced acute lung injury, oxidative stress and inflammation. Exp. Mol. Pathol. 97, 89–98. [DOI] [PMC free article] [PubMed] [Google Scholar]
- Szinicz L. (2005). History of chemical and biological warfare agents. Toxicology 214, 167–181. [DOI] [PubMed] [Google Scholar]
- Thompson D. A., Hammock B. D. (2007). Dihydroxyoctadecamonoenoate esters inhibit the neutrophil respiratory burst. J. Biosci. 32, 279–291. [DOI] [PMC free article] [PubMed] [Google Scholar]
- Veress L. A., Hendry-Hofer T. B., Loader J. E., Rioux J. S., Garlick R. B., White C. W. (2013). Tissue plasminogen activator prevents mortality from sulfur mustard analog-induced airway obstruction. Am J Respir Cell Mol Biol 48, 439–447. [DOI] [PMC free article] [PubMed] [Google Scholar]
- Weinberger B., Laskin J. D., Sunil V. R., Sinko P. J., Heck D. E., Laskin D. L. (2011). Sulfur mustard-induced pulmonary injury: Therapeutic approaches to mitigating toxicity. Pulm Pharmacol. Ther. 24, 92–99. [DOI] [PMC free article] [PubMed] [Google Scholar]
- Wolfe G. A., Petteys S. M., Phelps J. F., Wasmund J. B., Plackett T. P. (2019). Sulfur mustard exposure: Review of acute, subacute, and long-term effects and their management. J. Spec. Oper. Med. 19, 81–86. [DOI] [PubMed] [Google Scholar]
Associated Data
This section collects any data citations, data availability statements, or supplementary materials included in this article.