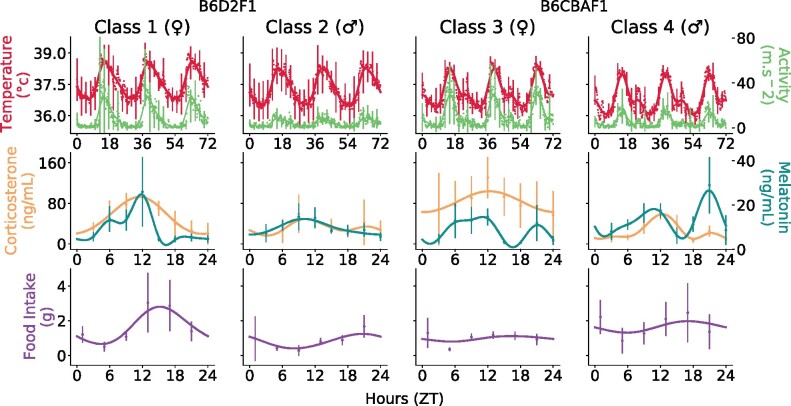
Fig. 1.
Circadian biomarkers in four mouse classes. Raw data are represented with dots (average) and error bars (standard deviations). For the sake of readability, error bars were only displayed every 2.5 h for the first line. Solid lines stand for the mean function obtained by fitting a Gaussian Process

