

Abstract
Leguminous plants ‘fix’ atmospheric nitrogen through complex symbiotic relationships with rhizobial soil bacteria. These plants play a key role in agricultural sustainability because, unlike other major crops (e.g., corn, wheat and rice), they require no expensive and environmentally deleterious fertilizer. Much like the fundamental and unique insights obtained from the study of plant pathogens, research on symbiotic bacteria and their host plants is providing new mechanistic information on plant growth and development. In this resource we describe a large-scale, quantitative proteomic study, which includes key post-translational modifications, to establish the first global proteomic blueprint of a legume and its rhizobial endosymbiont. By quantifying over 23,000 proteins, 26,000 phosphorylation sites, and 600 acetylation sites, our studies reveal changes in protein expression and modification not evident from DNA- or RNA-based work. Our results illuminate two distinct stages in the symbiotic relationship and highlight elements of translational and post-translational controls not previously known.
Introduction
As the world population grows, agronomic studies focused on the improvement and stabilization of crop plants become vital to meet the global demand for feed, food, fiber, and fuel. Current research is therefore driven not only to improve nutrient content and pathogenic resistance within crop species, but also to decrease the need for economically and environmentally damaging nitrogenous fertilizers. Leguminous plants play a key role in agricultural sustainability, as their large-scale cultivation does not require the application of fertilizers. Instead, these crops endogenously produce nitrogen by initiating and maintaining symbiotic relationships with soil bacteria collectively termed as rhizobia. Understanding the unique molecular mechanisms that permit legumes to host symbionts for nitrogen fixation is important for both basic plant biology and for future efforts aimed at genetically integrating these capabilities into other major crops, such as corn, wheat, and rice.
Rhizobia are common soil-dwelling, legume endosymbionts that can express nitrogenase, an enzyme that catalyzes the conversion of atmospheric nitrogen into ammonia. Nitrogen fixation occurs within specialized plant organs called nodules that develop from the host root cells by a complex, carefully orchestrated process of cellular differentiation, following rhizobial infection (Timmers, et al., 1999; Xiao, et al., 2014). Rhizobial bacteria residing within the nodules interact with plant-derived host factors that induce terminal differentiation of the bacteria into nitrogen-fixing bacteroids (Gibson, et al., 2008; Mergaert, et al., 2003; Vasse, et al., 1990; Lauressergues, et al., 2015). Here the bacteroids generate and transfer nitrogen to the plant and, in turn, receive photosynthetically-derived carbohydrates, which serve as their primary source of carbon and energy (Oldroyd, et al., 2011; Van de Velde, et al., 2006). Because Medicago truncatula is one of the few leguminous species that has a small stature and short life cycle – similar to Arabidopsis thaliana – this process is most readily studied using this model legume, in conjunction with its endosymbiotic bacterial species, Sinorhizobium meliloti.
Over the past two decades, many studies have investigated the cellular processes and mechanisms that underlie the initiation, progression, and continuation of symbiosis (Limpens, et al., 2013; Maunoury, et al., 2010; Lohar, et al., 2006; El Yahyaoui, et al., 2004; Grimsrud, et al., 2010; Rose, et al., 2012; Rose, et al., 2012; Volkening, et al., 2012; Clarke, et al., 2015; Durgo, et al., 2015). A genome-wide transcriptome analysis was recently conducted to evaluate organ-specific gene expression, especially during seed and nodule development in M. truncatula (Benedito, et al., 2008). Further, the first draft of a complete genomic sequence for M. truncatula was also reported, allowing for considerably improved gene annotation (Young, et al., 2011). We reasoned that by leveraging these resources, along with recent improvements in the quality and throughput of mass spectrometric analysis (Senko, et al., 2013; Hebert, et al., 2014), we could generate a comprehensive, organ-specific compendium of protein expression in M. truncatula. Protein analysis is especially insightful as it can reveal spatial, temporal, and post-translational regulation not evident in RNA and DNA studies. We apply recent advancements in high resolution mass spectrometry and chromatography to generate the largest plant proteomic analysis yet reported. Specifically, we provide evidence for 23,013 proteins (19,679 from the eukaryotic host plant, M. truncatula; 3,334 from the prokaryotic endosymbiotic bacteria, S. meliloti) along with 26,468 sites of phosphorylation and 617 sites of acetylation. This resource, which we term the Wisconsin Medicago Group (WMG) Protein Compendium, is the most holistic plant protein compilation to date and is commensurate with the scope and scale of the largest studies in mammalian systems.
Here we describe the methods and techniques used to compile this resource, present an organ-specific proteome and post-translational modification (PTM) atlas (i.e., the WMG Protein Compendium), and demonstrate bioinformatic approaches that exploit the spatial and temporal data it contains. First, we reveal a core M. truncatula proteome (i.e., expressed in all organs); intriguingly, a subset of this core is post-translationally regulated in an organ-specific way. Second, using protein and PTM expression data we define organ-specific processes and functions. Third, by integration of transcriptomic and proteomic data we infer co-expression and co-regulation to generate a novel symbiosis-specific regulatory network. With this network we describe several candidate master regulators of symbiosis. Fourth, employing our nodule time-course data we identify putative stages of host-factor expression and their endosymbiont targets.
Results
A protein and post-translational modification atlas of Medicago truncatula and its endosymbiont Sinorhizobium meliloti
To compile a comprehensive proteome profile of M. truncatula we harvested plants and dissected them into seven major organs: flower, apical meristem (bud), leaf, stem, root, seed, and nodule (Figure 1A). S. meliloti, found within the symbiosome in M. truncatula nodules, differentiates from free living bacteria into organelle-like bacteroids; to capture protein expression profiles of both organisms during this transition, we separately collected nodule samples at 10, 14, and 28 days post-rhizobial inoculation. An overview of our proteomic analysis, which uses mass spectrometry to analyze complex mixtures of tryptic peptides, is presented in Figure 1B. To ensure deep proteomic coverage, the peptides were pre-fractionated using either strong cation exchange or high pH reverse-phase chromatography and then each fraction was analyzed by capillary liquid chromatography coupled with high resolution tandem mass spectrometry (nHPLC-MS/MS). In total we performed 216 nHPLC-MS/MS experiments from which 10,322,254 MS/MS spectra were generated. Next, we constructed a non-redundant consensus protein sequence database comprising both known and novel gene models for M. truncatula. To permit the detection of proteins originating from rhizobial bacteria, we concatenated the S. meliloti UniProt database to form a single, all-inclusive database and used this database to correlate 2,565,645 MS/MS spectra with peptide sequence (1% false discovery rate, FDR). From these data we provide evidence for 23,013 proteins, comprising 19,679 M. truncatula and 3,334 S. meliloti proteins (Figure S1A). Of the 19,679 M. truncatula proteins, 16,889 could unambiguously be mapped to 15,813 genes.
Figure 1. Experimental design and workflow utilized to generate the WMG Protein Compendium.
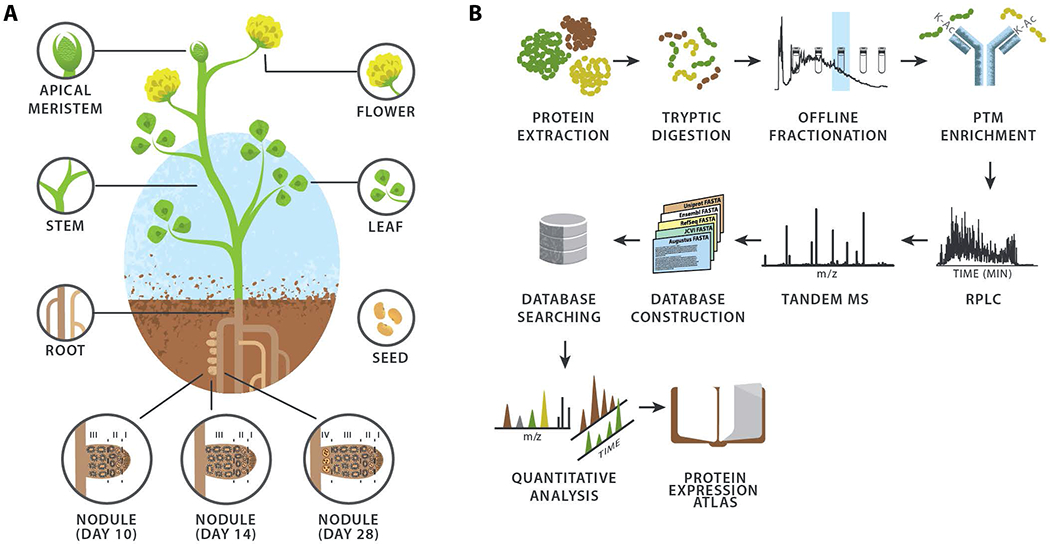
(A) The plant tissues and nodule infection time points analyzed. (B) Proteomic workflow employed for the identification and quantification of proteins within the various M. truncatula tissues.
Protein post-translational modification is a pervasive form of cell signaling that orchestrates numerous processes and provides a rapid and largely reversible means to modulate protein activity and transduce signals. Protein phosphorylation and acetylation are among the most important PTMs and, accordingly, we used affinity enrichment technologies to globally profile these sub-stoichiometric modifications. Altogether we detected 26,468 sites of phosphorylation, 21,567 of which can be localized with single amino acid resolution, and 617 sites of acetylation (localization probability > 0.75). The distribution of identified phosphorylation sites - 86.2% pSer, 13.2% pThr, and 0.6% pTyr - is consistent with those previously observed in Mus musculus, Homo sapiens, Zea mays, A. thaliana and M. truncatula. This WMG Protein Compendium is freely available at www.medicago.wisc.edu/compendium/.
Medicago truncatula genome annotation
To connect tandem mass spectra with peptide sequence, MS-based proteomics relies upon protein sequence databases. These databases are typically constructed from high quality genome assemblies using gene prediction algorithms. For very well-studied organisms, e.g., yeast, mice, and humans, high quality genome assemblies have been available for several years resulting in protein sequence databases that are extensively curated, both manually and automatically. For example, UniProt - the gold standard protein sequence database – describes 20,206 (42,127 including proteoforms) experimentally verified human proteins and 125,686 predicted human proteoforms. For M. truncatula, however, UniProt contains only 63 manually verified proteins and predicts 69,658 proteoforms. This considerable imbalance retards research involving this model organism and is a key issue this report aims to address.
Several consortia have used a variety of gene prediction algorithms to structurally annotate a newly published M. truncatula genome assembly (i.e., RefSeq, UniProt, JCVI, and Ensembl). To enable our proteome analysis, we compiled all non-redundant proteins (Marx, et al., 2013) from these four sources (80,536 entries) and then used the gene prediction tool Augustus to supplement these known gene models with an additional 24,744 predictions (the WMG database, www.medicago.wisc.edu/compendium/). We hypothesized that by complementing the existing protein sequence database with Augustus de novo gene predictions we would generate a more comprehensive theoretical proteome from which to leverage our MS data. Excluding gene predictions with annotated orthologs in other plants (BLAST, UniProt Plants - 2015.03.20, E-value < 10−5, sequence identity ≥ 50%), we identified 324 novel M. truncatula genes/proteins having 175 phosphorylation and 5 acetylation sites. Peptides matching to gene predictions are both intra- and inter-genic, i.e., these peptides either help to correct known, or identify novel, gene models. Further, our consensus database enabled us to identify 3.9% - 33.7% (JCVI and RefSeq) more proteins than searching any individual publically available database alone. Since gene prediction in bacteria is more straightforward, we searched against the UniProt S. meliloti protein database (strain BL225C); with MS detection of over half of all predicted genes (3,334 of 6,308), our study provides the first reported experimental protein evidence for this organism.
Organ-specific, functional proteome annotation of Medicago truncatula
A primary goal of our deep proteomic analysis of M. truncatula is to investigate both temporal and spatial protein expression and post-translation modification. To do this we first plotted the proteome of each organ and then determined organ localization specificity by testing whether MS/MS evidence for a given identified protein in one organ could be found in each of the others (Figure 2A). While each organ expresses over 9,000 proteins, we discovered a core M. truncatula proteome that comprises 5,701 proteins (40.1 - 60.7%). Our protein expression findings are consistent with published transcript abundance measurements that found 42% (Benedito, et al., 2008) of all expressed genes were detected in each organ. Using gene ontology analysis we determined that this ‘core’ proteome is significantly enriched for proteins involved in protein folding, protein transport, glycolytic process, gluconeogenesis and translation (FDR q < 0.01, Fisher’s exact test), pervasive and crucial biological processes that are conserved and utilized throughout the plant (Figure 2C). To improve our ability to identify organ-specific biological processes, we conducted an additional gene ontology analysis after removal of the core proteome (Figure 2C). This analysis both confirms expected biology and provides unanticipated insight. For instance, proteins driving nodule morphogenesis (late nodulation) are considerably over-represented in the nodules and proteins with peroxidase activity in roots are indicative of a defense or symbiosis related function (FDR q < 0.01, Fisher’s exact test). Further, our results illustrate the importance of cell wall metabolism in root, stem, and flower organs, represented by enzymes in lignin and cell wall modifications such as pectinesterases, glucosidases, and xyloglucan endotransglucosylases. These enzymes target and soften lignified organ, thereby allowing cell wall modifications (Pauly & Keegstra, 2008).
Figure 2. Deep proteome sequencing reveals the tissue-specific localization and relative abundance of proteins expressed in Medicago truncatula.
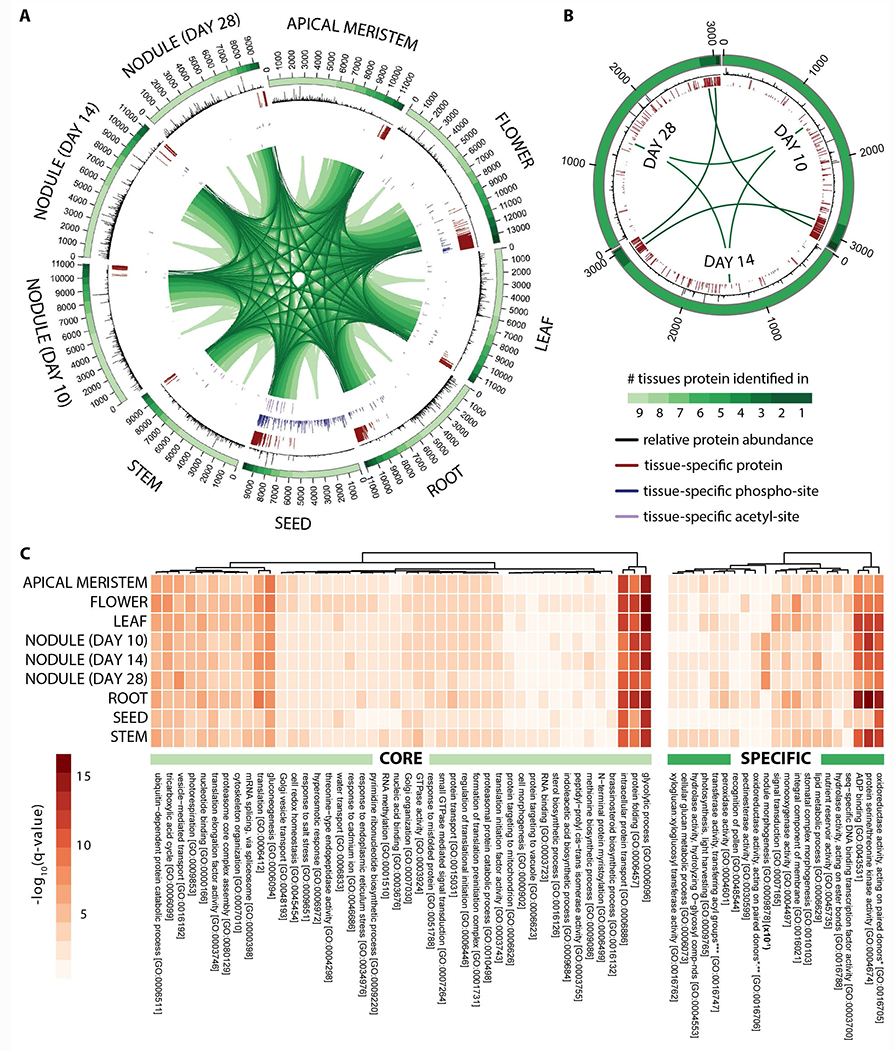
Circular proteome maps depict the similarities and differences in the tissue-specific proteomes acquired following proteome analysis of (A) nine different M. truncatula tissues (apical meristem (bud), flower, leaf, root, seed, stem, and nodules 10, 14, and 28 days past infection) and (B) nodule rhizobia (10, 14, and 28 days past infection). The number of protein identifications associated with each tissue is displayed in the bars that span each distinct tissue region. The color gradient within these bars reflects the number of tissues each protein identification is associated with (i.e., those proteins represented by the lightest green region were found within every tissue whereas those represented by the darkest green region were uniquely identified in that given tissue). The relative abundance of each protein within a given tissue is represented by the histograms (black) that span the length of each identification bar. Tissue-specific proteins, phosphorylation-sites, and acetylation-sites are indicated by the red, blue, and purple bars, respectively. Note that the length of each bar reflects the tissue-specificity of each protein or PTM site (longer bars represent a greater degree of specificity). (C) Heatmaps illustrate the most significantly enriched gene ontology biological processes carried out by the core (left) and specific (right) proteins within each tissue. Note that the nodule morphogenesis q-values displayed have been 10x reduced in this figure.
*with incorporation or reduction of molecular oxygen
**2–oxoglutarate as one donor, and incorporation of one atom each of oxygen into both donors
*** other than amino–acyl groups
To determine the relative abundances of each protein across the various organs we quantified the MS signal for each identified peptide across all nHPLC-MS/MS experiments (label-free quantification, LFQ) and additionally performed multiplex tandem mass tag (TMT) experiments in triplicates for eight of the nine organs. With this approach we augmented our WMG Protein Compendium with protein expression profiles. A bird’s-eye view of global protein expression is illustrated in Figure 2A; from this perspective it is evident that the core M. truncatula proteome is highly expressed relative to organ-specific proteins. In fact, while the core proteome represents roughly half of all proteins in a given organ, it accounts for 80.3% of the total protein abundance (p = 3.076−08, Student’s t-test).
We next assessed organ proteome similarity by correlating protein expression and, by doing so, revealed three main groups: aerial organs (flower, meristem, leaf, and stem), subterraneous organs (roots and nodules), and seeds (Figure S1B). We conclude that the protein expression profiles of the M. truncatula core proteome, and their associated regulatory mechanisms, are similar from one organ to the next. This analysis exploits the global similarities of the proteome; however, we also sought to determine the organ-specificity for each protein. Using the LFQ approach we next annotated the WMG Protein Compendium with organ-specificity information. Shannon entropy was utilized to calculate an organ-specificity index for each protein and all detected sites of phosphorylation and acetylation. A global view of these results are displayed in Figure 2A. To identify gene products that are expressed in only a single organ we plotted proteins by their entropy index and applied a tenth percentile cutoff (Figure S1C). From this data we conclude that 1,683 M. truncatula proteins are expressed in a single organ. Figure S1D plots the distribution of these single organ proteins, revealing the flower as having the most specialized proteome. Within the flower, auxin-associated proteins were highly abundant (e.g., Medtr1g070830), and one of the 13 plasma membrane H+ ATPases that work with the auxin signaling pathway to coordinate organogenesis (Li, et al., 2005) was particularly abundant in this organ (MtAHA13, Medtr2g104860.1) (Nguyen, et al., 2015). The ortholog for this protein in Arabidopsis, H+ ATPase 9 (AHA9), is found primarily in the anthers and it is hypothesized to be involved in late stages of pollen development (Bock, et al., 2006). We also note that genes whose products are either uncharacterized or novel show an increased organ specificity as compared to their better-studied, ubiquitous counterparts in flower, seed and ten day nodules (Figure S1C).
To examine how clusters of proteins with similar organ-specificity and expression profiles may facilitate particular biological processes and/or functional roles we performed an ANOVA analysis (FDR q < 0.01) followed by gene ontology enrichment (FDR q < 0.01, Fisher’s exact test). The results of this analysis generated twelve well-defined groups of proteins that are implicated in 30 distinct biological processes (Figure 3A, Figure S3A, Table S1). In roots, for example, we identified proteins related to defense response, response to biotic stimulus and oxidative stress (clusters Pr9 and Pr11). This is consistent with roots being a zone of interaction with many soil microbes that are either beneficial or pathogenic. Enhanced Disease Susceptibility (EDS; Medtr3g079340.1) proteins are abundant in the roots and are associated with regulating the expression of R-genes encoding proteins that are part of the plant defense mechanisms (Moreau, et al., 2012). Further, Pto kinase interactors (Medtr1g086230.1), which are required to activate the response to oxidative stress by interacting with oxidative signal-inducible (OXI) and mitogen-activated protein (MAP) kinases, were likewise detected (Forzani, et al., 2011). Finally, a MAP3K-like protein (Medtr5g017090.1) known to induce defense responses in A. thaliana, was highly expressed in M. truncatula roots (Rodriguez, et al., 2010).
Figure 3. Protein localization and post-translational modification dictate organ-specific processes.
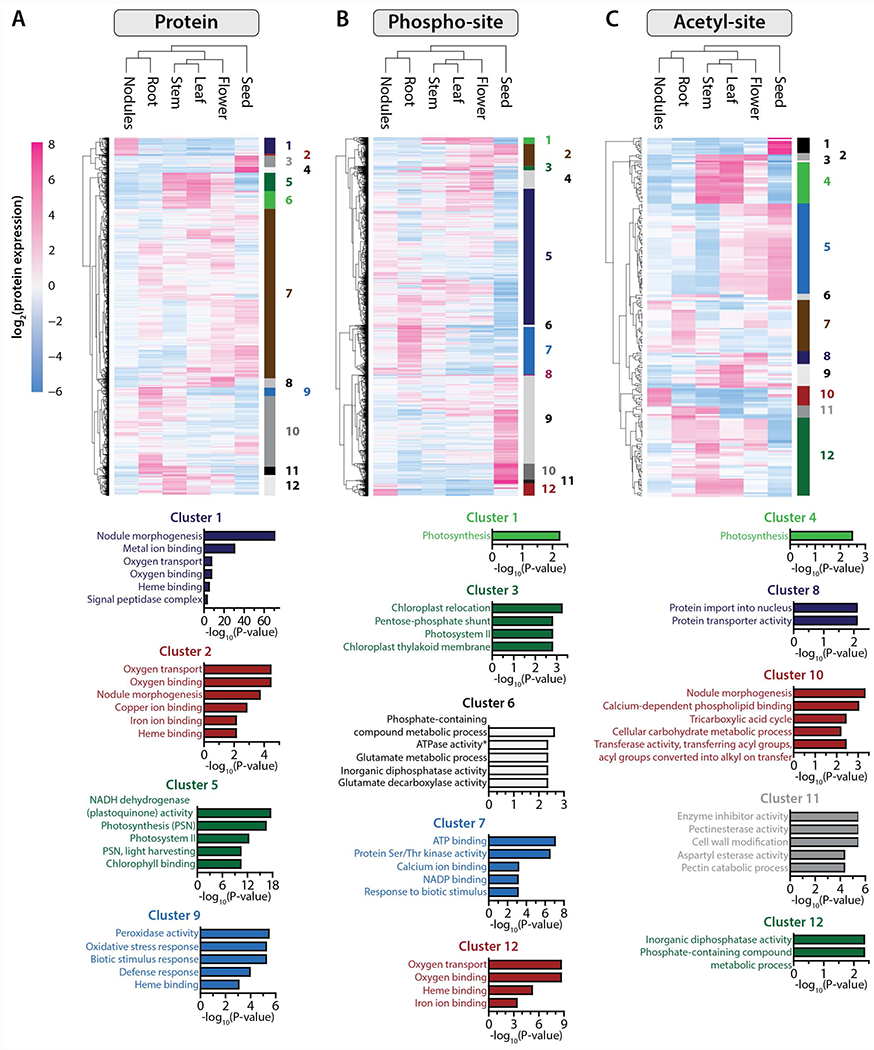
Heatmaps are composed of all proteins (A) phospho-isoforms (B) and acetyl-isoforms (C) found to be significantly changing (ANOVA, q < 0.01) between the six different tissues included in this study (n = 4,765, n= 11,101 and n = 234, respectively). Expression data were grouped using hierarchical clustering (Euclidean distance metric), both on the protein/PTM-isoform level (rows) and on the sample level (tissue). For each dataset, proteins/PTM-isoforms were grouped into twelve clusters, each of which were subjected to gene ontology (GO) functional annotation. The bar plots below each heatmap illustrate the top GO terms significantly enriched within select clusters (p-values associated with each cluster have been corrected for multiple hypotheses and are shown on the x-axes).
Several transport proteins were only detected in M. truncatula roots. Aquaporins, core members of major intrinsic proteins (MIP) family that facilitate water transport in plants, are one such example and comprise a large fraction of the membrane proteome. Water flux is particularly important in plants since they are sessile and, thus, turgor and hydraulics play fundamental roles in many plant functions, including organ shape and tropisms, in place of the animal muscle-mediated movement. The rapid trap closing action of carnivorous plants and of guard cells surrounding stomata of leaves are obvious examples where turgor-mediated events occur, but essentially all cell elongation and structural aspects of the plant rely on water fluxes. One tonoplast essential protein (TIP: Medtr5g012810.1) and two plasma membrane intrinsic proteins (PIP: Medtr4g059390.1; Medtr2g094270.1) belonging to the MIP superfamily were identified in roots. Five members of another major family of plant transporters, the ATP-binding cassette (ABC) proteins, were specifically detected in M. truncatula roots (Medtr2g102670.1; Medtr8g014360.1; Medtr1g086080.1; Medtr4g011630.1 and Medtr3g437870.1). ABC transporters represent another wide, diverse and ubiquitous family of membrane-bound proteins (Andolfo, et al., 2015; Kang, et al., 2011). In plants, these proteins are involved in several processes including transport of various molecules, such as hormones, heavy metals or secondary metabolites (Geisler & Murphy, 2006; Yazaki, 2006). These observations from our root-specific dataset support our understanding that plants must maintain active water and nutrient fluxes by employing several membrane transport systems to ensure their constant nutrition in various environmental conditions.
As expected, all of the aerial organs (i.e., leaf, stem, flower) are enriched for proteins that are specific to photosynthesis (Figure 3A, cluster Pr5) and chloroplast metabolism in M. truncatula. Metalloproteases FtsH, chloroplastic tRNA ligases, and several caseinolytic proteases (ClpPs) were the most abundant. Metalloproteases FtsH (Medtr4g094662.1, Medtr2g438140.2 and Medtr7g010800.1) are crucial for thylakoid membrane biogenesis, and mutants of this gene family display diverse chlorotic phenotypes in Arabidopsis leaves (Var2 mutant) (Chen, et al., 2000). Several tRNA ligases (Phenylalanyl-tRNA ligase: Medtr7g083030.1 and Glycyl-tRNA ligase: Medtr3g006730.2) are specific to chloroplasts and mitochondria and are important for translation in these organelles (Uwer, et al., 1998). Caseinolytic proteases (ClpPs) are involved in plastid protein synthesis, folding, and quality control (Sj{\”{o}}gren, et al., 2006). These examples demonstrate the potential of the WMG Protein Compendium for enabling a broad spectrum of research within the plant organelle community.
Finally, our results demonstrate that nodules are significantly enriched for nodule-specific proteins (Figure 3A, clusters Pr1 and Pr2) involved in oxygen binding and transport. The bacteroid nitrogenase enzyme responsible for the conversion of atmospheric nitrogen to ammonia is extremely oxygen-sensitive; therefore, regulation of oxygen within the symbiosome is crucial to nitrogen fixation. Oxygen levels are tightly regulated by metal-binding proteins called leghemoglobin, which we detect as nodule-specific and highly expressed (10 of 17 detected) (Ott, et al., 2005; Dixon & Kahn, 2004). Further, we identified thirteen sites of phosphorylation on these proteins, of which six are conserved in the related legume, Lotus japonicus. One of these, S45 of LB120B, regulates oxygen binding in L. japonicus and we posit that it plays a similar role in M. truncatula.
The M. truncatula proteome is post-translationally regulated in an organ-specific manner
Protein post-translational modification is ubiquitous across the tree of life and is a key regulatory mechanism for myriad processes, such as cell signaling. This covalent change in specific amino acid side chains of specific proteins helps orchestrate these processes and provides a rapid and largely reversible means to modulate catalytic activity, degradation, and signal transduction. By use of variance and gene ontology analysis, we next asked how phosphorylation and acetylation differ between organs. We surmised that such an analysis would implicate the biological processes that are under post-transcriptional regulation in each organ (Figure 3B and C, Figure S3B and C). Interestingly, phosphorylation and acetylation play a role in photosynthetic processes in both the leaf and stem (Figure 3B, clusters Ph1, Ph3, and Ac4, FDR q < 0.01, ANOVA). Our analysis also suggests that both PTMs play an important role in regulating translational events in the seed (Table S2, Table S3). As expected, seeds strongly expressed several storage proteins. Legumins (e.g., Medtr7g096990.1) and oleosins (e.g., Medtr7g033775.1) were particularly abundant in this organ. Our study complements previous observations that these specific proteins are phosphorylated and acetylated (Gallardo, et al., 2003).
Several proteins displayed organ-specific post-translational modification, highlighting the potential biological importance of their organ-specific regulation (Figure 2A). From these data we conclude that PTM analyses constitutes an excellent approach to find candidate proteins that are involved in specific biological processes. Flower development, for example, is mediated and regulated by the localized action of the phytohormone auxin (Robert, et al., 2015). Auxin is required for several steps of flower development, such as pollen maturation, gynoecium morphogenesis, and tepal senescence (Cecchetti, et al., 2008; Hawkins & Liu, 2014; Lombardi, et al., 2015). In contrast to the earlier observation that there are flower specific changes in auxin related proteins, surprisingly, our dataset contains no flower-specific auxin-related phosphoproteins, meaning that such proteins were also present in at least one more organ. We note, however, that seven proteins, including two auxin carriers, both critical for the gravitropic and phototropic response, were specifically phosphorylated in M. truncatula flowers. These include the auxin efflux carriers, MtPIN1 (Medtr4g084870.1) and MtPIN4 (Medtr6g069510.1). Although the transcripts for two efflux carriers were found in both shoot and roots of M. truncatula (Schnabel & Frugoli, 2004), our analysis revealed flower-specific phosphorylation of the corresponding PIN proteins. Moreover, an enrichment of GO terms related to substrate-specific transmembrane transporter proteins (GO:0022891) that include auxin carriers was observed in flowers. Phospho-isoforms of two Small auxin-up RNA-like proteins (SAUR) were also identified. To our knowledge, some Arabidopsis SAUR proteins were involved in flower development, but their phosphorylation has not yet been described (Chae, et al., 2012). For the first time in M. truncatula, we also report the flower-specific phosphorylation of the auxin response factor MtARF13 (Medtr4g124900.1) and the AUX/IAA transcriptional repressor MtIAA15 (Medtr8g014520.1) (Shen, et al., 2015; Shen, et al., 2014). Interestingly, no Arabidopsis orthologs were found for an auxin-regulated protein phosphorylated in flowers (Medtr2g084275.1), suggesting a putative novel class of proteins involved in the auxin response pathway. Altogether, these observations suggest that the post-translational modification of proteins involved in the movement and transduction pathways for the plant hormone, auxin, is important for specific processes in flowers, a conclusion that cannot be derived from transcriptome analyses.
Plant roots provide the sole means of obtaining inorganic mineral nutrients, such as phosphate and potassium, from soil. Our analysis revealed that seventeen transport proteins were specifically present in M. truncatula roots and eleven of them were specifically phosphorylated in this organ. However, forty-one transport proteins that were not specific for any one organ were also found exclusively phosphorylated in roots. As mentioned previously, aquaporins belong to the MIP family of transporters and their activity is highly regulated by phosphorylation in various plants (Azad, et al., 2008; Maurel, et al., 1995; Van Wilder, et al., 2008; Verdoucq, et al., 2014). Eight M. truncatula MIPs were found specifically phosphorylated in roots. However, only three of them were root-specific including MtPIP2;1 (Medtr2g094270.1) whose transcripts are induced during arbuscular mycorrhizal association (Uehlein, et al., 2007). The other M. truncatula proteins detected belong to PIP, TIP and NIP sub-families, and their functions are not yet known. Interestingly, the phosphorylation of core proteins related to water deprivation response (GO:0009414) were significantly upregulated in roots, corroborating the importance of post-translational regulation of proteins related to water acquisition and transport.
Another example of organ-specific phosphorylation involves the ABC transporter family. Altogether seventeen ABC transporters were detected, only four of which were expressed solely in the root. That said, all seventeen had root-specific phosphorylation sites, raising the possibility of organ-specific post-translational modification networks and potentially revealing an unknown mechanism for regulation of solute acquisition, translocation, and storage in plants. This phenomenon of organ-specific phosphorylation was also observed upon analysis of the global acetylation data. For example, two acetylated voltage-dependent anion channels (VDAC) were specifically found in seeds (Medtr8g469150.1 and Medtr6g011390.1). We note this family of proteins was not previously characterized in M. truncatula. Plant VDACs are one of the most abundant proteins of the mitochondrial membrane and are involved in the diffusion of large metabolites (Hombl{\’{e}}, et al., 2012). In animals, acetylation of VDACs is common (Kerner, et al., 2012). The function and role of these proteins in plants remains largely unknown (Berrier, et al., 2015; Hombl{\’{e}}, et al., 2012; Pan, et al., 2014). By providing a global view of organ-specific post-translational modification, the WMG Protein Compendium presents a unique and enabling knowledgebase that should broadly propel the functional annotation of the M. truncatula genome.
Proteome dynamics of nodule maturation
Evaluation of the proteome-level changes that accompany nodule development throughout the progression of their relationship with rhizobia is critical for a complete understanding of the biological pathways that underlie symbiotic nitrogen fixation (SNF). Of particular interest is the terminal differentiation of the rhizobia bacteria to nitrogen-fixing bacteriods, a transformation initiated and maintained by the release of nodule cysteine-rich (NCR) peptides by the M. truncatula plant (Mergaert, et al., 2003; Vasse, et al., 1990; Lauressergues, et al., 2015; Durgo, et al., 2015). These NCR peptides are similar in structure to anti-microbial peptides (AMPs) and are hypothesized to permeabilize bacterial membranes, disrupt cell division, and inhibit protein synthesis within the rhizobia, generating bacteroids suited for endosymbiosis rather than pathogenesis (cluster Pr1 Figure 3A, 4A, and 4C).
Figure 4. Nodule-specific proteins and post-translational modifications provide evidence for key regulatory mechanisms that drive the development and sustainability of the organ.
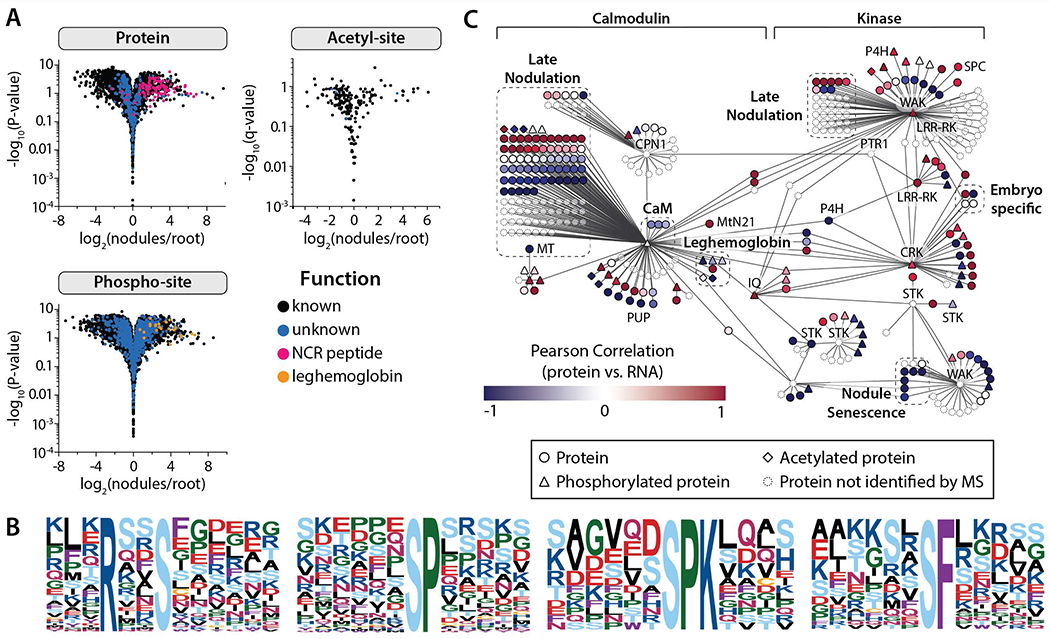
(A) Volcano plots compare protein and PTM-isoform expression in nodules vs. root tissues (Student’s t-test), indicating those proteins and PTMs that are nodule-specific. (B) All phosphorylation motifs identified in nodule-specific PTM isoforms (specificity determined by Student’s T-test analysis (fold-change > 2 and q < 0.01). Each pLOGo represents the statistical significance of a motif identified by performing phospho-serine motif analysis. The taller a residue is in the pLOGo, the more statistically significant it is to the motif. (C) A nodule-specific sub-network was extracted from the global co-expression network (Figure S4) by mapping nodule-specific proteins (specificity determined by Student’s T-test analysis (A); fold-change > 2 and q < 0.01) to the co-expression network and isolating the distinct cluster that resulted. The sub-network is organized based on the classification of hub genes, which were either calmodulin-like/calmodulin-binding or kinases. Pearson correlation coefficients were calculated by comparing protein and transcript expression over the 10, 14, and 28 dpi time-points; the color of each node reflects the coefficient calculated for that gene. Select gene families have been illustrated by dashed boxes. Genes not identified by our protein analysis have been faded.
Respiration and metabolic functions of bacteroids rely on the host plant for organic acids, mainly malate, to produce the ATP necessary to fix atmospheric nitrogen (Udvardi & Poole, 2013). Our results revealed that two malate transporters (Medtr6g084680.1 and Medtr8g104110.1) were highly expressed in the nodule, data that is in agreement with previous observations where neighboring (non-infected) cells metabolize sucrose into organic acids, particularly malate, that are transported to the infected cells (Limpens, et al., 2013). In addition, aspartate aminotransferase (Medtr4g011820.1), an enzyme that catalyzes the conversion of aspartate and oxoglutarate into oxaloacetate and glutamate (Limpens, et al., 2013), was abundant in the nodules. Further, two glutamine synthetases, one (MtGSII1a) previously described as a cytoplasmic protein and the other (Medtr5g077950.1) yet to be characterized, were found in our dataset (Torreira, et al., 2014). Glutamine synthetases catalyze the condensation of glutamate and ammonia, the product of nitrogenase, and produce glutamine, which is transported through the xylem for use elsewhere in the plant (Krapp, 2015). Besides these proteins, DMI1 (Medtr2g005870), a central player in symbiotic signaling, is phosphorylated in the nodules. To our knowledge this is the first report of DMI1 phosphorylation in M. truncatula. In addition to DMI1, another well-established protein in the symbiotic signaling, IPD3, is also phosphorylated in the nodules. IPD3 interacts with DMI3 and our previous work has identified six phosphorylation sites of IPD3 (Rose, et al., 2012). Here, we report the additional nodule-specific phosphorylation sites of IPD3. Further, a nodule-specific proton ATPase (MthA1, Medtr8g006790) that iis specific to arbuscular mycorrhizal roots is phosphorylated in the nodules (Benedito, et al., 2010; Manthey, et al., 2004; Nguyen, et al., 2015). We also identified two major classes of proteins - late-nodulins and leghemoglobins - that localize to the nodules (Figure 4A). Motif analysis of all the nodule-specific phospho-isoforms led to the discovery of several significantly enriched motifs (Figure 4B) (Chou & Schwartz, 2011; Schwartz & Gygi, 2005), suggesting the presence of key regulators and/or binding domains within the nodules that could play an integral role in SNF.
The WMG Protein Compendium provides a unique opportunity to study nodule maturation over time. There is a low degree of correlation of mRNA and protein abundance (Figure S5A) across the tree of life, due to differences in stability, degradation/synthesis rate, post-transcriptional and translational regulation of those molecules. That said, we compiled a dataset of 5,154 transcripts and their respective protein expression data in which there are reliable measurements of both transcript and protein abundance for the time course of nodule maturation (Figure S5B). We then asked the question, ignoring the degree of change, does the direction of change match? Surprisingly, 68% demonstrate a strong correlation (r > 0.6, “in-phase”) or anti-correlation (r < −0.6, “out-of-phase”). Only 32% of the total pairs of mRNA and proteins, showed weak correlation. We hypothesize that stability is driving the anti-correlation, as it was previously shown that housekeeping genes, e.g., ribosomal and cytoskeletal proteins, have more stable mRNA and protein (Schwanh{\”{a}}usser, et al., 2011) and transcript abundance changes do not result in immediate protein level changes (Belle, et al., 2006). Also notable is the over-representation of transcriptional modules (co-expression), as seen for coatomer and importin complexes in the intracellular protein/vesicle-mediated transport. Tight regulation in the “in-phase” is seen for the response to oxidative stress, hyperosmotic response, and the glycolytic process. This observation suggests that the rate of degradation/synthesis of these proteins is altered in a coordinated fashion.
Transcriptome co-expression analysis reveals nodule-specific network
Network-based integration of proteomic data onto physical, functional or regulatory networks provide a powerful way to contextualize and facilitate understanding of how individual proteins and PTMs function in larger subnetworks or pathways. Because we currently lack a genome-wide network for M. truncatula, we applied an expression-network inference algorithm on publicly available M. truncatula transcriptomic data to predict regulator target relationships (Roy, et al., 2013). Note that while there is considerable protein-protein interaction information available for the more widely used plant model, A. thaliana, this organism is not a legume and does not have the key molecular pathways to form symbiotic relationships such as those represented by legumes and rhizobia. Our inferred network connected 5,464 genes to 5,469 putative interactions (Figure S4, the WMG regulatory network, edge confidence > 0.75). This network provides a backbone to integrate our proteomic data to annotate each protein with interaction and/or regulatory context.
We employed the network to study the underlying molecular mechanisms of nodule biology. First, we analyzed proteomic, phospho-proteomic, and acetyl-proteomic expression within nodules as compared to roots (Figure 4A) to identify nodule-specific proteins. We reasoned that we could reveal symbiosis-relevant sub-network(s) by overlaying nodule-specific proteins, and their modifications, onto our global M. truncatula network (Figure S4). Interestingly, many of these co-localized to a single sub-network, which was extracted by removing the connecting edges from the global network using a ‘greedy’ approach (Figure 4C). We provide protein evidence for 200 of the 380 nodes within this predicted sub-network; further, 55 members of this network undergo post-translational modification via phosphorylation (43) and/or acetylation (10).
Using this nodule-specific network we sought to implicate candidate genes that play a central role(s) in regulating and maintaining symbiosis. The number of immediate connections (degree) associated with a node in the network is often used as an indicator for the importance of a node and can be used to prioritize genes for functional studies. Accordingly we examined this network for the presence of nodes with many more connections than average and called them hubs. Many hubs of our symbiosis network are occupied by kinases, which is universally found to be the largest single family of proteins within all sequenced plant genomes. Serine/threonine kinases (STK), a sub-family member (CRK), and cell-wall associated kinases represent six of ten hubs and are associated with ligand perception. In general, we see positive correlation of mRNA and protein expression over time for those key regulators, whereas their interactors are evenly mixed in terms of positive and negative correlation, suggesting involvement of both post-transcriptional and post-translational regulation. In addition to phosphorylation, proteolytic modifications are another means of regulating proteins post-translationally. Interestingly, we see anti-correlation for papain family cysteine proteases as part of the nodule senescence. Curiously, in the global analysis of transcript and protein abundance, proteases, in general, display anti-correlation.
Perhaps the most intriguing revelation of this analysis is the potential regulatory role of Medtr2g099790 (CaM-binding) - a predicted calmodulin binding protein. The CaM-binding protein has the highest degree; further, its transcript abundance is co-regulated with genes that play critical roles in SNF - i.e., leghemoglobins, nodule-specific cysteine-rich peptides (NCR), and calcium-binding proteins. Using the WMG Protein Compendium we not only show that this protein is phosphorylated (S42, S74, S416, S436, S432/S436), but we also provide strong evidence for a novel translation start (with N-terminal acetylation) of this principal regulator through inclusion of gene predictions in our consensus database (Figure S6). Calmodulin-binding proteins and kinases are classically involved in signaling pathways and their potential importance derived from this data analysis is not surprising since there is a uniquely critical periodic spiking of nuclear calcium that occurs early during the signaling process leading to nodule formation. A subset of calmodulin-binding proteins and kinases (Medtr2g099790, Medtr1g010220, Medtr7g114870, Medtr8g461120, and Medtr3g079850) represent the major hubs of our nodule-specific network, motivating us to conclude that the nodule symbiosome is regulated by these molecules (Liu, et al., 2006). We present these molecules as prime targets for future validation (e.g., by reverse genetic studies).
Plant peptides govern plant development, cell-cell communication, immune response, and symbiosis
Among the 23,013 proteins comprised by the WMG Protein Compendium, are a few hundred plant peptides (Murphy, et al., 2012) - expressed genes whose mature protein product is less than ~100 amino acids. These peptides are increasingly recognized as having critical roles in development, cell-cell communication, immune response, and symbiosis, among others. In our study, we detect several different peptide classes including stomagen, defensins, rapid alkalinization factors (RALF), S-locus cysteine-rich (SCR), and nodule-specific cysteine-rich (NCR). Further, we provide the first evidence that NCR peptides are post-translationally modified by both phosphorylation and acetylation (00103081|MEDTR, 00061019|MEDTR, 00067047|MEDTR, 00104363|MEDTR, 00038195|MEDTR, 00027343|MEDTR, 00024201|MEDTR, 00020853|MEDTR). Active plant peptides are generated following cleavage of the N-terminal signal peptide from the full-length gene product. This process is carried out by specialized enzymes called signal peptidase complexes. Even though most signal peptidases are ubiquitously expressed, we identify signal peptidases that are specific to the leaf (Medtr2g058970.1, Tukey p < 0.01) and root nodule (Medtr3g027890.1, Medtr5g081900.1, Tukey p < 0.01).
NCR peptides are of especial interest for their key role in controlling terminal differentiation of the S. meliloti bacteria to nitrogen-fixing bacteroids. These NCR peptides, the majority of which are localized to the nodules, are similar in structure to anti-microbial peptides and act by permeabilizing bacterial membranes, disrupting cell division, and inhibiting protein synthesis to induce formation of bacteroids. Among the proteins and peptides that are detected exclusively in the late stages of nodulation (i.e., late nodulation proteins, Figure 4C), the majority are NCRs. Additionally, we localized two novel nodule-specific signal peptidases to our gene regulatory network – Medtr3g027890.1 (subunit 3B of SPC, Figure 4C) and Medtr1g008280.2 (Signal peptide peptidase-like protein) – and suggest their possible role as NCR peptidases. Finally, another key element of this peptide-driven regulatory process are peptide transporters, of which, our nodule-specific network contains two – (MtN21, PTR1).
Putative endosymbiont targets of NCR peptides
Having identified and quantified 254 (pre-) mature NCRs, post-inoculation, we next examined their expression patterns over the infection time-course (Figure 5A). This analysis revealed three distinct stages, indicative of temporal regulation to facilitate the symbiosis. The early stage NCRs (Clusters 1-3, Figure 5A) presumably enable other NCRs to access the cytoplasm of S. meliloti by increasing the permeability of the cell membrane. This idea has been described as occurring over a two-step mechanism, though those studies (Nallu, et al., 2013; Maunoury, et al., 2010) provided less than a handful of candidate molecules. The WMG Protein Compendium categorizes several hundred and identifies 50 as having the putative function of increasing permeability (Tiricz, et al., 2013). The intermediate (Cluster 4, Figure 5A) and late (Clusters 5-8, Figure 5A) stage NCR expression is increasing over time and most likely targets proteins in the S. meliloti. We hypothesize that these clusters reflect the role that the NCR peptides play in SNF, with those in the early stage driving nodule morphogenesis and those in the late stage driving symbiosis.
Figure 5. M. truncatula and S. meliloti nodule time-course data reveals proteome changes that occur during nodule development and the establishment of rhizobial symbiosis.
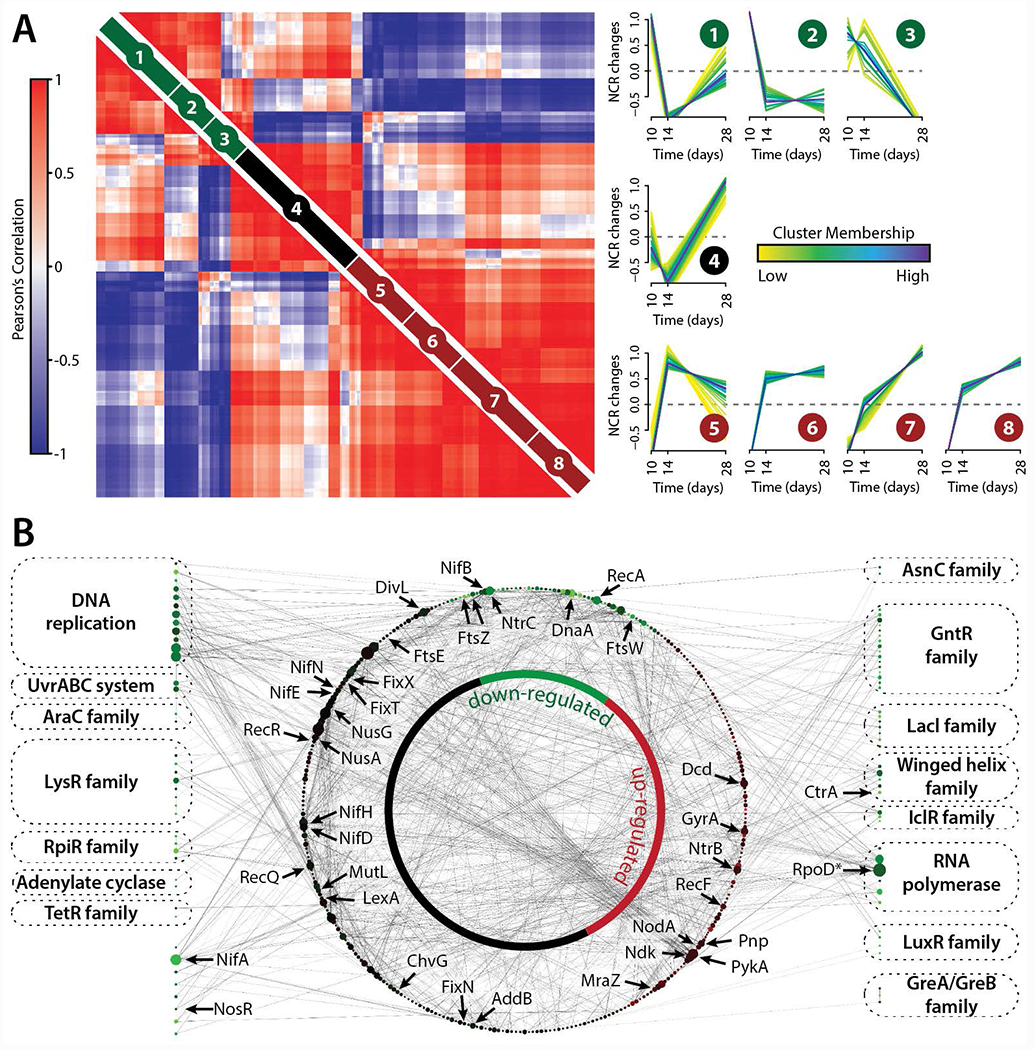
(A) Pair-wise Pearson correlation coefficients were calculated using M. truncatula NCR peptide abundance measurements obtained from the deep sequencing analysis (n = 252). NCR peptide time-course profiles were grouped into eight clusters using fuzzy c-means clustering. Darker trace colors reflect stronger membership to the given cluster. NCR peptide Pearson correlation values (left) were grouped using hierarchical clustering within each the fuzzy cluster (right). (B) S. meliloti DNA binding proteins down-regulated (>2-fold) from 10 to 28 days past rhizobial infection (Figure S7) were extracted (shown along border) and mapped to their corresponding protein-protein interactions (STRING database, shown within inner network circle). The size of each protein node reflects its degree within the network and the color of each node reflects how its protein expression changed over the 18-day time course.
To investigate the putative targets of these NCR peptides, we analyzed the S. meliloti proteome expression over the same infection time-course. The proteome comparison of bacteriods (28 days) to the initial phase of nodulation (10 days) results in up- and down-regulation of almost 50% of the 3,334 proteins (Figure S7). Analysis of the most significant (FDR q ≤ 0.05, Fisher’s exact test) biological processes and molecular functions being up or down-regulated within S. meliloti using gene ontology (GO) reveals the putative protein classes targeted by NCR peptides. The anti-microbial nature of mostly cationic NCRs results in the down-regulation of almost 20% of all proteins, which are significantly enriched in DNA-binding and transcription factor activity, among others. We hypothesize that NCRs target the conserved region in certain protein families of transcriptional regulators (AraC, RpiR, LysR, TetR, GntR, LuxR), proteins related to cell division (FtsZ, FtsW), and RNA polymerase co-factors. Previous studies identified cell cycle regulators as targets of NCR peptides, which is in agreement with our model (Farkas, et al., 2014). To associate the down-regulated and enriched proteins with their direct interactors we used the STRING (v9.1) S. meliloti 1021 protein-protein interactions and mapped these with BLAST (E-value < 10 e−5, sequence identity ≥ 95%) to S.meliloti BL225C, resulting in a network of 407 proteins and 1,172 interactions (Figure 5B). The nifA protein is down-regulated between 28 and 10 days, where the direct fix and nif protein interactors are constantly expressed (Gong, et al., 2006). nifA displays a high degree (25 interactors) to symbiosis-relevant proteins, such as nodulation protein A, signal transduction histidine kinase (NtrB), uroporphyrinogen decarboxylase (hemE).
Discussion
We have conducted a “two species in one” large-scale quantitative proteomic analyses to provide a global view of protein and PTM expression across the major organs of the eukaryotic model legume M. truncatula and its prokarytoic endosymbiont S. meliloti. These analyses resulted in the identification of over 23,000 unique proteins, 26,000 unique phosphorylation sites, and 600 unique acetyl sites; thus, the WMG Protein Compendium represents the most comprehensive protein and PTM expression atlas of M. truncatula to date and is of a quality and depth that rivals that the published atlases of mammalian organisms. This extensive dataset provides an incomparable resource for the study of legume biology and SNF, enabling the elucidation of organ-specific functionality and providing unique insights into the protein and PTM changes that accompany nodule development following rhizobial infection.
Many of the observations and conclusions from this proteomics study are unique and have not been evident based on more widespread DNA and RNA-based analyses. In particular, we have highlighted thousands of proteins whose expression levels show changes opposite to that of transcript during nodule development. We have also described organ-specific patterns of two critical post-translational modifications, phosphorylation and acetylation, that implicate novel regulators of nodule development and function. Amongst the multitude of specific proteins involved, we have for example, noted protein and/or PTM level changes in aquaporins and a large number of nodule cysteine rich peptides that are hypothesized to play a role in the hydraulic and signaling functions unique to the symbiotic function of the host and bacterial cells. Future studies by the research community focused on extensive reverse genetic analyses in the model legume, M. truncatula, and its bacterial endosymbionts, will provide tests of these hypotheses. Much like the important contributions that plant pathology research has played in understanding basic mechanisms in plant growth and development, studies on symbiotic signaling and development may also provide unique critical insights on basic mechanisms in plants. Importantly, this resource may be leveraged to identify critical genes ultimately useful for engineering SNF in other major crops that support human life, but that do not naturally perform this function, such as the grains corn, wheat, and rice.
Methods
Plant Materials and Growth
M. truncatula Jemalong A17 plants were grown and harvested under similar conditions to those used for the gene expression atlas presented by Benedito et al. Seeds were acid scarified, surface sterilized and vernalized for 3 days at 4°C. Germinated seedlings were grown in pots containing Turface in the greenhouse. Un-inoculated plants, fertilized daily with half-strength BD solution (Broughton and Dilworth, 1971) containing 2 mM KNO3 and 2 mM NH4NO3, were used for the collection of organs such as roots, stems, leaves, flowers, shoot buds, and seeds. All the above-mentioned organs, except for the flowers and seeds, were collected at 28 days after planting. For flowers and seeds, the initial vernalization was carried out for 2 weeks and the organs were harvested on the first day of flower opening and at maturity, respectively. Simultaneously a group of seeds vernalized for 3 days at 4°C and grown on Turface, inoculated with Sinorhizobium meliloti on the 1st and the 7th day after planting and fertilized with half-strength BD solution containing 0.5 mM KNO3, were used for the collection of 28 day-old nodules. For the collection of 10-and 14-day old nodules, plants were grown under aeroponic conditions and nodules were harvested 10 and 14 days post inoculation. Multiple plants were used for the organ collection and pooled to represent the biological replicates.
Protein Extraction
Organs were ground into a powder under liquid nitrogen using a mortar and pestle. Ice cold extraction buffer was added to each organ sample such that the volume of extraction buffer added (mL) was equal to five times the dry weight (g) of the ground plant organ. Sample mixtures were vortexed, subjected to probe sonication continuously for three minutes, and then filtered through Miracloth. Homogenized organ material was snap frozen in liquid nitrogen and stored at −80°C.
Protein was precipitated from organ extract using chloroform/methanol precipitation. One volume of chloroform was added to one volume of organ extract prior to vortexing. Three volumes of water were then added, followed by vortexing and subsequent centrifugation for 5 min (4696 x g, 4°C). The resulting top layer was removed and discarded with a serological pipet. Three volumes of methanol were then added to the solution, followed by vortexing and subsequent centrifugation for 5 min (4696 x g, 4°C). The resulting protein pellet was transferred to a 2mL eppendorf tube and washed 3x by vortexing with ice cold 80% acetone and centrifuging for 3 min (10,000 x g, 4°C). Following these washes, the protein pellet was dried on ice for approximately 1 hour and then immediately lysed.
Protein Lysis and Digestion
Protein pellets were re-suspended in approximately 1.25mL of lysis buffer (8M urea, 50mM Tris (pH 8), 30mM NaCl, 1mM CaCl2, 20mM sodium butyrate, 10mM nicotinamide, mini EDTA-free protease inhibitor (Roche Diagnostics, Indianapolis, IN), and phosSTOP phosphatase inhibitor (Roche Diagnostics, Indianapolis, IN)) and lysed on ice with a probe sonicator. Protein content was evaluated using a BCA assay (Thermo Fisher Scientific, San Jose, CA).
Proteins were reduced with 5mM dithiothreitol (incubation at 58°C for 40 minutes) and alkylated with 15mM iodoacetamide (incubation in the dark, at ambient temperature, for 40 minutes). Alkylation was quenched by adding an additional 5mM dithiothreitol (incubation at ambient temperature for 15 minutes). Proteins were enzymatically digested in a two-step process. First, proteinase LysC (Wako Chemicals, Richmond, VA) was added to each sample at a ratio of 1:200 (enzyme:protein) and the resulting mixtures were incubated at 37°C for 2.5 hours. Next, samples were diluted to a final concentration of 1.5 M urea (pH 8) with a solution of 50mM Tris and 5mM CaCl2. Sequencing-grade trypsin (Promega, Madison, WI) was added to each sample at a ratio of 1:50 (enzyme:protein) and the resulting mixtures were rocked at ambient temperature overnight. Digests were quenched by bringing the pH ~2 with trifluoroacetic acid and immediately desalted using C18 solid-phase extraction columns (SepPak, Waters, Milford, MA).
Protein Isobaric Labeling
Desalted material was labeled with TMT 10-plex isobaric tags (Thermo-Pierce, Rockford, IL). Only eight of the ten labels were used per experiment for the comparison of the eight different Medicago organs. Note that bud protein was only analyzed using deep proteome sequencing due to sample limitations. Prior to quenching the TMT reactions, ~5μg of material from each TMT channel was combined into a test mix and analyzed by LC-MS/MS to evaluate labeling efficiency and obtain optimal ratios for sample recombination. Following quenching, tagged peptides were combined in equal amounts by mass (~750μg per channel) and desalted. All experiments had ≥ 99% labeling efficiency, calculated by the number labeled peptides divided by the total number of peptide identifications.
Peptide Fractionation
TMT-labeled peptides were fractionated by strong cation exchange (SCX) using a polysulfoethylaspartamide column (9.4×200mm; PolyLC) on a Surveyor LC quaternary pump (Thermo Scientific). Buffer compositions were as follows: buffer A [5mM KH2PO4, 30% acetonitrile (pH 2.65)], buffer B [5mM KH2PO4, 350mM KCl, 30% acetonitrile (pH 2.65)], buffer C [50mM KH2PO4, 500mM KCl (pH 7.5)]. Each TMT mixture was re-suspended in buffer A, injected onto the column, and subjected to the following gradient for separation: 100% buffer A from 0-2 min, 0-15% buffer from 2-5 min, and 15-100% buffer B from 5-35 min. Buffer B was held at 100% for 10 minutes and then the column was washed extensively with buffer C and water prior to recalibration. Flow rate was held at 3.0 mL/min throughout the separation. Twelve fractions were collected over the first 50 minute elution period and were immediately frozen, lyophilized, and desalted. A small portion of each, 5%, was extracted and used for protein analysis. The remaining material was retained for phospho and acetyl lysine enrichment.
Unlabeled peptides were fractionated by high pH reverse-phase using a column packed with non-polar material (Gemini 5μm C18 110 Å LC Column 250 x 4.6 mm, Phenomenex, Torrance, CA) on a Surveyor LC quaternary pump (Thermo Scientific). Buffer compositions were as follows: buffer A [ (pH 10.0)] and buffer B [ (pH 10.0)]. Peptides from each organ were separately re-suspended in buffer A, injected onto the column, and subjected to the following gradient for separation: Flow rate was held at 0.8 mL/min for the first 40 minutes of fractionation and 1.0 mL/min for the final 20 minutes. Forty fractions were collected between 6 and 46 minutes of the elution period, then re-combined into ten fractions (final fraction 1: RP fractions 1, 11, 21, and 31, final fraction 2: RP fractions 2, 12, 22, and 32, … , final fraction 10: RP fractions 10, 20, 30, and 40). Re-combined fractions were immediately frozen, lyophilized, and stored in at −80°C until analyzed for deep proteome analysis.
Phosphopeptide Enrichment
Phosphopeptides were enriched using immobilized metal affinity chromatography (IMAC) with magnetic beads (Qiagen, Valencia, CA). Following equilibration with water, the magnetic beads were incubated with 40mM EDTA (pH 8.0) for 1 hour, with shaking. Next, the beads were washed four times with water and incubated with 30mM FeCl3 for 1 hour, with shaking. Beads were then washed four times with 80% acetonitrile/0.15% TFA. Each of the 12 fractions were re-suspended in 80% acetonitrile/0.15% TFA and incubated with the magnetic beads for 45 minutes, with shaking. Following this incubation, all unbound peptides were collected for subsequent acetyl lysine enrichment. Bound peptides were washed three times with 80% acetonitrile/0.15% TFA and eluted with 50% acetonitrile, 0.7% NH4OH. Eluted peptides were immediately acidified with 4% FA, frozen, and lyophilized. Each phospho peptide fraction was re-suspended in 20μL 0.2% FA for LC-MS/MS analysis.
Acetyl Lysine Enrichment
Peptides unbound by IMAC enrichment were pooled into 6 fractions. Each fraction was dissolved in 50mM HEPES (pH 7.5)/100mM KCl buffer, combined with approximately 50μL pan-acetyl lysine antibody-agarose conjugate (Immunechem), and rotated overnight at 4°C. Samples were rinsed eight times with 50mM HEPES (pH 7.5)/100mM KCl buffer prior to elution with 0.1% TFA. Eluted peptides were then desalted, frozen, and lyophilized. Each acetyl lysine fraction was re-suspended in 20μL 0.2% FA for LC-MS/MS analysis.
LC-MS/MS analysis
All experiments were performed using a NanoAcquity UPLC system (Waters, Milford, MA) coupled to an Orbitrap Fusion (Q-OT-qIT) mass spectrometer (Thermo Fisher Scientific, San Jose, CA). Reverse-phase columns were made in-house by packing a fused silica capillary (75μm i.d., 360 μm o.d, with a laser-pulled electrospray tip) with 1.7μm diameter, 130 Å pore size Bridged Ethylene Hybrid C18 particles (Waters) to a final length of 30cm. The column was heated to 60°C for all experiments. Samples were loaded onto the column for 12 minutes in 95:5 buffer A [water, 0.2% formic acid, and 5% DMSO]:buffer B [acetonitrile, 0.2% formic acid, and 5% DMSO] at a flow-rate of 0.30μL/min. Peptides were eluted using the following gradient: an increase to 7% B over 1 min, followed by a 42 min linear gradient from 7% to 18% B, followed by a 28 min linear gradient from 18% to 27% B, followed by a final 1 min ramp to 75% B which was held for 3 minutes. The column was equilibrated with 5% buffer B for an additional 25 min. Precursor peptide cations were generated from the eluent through the utilization of a nanoESI source. Phospho-enriched fractions were analyzed in duplicate.
Mass spectrometry instrument methods for TMT-labeled sample analysis consisted of MS1 survey scans (5e5 target value; 60,000 resolution; 350Th – 1400Th) that were used to guide subsequent data-dependent MS/MS scans analyzed in the orbitrap (5s cycle time, 1.0Th isolation window, HCD fragmentation; normalized collision energy of 37; 5e4 target value, 60,000 resolution). Dynamic exclusion duration was set to 30s, with a maximum exclusion list of 500 and an exclusion width of ±10ppm the selected average mass. Maximum injection times were set to 100ms for all MS1 scans, 100ms for MS/MS scans in whole protein analyses, and 250ms for MS/MS scans in phospho and acetyl enrichment analyses.
Mass spectrometry instrument methods for unlabeled sample analysis consisted of MS1 survey scans (5e5 target value; 60,000 resolution; 350Th – 1500Th) that were used to guide subsequent data-dependent MS/MS scans analyzed in the ion trap (1.0Th isolation window, HCD fragmentation; normalized collision energy of 30; 1e4 target value, IT rapid scan). Dynamic exclusion duration was set to 30s, with a maximum exclusion list of 500 and an exclusion width of ±10ppm the selected average mass. Maximum injection times were set to 100ms for all MS1 scans and 35ms for MS/MS scans.
Data Analysis
LFQ and TMT datasets were processed separately using the MaxQuant software (version 1.5.1.0) (Cox & Mann, 2008). Searches were performed against a non-redundant target-decoy consensus database composed of four well-known M. truncatula protein sequence databases (UniProt - 2014.12.18 (Bairoch, et al., 2005), Ensembl - 2014.12.18 (Flicek, et al., 2013), RefSeq - 2014.12.18 (Tatusova, et al., 2014), and the J. Craig Venter Institute - 2013.07.31 (Tang, et al., 2014)), de novo gene models and a rhizobial protein database (S. meliloti, UniProt - 2015.01.30 (Bairoch, et al., 2005)). The gene models were predicted with Augustus (Stanke & Waack, 2003) based on the Mt4.0 genome assembly (GCA_000219495.2, Ensembl Plants) and A. thaliana training parameters. Searches were conducted using the default precursor mass tolerances set by Andromeda (20 ppm first search, 4.5 ppm main search). LFQ data and TMT data were searched using a product mass tolerance of 0.35 Da and 0.015 Da, respectively. A maximum of 2 missed tryptic cleavages were allowed. The fixed modifications specified were carbamidomethylation of cysteine residues, TMT 10-plex on peptide N-termini, and TMT 10-plex on lysine residues. The variable modifications specified were oxidation of methionine and TMT 10-plex on tyrosine residues. Additional variable modifications were specified for phospho-peptide analyses (phosphorylation of threonine, serine, and tyrosine residues) and acetyl-peptide analyses (acetylation of lysine residues). Note that the acetylation modification mass shift was set to −187.1523 Da to account for the difference between an acetyl group and a TMT 10-plex tag, which enables the use of TMT 10-plex as a fixed modification on lysine residues, even for acetylated peptides. For all experiments, peptides and their corresponding proteins groups were both filtered to a 1% FDR.
Label-free quantification was performed within MaxQuant using MaxLFQ (Cox, et al., 2014). Missing values were imputed using the Perseus tool available with MaxQuant by replacing missing values from a normal distribution to simulate low abundance values in a typical MS experiment. TMT quantification was performed within MaxQuant. Following MaxQuant analysis, noise-band capping and protein normalization was performed at the peptide level using in-house software that employs strategies described previously (Phanstiel, et al., 2011). To consolidate the TMT experimental data for the implementation of statistical analyses, quantitative data from each experiment was log2 transformed and mean-normalized across all organs for each given protein or PTM isoform. Each column was also mean-normalized prior to statistical analyses to center the distribution of quantitative values obtained for each organ within each replicate on zero.
PTM localization was performed within the MaxQuant software suite (Olsen, et al., 2006). Only those PTMs that could be localized to a specific amino acid residue with over 75% confidence were included in our analysis. PTM peptides were consolidated into PTM-isoforms as is performed in the COMPASS software suite (Wenger, et al., 2011).
Bioinformatics
The circular proteome map (CPM) was constructed using Circos (Krzywinski, et al., 2009). For the CPM, organ LFQ values (Lt) were normalized for each protein (l) as follows:
To assign organs specificity to modified and unmodified proteins, we used Shannon entropy as previously described (Xie, et al., 2013; Schug, et al., 2005). In brief, a relative expression value for each protein was calculated, as follows:
And a entropy index score (s) was calculated as
A low score indicates organ specificity. In the case of modified proteins, we calculated scores for all isoforms for a protein and selected the isoform with the lowest score. For illustration purposes we inverted the scale, as follows:
All statistical analyses were performed using R (Ihaka & Gentleman, 1996). Assessment of organ similarity using the LFQ data (Fig. 3) was generated by performing hierarchical clustering (Euclidean distance) on the Pearson correlation values calculated for each organ pair using the rcorr and corrplot package. ANOVA analyses were performed using only those proteins and PTM isoforms quantified across two or three replicates. For each dataset, the p-values resulting from ANOVA were corrected for multiple hypotheses; a cut-off of q < 0.01 was used to determine significance. Hierarchical clustering (Euclidean distance) was performed in R using only those proteins or PTM isoforms that were found to contain significant variance, as determined by ANOVA. Post hoc testing using the Tukey Honest Significant Differences (HSD) method was performed to evaluate organ-specificity for each protein/PTM isoform found to contain significant variance; if a given organ was found to be significantly up-regulated (p < 0.01) compared to every other organ, then that protein/PTM-isoform was considered to be specific to that given organ. Heatmaps were produced using the pheatmap package. Protein clusters were generated based on the protein dendrogram generated during the hierarchical clustering. The number of clusters produced following hierarchical clustering was user-defined and was selected based on observable heatmap trends, cluster membership, and GO enrichment (each of these factors was evaluated following the generation of 6, 8, 10, 12, 15, and 20 clusters for each dataset; the cluster count that produced the most intuitive grouping was selected). GO enrichment was performed using the Fisher’s exact test. The comparison of protein/PTM isoform expression between the nodules and all other organs (Fig. 5) was performed in R using the Student’s T-test. Phospho-serine and acetyl-lysine motif analysis was performed using all nodule-specific (Student’s t-test, q < 0.01 and fold-change > 2) phospho- and acetyl-isoforms, respectively. Motif analysis was performed using v1.2 of motif-x. Sequences were manually aligned and all M.truncatula proteins identified in our study were used as background. A width of 13 residues, minimum number of 15 occurrences, and a significance of 0.001 were specified prior to running motif-x. To identify NCR specific expression stages, we combined hierarchical (hard) clustering and fuzzy c-means (soft) clustering (Mfuzz package in R). The global ordering of the hierarchical clustering was refined with the fuzzy clusters by reordering according to the three stages.
Network analysis
To infer the regulatory network for M. truncatula, we used an expression-based network inference algorithm, Modular regulatory network learning with per gene information (MERLIN) (Roy, et al., 2013) algorithm within a stability selection framework (Meinshausen & Bühlmann, 2010). MERLIN models a regulatory network as a statistical dependency network representing regulatory relationships among regulators (such as transcription factors, signaling proteins, post-translational modifying enzymes) and target genes as a set of statistical dependencies. For each gene, MERLIN learns a separate regulatory program with the constraint that genes with similar expression profile should have similar (but not necessarily identical regulatory programs). MERLIN takes as input candidate regulators and genome-wide expression levels and uses an iterative algorithm to learn the regulators for individual genes, while imposing a module constraint. Briefly, in each iteration, MERLIN uses a greedy approach to update the regulatory program of each gene based on the expression of the regulators and module assignment of their targets, and then updates the module assignment using co-expression and co-regulation of the genes. Stability selection is a subsampling approach for estimating confidence on inferred network connections. MERLIN was applied on expression data downloaded from the Medicago truncatula Gene Expression Atlas (MtGEA) (He, et al., 2009) and created the expression data matrix. The data matrix has 254 samples from 33 experiments.
We quantile normalized (Bolstad, et al., 2003) the expression data and mapped the probeset IDs to Mt4.0 locus IDs. Briefly, we used BWA to align the probe sequences to the Mt4.0 reference transcriptome allowing no more than 1 mismatch in alignment. We calculated the specificity of each probeset/gene mapping based on the number of individual probes mapping to the target locus vs off-target. We considered only those probeset/gene mappings such that there were at least 5 probes specific to the assigned gene and that at least 80% of the probes in the probeset mapped uniquely to this gene. . We removed genes that did not vary significantly across samples. Specifically, we computed the mean for each gene, zero-mean transformed its expression level and included the gene only if its value varied at least +−1 from the mean in at least 5 samples. Our input included 15,643 genes and 2,821 candidate regulators defined based on literature as well as sequence annotations to identify new kinases. These regulators included transcription factors, kinases, as well additional regulators associated with post-translational modifications and genes involved in hormone metabolism. To assess confidence in the inferred network connections we used stability selection. Briefly, we created 40 sub-sets of the data set by randomly selecting 50% columns from the complete data set, and infer a MERLIN network for each sub-set. We estimate the confidence of each edge by calculating the percentage of times out of 40 we observed the edge in the inferred networks. The final inferred network was selected to be that which had an edge confidence of at least 60%. The network connected 1248 regulators to 8,194 target genes. The inference process is time consuming and it takes ~72 hours to infer each of these networks. To speed up this process we used HTCondor (Thain, et al., 2005) high-throughput computing cluster in UW-Madison to run the network inference runs in parallel.
Website
All relevant information from the search results and data analysis were imported into a MySQL database. The results were supplemented by ordered gene locus identifiers and cross references to public databases (Ensembl, JCVI, UniProt, RefSeq). The interface to access the database was built with the Bootstrap front-end framework and data visualization implemented with the D3.js JavaScript library.
Supplementary Material
Acknowledgments
We thank Tim Rhoads, Katie Overmyer and Alex Hebert for fruitful discussions. This work was supported mainly by funds from the NSF (IOS-PGRP- Grant No. 0701846, DBI Grant No. 1350677). C.E.M. was supported by an NLM training grant to the Computation and Informatics in Biology and Medicine Training Program (NLM T15LM007359). A.L.R gratefully acknowledges support from support from a National Institutes of Health-funded Genomic Sciences Training Program (5T32HG002760), the ACS Division of Analytical Chemistry and from the Society of Analytical Chemists of Pittsburgh (SACP).
Footnotes
Accession codes
The raw mass spectrometry data was submitted via ProteomeXchange (Vizca{\’{\i}}no, J. A. et al., 2014) to the PRIDE repository (PXD002692) (Vizca{\’{\i}}no, et al., 2013).
Supplementary information
Supplemental information includes seven figures and four tables and can be found with this article online.
References
- Andolfo G et al. , 2015. Genetic variability and evolutionary diversification of membrane ABC transporters in plants.. BMC Plant Biol, Volume 15, p. 51. [DOI] [PMC free article] [PubMed] [Google Scholar]
- Azad AK et al. , 2008. Characterization of four plasma membrane aquaporins in tulip petals: a putative homolog is regulated by phosphorylation.. Plant Cell Physiol, August, 49(8), pp. 1196–1208. [DOI] [PubMed] [Google Scholar]
- Bairoch A et al. , 2005. The Universal Protein Resource (UniProt).. Nucleic Acids Res, January, 33(Database issue), pp. D154--D159. [DOI] [PMC free article] [PubMed] [Google Scholar]
- Belle A et al. , 2006. Quantification of protein half-lives in the budding yeast proteome.. Proc Natl Acad Sci U S A, Aug, 103(35), pp. 13004–13009. [DOI] [PMC free article] [PubMed] [Google Scholar]
- Benedito VA et al. , 2010. Genomic inventory and transcriptional analysis of Medicago truncatula transporters.. Plant Physiol, March, 152(3), pp. 1716–1730. [DOI] [PMC free article] [PubMed] [Google Scholar]
- Benedito VA et al. , 2008. A gene expression atlas of the model legume Medicago truncatula.. Plant J, August, 55(3), pp. 504–513. [DOI] [PubMed] [Google Scholar]
- Berrier C et al. , 2015. Channel characteristics of VDAC-3 from Arabidopsis thaliana.. Biochem Biophys Res Commun, March, 459(1), pp. 24–28. [DOI] [PubMed] [Google Scholar]
- Bock KW et al. , 2006. Integrating membrane transport with male gametophyte development and function through transcriptomics.. Plant Physiol, April, 140(4), pp. 1151–1168. [DOI] [PMC free article] [PubMed] [Google Scholar]
- Boex-Fontvieille E et al. , 2014. Photosynthetic activity influences cellulose biosynthesis and phosphorylation of proteins involved therein in Arabidopsis leaves.. J Exp Bot, September, 65(17), pp. 4997–5010. [DOI] [PubMed] [Google Scholar]
- Bolstad BM, Irizarry RA, Astrand M & Speed TP, 2003. A comparison of normalization methods for high density oligonucleotide array data based on variance and bias.. Bioinformatics, January, 19(2), pp. 185–193. [DOI] [PubMed] [Google Scholar]
- Cecchetti V et al. , 2008. Auxin regulates Arabidopsis anther dehiscence, pollen maturation, and filament elongation.. Plant Cell, July, 20(7), pp. 1760–1774. [DOI] [PMC free article] [PubMed] [Google Scholar]
- Chae K et al. , 2012. Arabidopsis SMALL AUXIN UP RNA63 promotes hypocotyl and stamen filament elongation.. Plant J, August, 71(4), pp. 684–697. [DOI] [PubMed] [Google Scholar]
- Chen M, Choi Y, Voytas DF & Rodermel S, 2000. Mutations in the Arabidopsis VAR2 locus cause leaf variegation due to the loss of a chloroplast FtsH protease.. Plant J, May, 22(4), pp. 303–313. [DOI] [PubMed] [Google Scholar]
- Chou MF & Schwartz D, 2011. Biological sequence motif discovery using motif-x.. Curr Protoc Bioinformatics, September, Volume Chapter 13, pp. Unit 13.15--Unit 13.24. [DOI] [PubMed] [Google Scholar]
- Clarke VC et al. , 2015. Proteomic analysis of the soybean symbiosome identifies new symbiotic proteins.. Mol Cell Proteomics, May, 14(5), pp. 1301–1322. [DOI] [PMC free article] [PubMed] [Google Scholar]
- Cox J et al. , 2014. Accurate proteome-wide label-free quantification by delayed normalization and maximal peptide ratio extraction, termed MaxLFQ.. Mol Cell Proteomics, September, 13(9), pp. 2513–2526. [DOI] [PMC free article] [PubMed] [Google Scholar]
- Cox J & Mann M, 2008. MaxQuant enables high peptide identification rates, individualized p.p.b.-range mass accuracies and proteome-wide protein quantification.. Nat Biotechnol, December, 26(12), pp. 1367–1372. [DOI] [PubMed] [Google Scholar]
- Dixon R & Kahn D, 2004. Genetic regulation of biological nitrogen fixation.. Nat Rev Microbiol, August, 2(8), pp. 621–631. [DOI] [PubMed] [Google Scholar]
- Durgo H et al. , 2015. Identification of nodule-specific cysteine-rich plant peptides in endosymbiotic bacteria.. Proteomics, July, 15(13), pp. 2291–2295. [DOI] [PubMed] [Google Scholar]
- El Yahyaoui F et al. , 2004. Expression profiling in Medicago truncatula identifies more than 750 genes differentially expressed during nodulation, including many potential regulators of the symbiotic program.. Plant Physiol, October, 136(2), pp. 3159–3176. [DOI] [PMC free article] [PubMed] [Google Scholar]
- Farkas A et al. , 2014. Medicago truncatula symbiotic peptide NCR247 contributes to bacteroid differentiation through multiple mechanisms.. Proc Natl Acad Sci U S A, April, 111(14), pp. 5183–5188. [DOI] [PMC free article] [PubMed] [Google Scholar]
- Flicek P et al. , 2013. Ensembl 2013.. Nucleic Acids Res, January, 41(Database issue), pp. D48--D55. [DOI] [PMC free article] [PubMed] [Google Scholar]
- Forzani C et al. , 2011. The Arabidopsis protein kinase Pto-interacting 1-4 is a common target of the oxidative signal-inducible 1 and mitogen-activated protein kinases.. FEBS J, April, 278(7), pp. 1126–1136. [DOI] [PubMed] [Google Scholar]
- Gallardo K et al. , 2003. Proteomics of Medicago truncatula seed development establishes the time frame of diverse metabolic processes related to reserve accumulation.. Plant Physiol, October, 133(2), pp. 664–682. [DOI] [PMC free article] [PubMed] [Google Scholar]
- Geisler M & Murphy AS, 2006. The ABC of auxin transport: the role of p-glycoproteins in plant development.. FEBS Lett, February, 580(4), pp. 1094–1102. [DOI] [PubMed] [Google Scholar]
- Gibson KE, Kobayashi H & Walker GC, 2008. Molecular determinants of a symbiotic chronic infection.. Annu Rev Genet, Volume 42, pp. 413–441. [DOI] [PMC free article] [PubMed] [Google Scholar]
- Goldschmidt-Clermont M & Bassi R, 2015. Sharing light between two photosystems: mechanism of state transitions.. Curr Opin Plant Biol, May, Volume 25, pp. 71–78. [DOI] [PubMed] [Google Scholar]
- Gong ZY et al. , 2006. Sinorhizobium meliloti nifA mutant induces different gene expression profile from wild type in Alfalfa nodules.. Cell Res, October, 16(10), pp. 818–829. [DOI] [PubMed] [Google Scholar]
- Grimsrud PA et al. , 2010. Large-scale phosphoprotein analysis in Medicago truncatula roots provides insight into in vivo kinase activity in legumes.. Plant Physiol, January, 152(1), pp. 19–28. [DOI] [PMC free article] [PubMed] [Google Scholar]
- Hawkins C & Liu Z, 2014. A model for an early role of auxin in Arabidopsis gynoecium morphogenesis.. Front Plant Sci, Volume 5, p. 327. [DOI] [PMC free article] [PubMed] [Google Scholar]
- Hebert AS et al. , 2014. The one hour yeast proteome.. Mol Cell Proteomics, January, 13(1), pp. 339–347. [DOI] [PMC free article] [PubMed] [Google Scholar]
- He J et al. , 2009. The Medicago truncatula gene expression atlas web server.. BMC Bioinformatics, Volume 10, p. 441. [DOI] [PMC free article] [PubMed] [Google Scholar]
- Hombl{\’{e}} F, Krammer E-M & Pr{\’{e}}vost M, 2012. Plant VDAC: facts and speculations.. Biochim Biophys Acta, June, 1818(6), pp. 1486–1501. [DOI] [PubMed] [Google Scholar]
- Ihaka R & Gentleman R, 1996. R: A Language for Data Analysis and Graphics. Journal of Computational and Graphical Statistics, September, 5(3), p. 299–314. [Google Scholar]
- Kang J et al. , 2011. Plant ABC Transporters.. Arabidopsis Book, Volume 9, p. e0153. [DOI] [PMC free article] [PubMed] [Google Scholar]
- Kerner J, Lee K, Tandler B & Hoppel CL, 2012. VDAC proteomics: post-translation modifications.. Biochim Biophys Acta, June, 1818(6), pp. 1520–1525. [DOI] [PMC free article] [PubMed] [Google Scholar]
- Krapp A, 2015. Plant nitrogen assimilation and its regulation: a complex puzzle with missing pieces.. Curr Opin Plant Biol, May, Volume 25, pp. 115–122. [DOI] [PubMed] [Google Scholar]
- Krzywinski M et al. , 2009. Circos: an information aesthetic for comparative genomics.. Genome Res, September, 19(9), pp. 1639–1645. [DOI] [PMC free article] [PubMed] [Google Scholar]
- Lauressergues D et al. , 2015. Primary transcripts of microRNAs encode regulatory peptides.. Nature, April, 520(7545), pp. 90–93. [DOI] [PubMed] [Google Scholar]
- Li J et al. , 2005. Arabidopsis H+-PPase AVP1 regulates auxin-mediated organ development.. Science, October, 310(5745), pp. 121–125. [DOI] [PubMed] [Google Scholar]
- Limpens E et al. , 2013. cell- and organ-specific transcriptome analyses of Medicago truncatula root nodules.. PLoS One, 8(5), p. e64377. [DOI] [PMC free article] [PubMed] [Google Scholar]
- Liu J et al. , 2006. Recruitment of novel calcium-binding proteins for root nodule symbiosis in Medicago truncatula.. Plant Physiol, May, 141(1), pp. 167–177. [DOI] [PMC free article] [PubMed] [Google Scholar]
- Lohar DP et al. , 2006. Transcript analysis of early nodulation events in Medicago truncatula.. Plant Physiol, January, 140(1), pp. 221–234. [DOI] [PMC free article] [PubMed] [Google Scholar]
- Lombardi L et al. , 2015. Auxin involvement in tepal senescence and abscission in Lilium: a tale of two lilies.. J Exp Bot, February, 66(3), pp. 945–956. [DOI] [PMC free article] [PubMed] [Google Scholar]
- Manthey K et al. , 2004. Transcriptome profiling in root nodules and arbuscular mycorrhiza identifies a collection of novel genes induced during Medicago truncatula root endosymbioses.. Mol Plant Microbe Interact, October, 17(10), pp. 1063–1077. [DOI] [PubMed] [Google Scholar]
- Marx H et al. , 2013. MScDB: a mass spectrometry-centric protein sequence database for proteomics.. J Proteome Res, June, 12(6), pp. 2386–2398. [DOI] [PubMed] [Google Scholar]
- Maunoury N et al. , 2010. Differentiation of symbiotic cells and endosymbionts in Medicago truncatula nodulation are coupled to two transcriptome-switches.. PLoS One, 5(3), p. e9519. [DOI] [PMC free article] [PubMed] [Google Scholar]
- Maurel C, Kado RT, Guern J & Chrispeels MJ, 1995. Phosphorylation regulates the water channel activity of the seed-specific aquaporin alpha-TIP.. EMBO J, July, 14(13), pp. 3028–3035. [DOI] [PMC free article] [PubMed] [Google Scholar]
- Meinshausen N & Bühlmann P, 2010. Stability selection. Journal of the Royal Statistical Society: Series B (Statistical Methodology), July, 72(4), p. 417–473. [Google Scholar]
- Mergaert P et al. , 2003. A novel family in Medicago truncatula consisting of more than 300 nodule-specific genes coding for small, secreted polypeptides with conserved cysteine motifs.. Plant Physiol, May, 132(1), pp. 161–173. [DOI] [PMC free article] [PubMed] [Google Scholar]
- Moreau M et al. , 2012. EDS1 contributes to nonhost resistance of Arabidopsis thaliana against Erwinia amylovora.. Mol Plant Microbe Interact, March, 25(3), pp. 421–430. [DOI] [PubMed] [Google Scholar]
- Murphy E, Smith S & De Smet I, 2012. Small signaling peptides in Arabidopsis development: how cells communicate over a short distance.. Plant Cell, August, 24(8), pp. 3198–3217. [DOI] [PMC free article] [PubMed] [Google Scholar]
- Nallu S et al. , 2013. Regulatory patterns of a large family of defensin-like genes expressed in nodules of Medicago truncatula.. PLoS One, 8(4), p. e60355. [DOI] [PMC free article] [PubMed] [Google Scholar]
- Nguyen TT et al. , 2015. Potential regulatory phosphorylation sites in a Medicago truncatula plasma membrane proton pump implicated during early symbiotic signaling in roots.. FEBS Lett, August, 589(17), pp. 2186–2193. [DOI] [PMC free article] [PubMed] [Google Scholar]
- Oldroyd GED, Murray JD, Poole PS & Downie JA, 2011. The rules of engagement in the legume-rhizobial symbiosis.. Annu Rev Genet, Volume 45, pp. 119–144. [DOI] [PubMed] [Google Scholar]
- Olsen JV et al. , 2006. Global, in vivo, and site-specific phosphorylation dynamics in signaling networks.. Cell, November, 127(3), pp. 635–648. [DOI] [PubMed] [Google Scholar]
- Ott T et al. , 2005. Symbiotic leghemoglobins are crucial for nitrogen fixation in legume root nodules but not for general plant growth and development.. Curr Biol, March, 15(6), pp. 531–535. [DOI] [PubMed] [Google Scholar]
- Pan X, Chen Z, Yang X & Liu G, 2014. Arabidopsis voltage-dependent anion channel 1 (AtVDAC1) is required for female development and maintenance of mitochondrial functions related to energy-transaction.. PLoS One, 9(9), p. e106941. [DOI] [PMC free article] [PubMed] [Google Scholar]
- Pauly M & Keegstra K, 2008. Cell-wall carbohydrates and their modification as a resource for biofuels.. Plant J, May, 54(4), pp. 559–568. [DOI] [PubMed] [Google Scholar]
- Phanstiel DH et al. , 2011. Proteomic and phosphoproteomic comparison of human ES and iPS cells.. Nat Methods, 8(10), pp. 821–827. [DOI] [PMC free article] [PubMed] [Google Scholar]
- Robert HS, Crhak Khaitova L, Mroue S & Benkov{\’{a}} E, 2015. The importance of localized auxin production for morphogenesis of reproductive organs and embryos in Arabidopsis.. J Exp Bot, August, 66(16), pp. 5029–5042. [DOI] [PubMed] [Google Scholar]
- Rodriguez MCS, Petersen M & Mundy J, 2010. Mitogen-activated protein kinase signaling in plants.. Annu Rev Plant Biol, Volume 61, pp. 621–649. [DOI] [PubMed] [Google Scholar]
- Rose CM et al. , 2012. Medicago PhosphoProtein Database: a repository for Medicago truncatula phosphoprotein data.. Front Plant Sci, Volume 3, p. 122. [DOI] [PMC free article] [PubMed] [Google Scholar]
- Rose CM et al. , 2012. Rapid phosphoproteomic and transcriptomic changes in the rhizobia-legume symbiosis.. Mol Cell Proteomics, September, 11(9), pp. 724–744. [DOI] [PMC free article] [PubMed] [Google Scholar]
- Roy S et al. , 2013. Integrated module and gene-specific regulatory inference implicates upstream signaling networks.. PLoS Comput Biol, 9(10), p. e1003252. [DOI] [PMC free article] [PubMed] [Google Scholar]
- Schnabel EL & Frugoli J, 2004. The PIN and LAX families of auxin transport genes in Medicago truncatula.. Mol Genet Genomics, November, 272(4), pp. 420–432. [DOI] [PubMed] [Google Scholar]
- Schug J et al. , 2005. Promoter features related to tissue specificity as measured by Shannon entropy.. Genome Biol, 6(4), p. R33. [DOI] [PMC free article] [PubMed] [Google Scholar]
- Schwanh{\”{a}}usser B et al. , 2011. Global quantification of mammalian gene expression control.. Nature, May, 473(7347), pp. 337–342. [DOI] [PubMed] [Google Scholar]
- Schwartz D & Gygi SP, 2005. An iterative statistical approach to the identification of protein phosphorylation motifs from large-scale data sets.. Nat Biotechnol, November, 23(11), pp. 1391–1398. [DOI] [PubMed] [Google Scholar]
- Senko MW et al. , 2013. Novel parallelized quadrupole/linear ion trap/Orbitrap tribrid mass spectrometer improving proteome coverage and peptide identification rates.. Anal Chem, December, 85(24), pp. 11710–11714. [DOI] [PubMed] [Google Scholar]
- Shen C et al. , 2015. Genome-wide identification and expression analysis of auxin response factor gene family in Medicago truncatula.. Front Plant Sci, Volume 6, p. 73. [DOI] [PMC free article] [PubMed] [Google Scholar]
- Shen C et al. , 2014. Genome-wide identification and expression profiling analysis of the Aux/IAA gene family in Medicago truncatula during the early phase of Sinorhizobium meliloti infection.. PLoS One, 9(9), p. e107495. [DOI] [PMC free article] [PubMed] [Google Scholar]
- Sj{\”{o}}gren LLE et al. , 2006. Structural and functional insights into the chloroplast ATP-dependent Clp protease in Arabidopsis.. Plant Cell, October, 18(10), pp. 2635–2649. [DOI] [PMC free article] [PubMed] [Google Scholar]
- Stanke M & Waack S, 2003. Gene prediction with a hidden Markov model and a new intron submodel.. Bioinformatics, October, Volume 19 Suppl 2, pp. ii215--ii225. [DOI] [PubMed] [Google Scholar]
- Tang H et al. , 2014. An improved genome release (version Mt4.0) for the model legume Medicago truncatula.. BMC Genomics, Volume 15, p. 312. [DOI] [PMC free article] [PubMed] [Google Scholar]
- Tatusova T et al. , 2014. RefSeq microbial genomes database: new representation and annotation strategy.. Nucleic Acids Res, January, 42(Database issue), pp. D553--D559. [DOI] [PMC free article] [PubMed] [Google Scholar]
- Thain D, Tannenbaum T & Livny M, 2005. Distributed computing in practice: the Condor experience. Concurrency Computat.: Pract. Exper, 17(2–4), p. 323–356. [Google Scholar]
- Timmers AC, Auriac MC & Truchet G, 1999. Refined analysis of early symbiotic steps of the Rhizobium-Medicago interaction in relationship with microtubular cytoskeleton rearrangements.. Development, August, 126(16), pp. 3617–3628. [DOI] [PubMed] [Google Scholar]
- Tiricz H et al. , 2013. Antimicrobial nodule-specific cysteine-rich peptides induce membrane depolarization-associated changes in the transcriptome of Sinorhizobium meliloti.. Appl Environ Microbiol, November, 79(21), pp. 6737–6746. [DOI] [PMC free article] [PubMed] [Google Scholar]
- Torreira E et al. , 2014. The structures of cytosolic and plastid-located glutamine synthetases from Medicago truncatula reveal a common and dynamic architecture.. Acta Crystallogr D Biol Crystallogr, April, 70(Pt 4), pp. 981–993. [DOI] [PMC free article] [PubMed] [Google Scholar]
- Udvardi M & Poole PS, 2013. Transport and metabolism in legume-rhizobia symbioses.. Annu Rev Plant Biol, Volume 64, pp. 781–805. [DOI] [PubMed] [Google Scholar]
- Uehlein N et al. , 2007. Arbuscular mycorrhizal symbiosis and plant aquaporin expression.. Phytochemistry, January, 68(1), pp. 122–129. [DOI] [PubMed] [Google Scholar]
- Uwer U, Willmitzer L & Altmann T, 1998. Inactivation of a glycyl-tRNA synthetase leads to an arrest in plant embryo development.. Plant Cell, August, 10(8), pp. 1277–1294. [DOI] [PMC free article] [PubMed] [Google Scholar]
- Van de Velde W et al. , 2006. Aging in legume symbiosis. A molecular view on nodule senescence in Medicago truncatula.. Plant Physiol, June, 141(2), pp. 711–720. [DOI] [PMC free article] [PubMed] [Google Scholar]
- Van Wilder V et al. , 2008. Maize plasma membrane aquaporins belonging to the PIP1 and PIP2 subgroups are in vivo phosphorylated.. Plant Cell Physiol, September, 49(9), pp. 1364–1377. [DOI] [PubMed] [Google Scholar]
- Vasse J, de Billy F, Camut S & Truchet G, 1990. Correlation between ultrastructural differentiation of bacteroids and nitrogen fixation in alfalfa nodules.. J Bacteriol, August, 172(8), pp. 4295–4306. [DOI] [PMC free article] [PubMed] [Google Scholar]
- Verdoucq L et al. , 2014. Plant aquaporins on the move: reversible phosphorylation, lateral motion and cycling.. Curr Opin Plant Biol, December, Volume 22, pp. 101–107. [DOI] [PubMed] [Google Scholar]
- Vizca{\’{\i}}no JA et al. , 2013. The PRoteomics IDEntifications (PRIDE) database and associated tools: status in 2013.. Nucleic Acids Res, January, 41(Database issue), pp. D1063--D1069. [DOI] [PMC free article] [PubMed] [Google Scholar]
- Vizca{\’{\i}}no JA et al. , 2014. ProteomeXchange provides globally coordinated proteomics data submission and dissemination.. Nat Biotechnol, March, 32(3), pp. 223–226. [DOI] [PMC free article] [PubMed] [Google Scholar]
- Volkening JD et al. , 2012. A proteogenomic survey of the Medicago truncatula genome.. Mol Cell Proteomics, October, 11(10), pp. 933–944. [DOI] [PMC free article] [PubMed] [Google Scholar]
- Wenger CD et al. , 2011. COMPASS: a suite of pre- and post-search proteomics software tools for OMSSA.. Proteomics, March, 11(6), pp. 1064–1074. [DOI] [PMC free article] [PubMed] [Google Scholar]
- Xiao TT et al. , 2014. Fate map of Medicago truncatula root nodules.. Development, September, 141(18), pp. 3517–3528. [DOI] [PubMed] [Google Scholar]
- Xie W et al. , 2013. Epigenomic analysis of multilineage differentiation of human embryonic stem cells.. Cell, May, 153(5), pp. 1134–1148. [DOI] [PMC free article] [PubMed] [Google Scholar]
- Yazaki K, 2006. ABC transporters involved in the transport of plant secondary metabolites.. FEBS Lett, February, 580(4), pp. 1183–1191. [DOI] [PubMed] [Google Scholar]
- Young ND et al. , 2011. The Medicago genome provides insight into the evolution of rhizobial symbioses.. Nature, December, 480(7378), pp. 520–524. [DOI] [PMC free article] [PubMed] [Google Scholar]
Associated Data
This section collects any data citations, data availability statements, or supplementary materials included in this article.