

Abstract
Background
Chronic obstructive pulmonary disease (COPD) is a heterogeneous group of lung conditions challenging to diagnose and treat. Identification of phenotypes of patients with lung function loss may allow early intervention and improve disease management. We characterised patients with the ‘fast decliner’ phenotype, determined its reproducibility and predicted lung function decline after COPD diagnosis.
Methods
A prospective 4 years observational study that applies machine learning tools to identify COPD phenotypes among 13 260 patients from the UK Royal College of General Practitioners and Surveillance Centre database. The phenotypes were identified prior to diagnosis (training data set), and their reproducibility was assessed after COPD diagnosis (validation data set).
Results
Three COPD phenotypes were identified, the most common of which was the ‘fast decliner’—characterised by patients of younger age with the lowest number of COPD exacerbations and better lung function—yet a fast decline in lung function with increasing number of exacerbations. The other two phenotypes were characterised by (a) patients with the highest prevalence of COPD severity and (b) patients of older age, mostly men and the highest prevalence of diabetes, cardiovascular comorbidities and hypertension. These phenotypes were reproduced in the validation data set with 80% accuracy. Gender, COPD severity and exacerbations were the most important risk factors for lung function decline in the most common phenotype.
Conclusions
In this study, three COPD phenotypes were identified prior to patients being diagnosed with COPD. The reproducibility of those phenotypes in a blind data set following COPD diagnosis suggests their generalisability among different populations.
Keywords: COPD epidemiology, COPD exacerbations
Key messages.
What are the characteristics of patients with chronic obstructive pulmonary disease (COPD) and a fast decline in their lung function, and can they be reproduced in different populations?
In 13 260 patients with COPD, the ‘fast decliner’ was the most common phenotype, characterised by younger patients with lung function loss with an increased number of COPD exacerbations.
The ‘fast decliner’ phenotype was reproduced in an unseen data set after COPD diagnosis. The most important risk factors for lung function decline were gender, COPD severity and exacerbations.
Introduction
Chronic obstructive pulmonary disease (COPD) is a widespread group of lung diseases such as asthma, emphysema and chronic bronchitis that causes breathing difficulties as a result of fast lung function decline.1 Several studies2–5 have shown that common risk factors associated with lung function decline in patients with COPD are smoking,4 emphysema4 and severity of emphysema,3 as well COPD exacerbations2 5 along with elevated blood eosinophil counts.2 Kerkhof et al2 showed that patients with mild-to-moderate COPD with a high burden of exacerbations and elevated blood eosinophils have significant mitigation of their lung function decline when treated with inhaled corticosteroids (ICS). Despite this finding suggests that early treatment may prevent further lung function loss, the full risk profile of those patients, and their projected lung function loss, remain key issues still largely unknown and underexplored in the present literature.
In this study, we aim to tackle these issues and provide a framework to improve the characterisation of patients with COPD and a fast decline in their lung function before diagnosis. In so doing, we develop several machine learning algorithms able to predict lung function decline after diagnosis. The implementation of this approach promises to allow medical practitioners with opportunities for early intervention and prevention of lung function loss.
Methods
Study design
This study is a retrospective analysis of an observational cohort spanning through a 4 years period (2015–2018) among patients with COPD in the UK. Data were extracted from the Royal College of General Practitioners (RCGP) Research and Surveillance Centre (RSC) database,6 7 which includes more than 5 million patients, and in which over 2 million records and 500 million prescriptions (as of December 2017) are uploaded each week.8
Study population
Inclusion and exclusion criteria are shown in figure 1. The study included patients with a Read code9 for COPD diagnosis, older than 35 years, current or former smoker, without active asthma, with a forced expiratory volume in 1 s (FEV1) to forced vital capacity ratio (FEV1/FVC) of ≤0.7 (ie, the threshold for COPD diagnosis1) and who completed FEV1 records for four consecutive years. Specifically, we used FEV1 records in year 1 as a baseline, followed-up by at least 3 years of FEV1 recordings. We excluded patients younger than 35, non-smokers (as this group may be misdiagnosed with COPD and to align with National Institute for Health and Care Excellence (NICE) guidelines,10 those with active asthma and FEV1/FVC ratio of >0.7, as well as patients with less than 3 years of lung function (FEV1) values. Our inclusion and exclusion criteria yielded a total of 13 260 patients.
Figure 1.
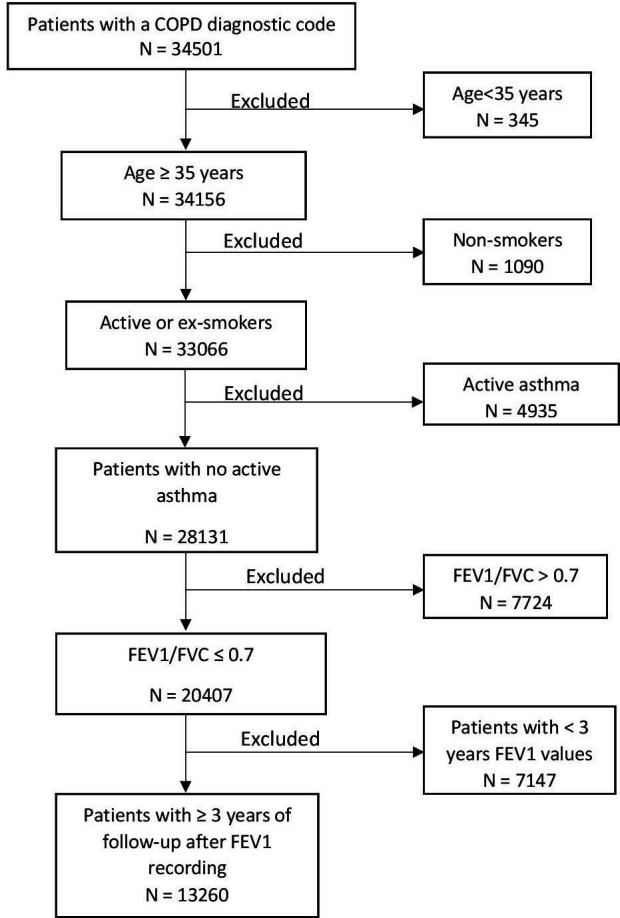
Flow chart of study cohort. COPD, chronic obstructive pulmonary disease; FEV1, forced expiratory volume in 1 s; FVC, forced vital capacity.
Statistical analysis
To identify patients with underlying COPD phenotypes we split the cohort into two groups: (a) the training data set, consisting of patients with COPD registered to a general practitioner (GP) practice before the COPD diagnosis; and (b) the validation data set that includes patients with COPD registered after their COPD diagnosis (figure 2). Thus, patients in both data sets share similar COPD-related characteristics. We divided our sample according to the COPD diagnosis date, rather than randomly, to allow our algorithms to learn patterns in the data prior to COPD diagnosis (training data set) and classify patients in an unbiased, data-driven way into clusters (phenotypes). We then used those clusters learnt in the training data set to predict new clusters for patients after COPD diagnosis (validation data set) and assessed their agreement as described below in the ‘Cluster validation after diagnosis’ section. Similarly, we trained three different regression algorithms to predict lung function decline in the training data set. We assessed their performance in the validation data set as described in the ‘Predictive models’ section.
Figure 2.

Main steps in phenotype identification before and after COPD diagnosis. COPD, chronic obstructive pulmonary disease; MCA, multiple correspondence analysis; RF, random forest.
Data reduction
The training data set was used to group patients of similar characteristics into distinct clusters (ie, COPD phenotypes) using k-means cluster analysis (ie, a method that splits the data into mutually exclusive groups). To apply k-means clustering, we standardised 19 clinically relevant variables (sex, body mass index, smoking, COPD severity, COPD exacerbations, emphysema, diabetes, hypertension, coronary artery disease, acute myocardial infarction, congestive cardiac failure, anxiety, depression and six types of treatment) into uncorrelated ones of the same scale. In other words, prior to cluster analysis, we reduced the dimensionality of the data from the 19 selected variables to three uncorrelated components that explained the most variability of the data by using multiple correspondence analysis (MCA)—the equivalent of principal components analysis for categorical data.11 Prior to this, we also imputed the missing values for the categorical variables of body mass index and COPD severity by using multivariate imputation by chained equations.12
Clustering
Given that the choice of clusters via k-means needs to be predetermined in advance, we began our clustering procedure by performing a hierarchical cluster analysis13 which does not require a predetermined number of clusters. We used the derived dendrogram to visually assess the optimal number of clusters (figure 3). This selection process implicates following the branch of the tree with the largest height (distance from top to bottom) and drawing a horizontal line (dashed line) across the other branches. The number of times in which the horizontal line intersects the branches determines the optimal number of clusters.
Figure 3.

Inspecting the number of clusters using hierarchical analysis in the training data set.
To confirm the number of clusters determined by the dendrogram’s visual inspection, we performed further statistical methods, namely the elbow14 and silhouette15 methods. The elbow method measures how close subjects are within the same cluster by minimising heterogeneity (or maximising homogeneity): A lower within cluster variation indicates good compactness. The silhouette method measures how close a subject in one cluster is to subjects in neighbouring clusters by using the average silhouette width to measure the distance between clusters. Here, the bigger the average silhouette width, the larger the distance between the clusters.
Next, we applied the k-means algorithm (figure 4) using different clusters (eg, from 1 to 10 clusters). The point beyond which a further reduction in the within the sum of squares (or increase in the average silhouette width) does not change the robustness (or separation) of clusters allowed us to determine the optimal number of clusters.
Figure 4.

Determining the optimal number of clusters in the training data set.
Intriguingly, the silhouette plots can also be used to determine the robustness of the clusters derived by using either the hierarchical or the k-means clustering method.16 In our sample, these outputs indicate that k-means should be the preferable clustering method relative to hierarchical clustering (figure 5). This is for two main reasons. First, the average silhouette width under the k-means algorithm (figure 5; bottom plot) was bigger than the one under the hierarchical algorithm (figure 5; top plot). Second, there were more subjects with negative silhouette widths under the hierarchical algorithm than the k-means clustering—especially for clusters 1 and 3—suggesting that the latter method offers more stable clusters than the former.
Figure 5.

Silhouette plots to determine the optimal clustering method—hierarchical (top) and k-means (bottom).
Predictive models
We trained three regressors (decision tree, gradient boosting machine, linear regression) to predict lung function in the validation data set. We used FEV1 as the dependent variable, and the 19 variables used in the MCA step and age as predictors. Moreover, with the R library ‘caretEnsemble’,17 we constructed two ‘ensemble models’: a linear and a random forest (RF) ensemble of the above-mentioned regressors.
All algorithms were first trained and tested on 70% and 30% of the training data sets (ie, RF train and RF test; figure 2), respectively, for finely tuning —by using automated tuning with the R library ‘caret’17—of their parameters. They were then re-trained in the full training data set and tested to assess their final performance in the blind validation data set. This was done by calculating the root mean squared error (RMSE) and mean absolute error (MAE). The former is the square root of the difference between observed and predicted values (ie, the prediction errors or residuals); it shows how far from the regression line the prediction errors are and is calculated as:
where and are the observed and predicted values, respectively.
The MAE is instead the MAE between observed and predicted values; it shows the magnitude of the prediction errors and is calculated as:
where and are the predicted and observed values, respectively.
Finally, we calculated the effect of the most important predictors on lung function decline by means of the best performing model in the validation data set (ie, the one with the lowest RMSE and MAE values).
All statistical analyses were implemented with the statistical software R.18
Patient and public involvement
Patients were not involved in the design, conduct, reporting or dissemination plans of this study.
Results
Patient characteristics
Table 1 summarises the descriptive characteristics of patients registered with a GP before and after their COPD diagnosis at the baseline (first year of the study period).
Table 1.
Baseline (year 1) demographic and clinical characteristics of patients before and after COPD diagnosis
| Variables | Prior to COPD diagnosis (n=11 482) |
After COPD diagnosis (n=1778) |
Total (n=13 260) |
| Age, mean (SD), years | 69 (10) | 70 (9) | 69 (10) |
| Sex, male, no. (%) | 6526 (57) | 1029 (58) | 7555 (57) |
| Body mass index, mean (SD), kg/m2 | 27 (6) | 27 (6) | 27 (6) |
| Body mass index, no. (%) with data | 11 409 (99) | 1759 (99) | 13 168 (99) |
| Underweight | 403 (3) | 85 (5) | 488 (4) |
| Normal weight | 4066 (36) | 643 (37) | 4709 (36) |
| Overweight | 4070 (36) | 588 (33) | 4658 (35) |
| Obese | 2870 (25) | 443 (25) | 3313 (25) |
| Smoking status, no. (%) | |||
| Active smoker | 4467 (39) | 648 (36) | 5115 (39) |
| Former smoker | 7015 (61) | 1130 (64) | 8145 (61) |
| COPD severity, no. (%) with data | 5859 (51) | 925 (52) | 6784 (51) |
| Mild | 1957 (33) | 293 (32) | 2250 (33) |
| Moderate | 2831 (48) | 433 (47) | 3264 (48) |
| Severe | 975 (17) | 177 (19) | 1152 (17) |
| Very severe | 96 (2) | 22 (2) | 118 (2) |
| COPD exacerbations in the past year, mean (SD) | 0.3 (0.9) | 0.5 (1.3) | 0.3 (1.0) |
| COPD exacerbations in the past year, no. (%) | |||
| 0 | 9736 (85) | 1395 (79) | 11 131 (84) |
| 1 | 998 (8) | 195 (11) | 1193 (9) |
| 2 | 433 (4) | 79 (4) | 512 (4) |
| >2 | 315 (3) | 109 (6) | 424 (3) |
| Forced expiratory volume in 1 s, mean (SD), L | 0.7 (0.2) | 0.7 (0.2) | 0.7 (0.2) |
| Emphysema, no. (%) | 646 (6) | 248 (14) | 894 (7) |
| Diabetes, no. (%) | 1771 (15) | 280 (16) | 2051 (16) |
| Hypertension, no. (%) | 5317 (46) | 823 (46) | 6140 (46) |
| Coronary artery disease, no. (%) | 675 (6) | 106 (6) | 781 (6) |
| Acute myocardial infarction, no. (%) | 822 (7.) | 144 (8) | 966 (7) |
| Congestive cardiac failure, no. (%) | 719 (6) | 110 (6) | 829 (6) |
| Anxiety, no. (%) | 938 (8) | 142 (8) | 1080 (8) |
| Depression, no. (%) | 3490 (30) | 582 (33) | 4072 (31) |
| Treatment, no. (%) | |||
| ICS | 5082 (44) | 1056 (59) | 6138 (46) |
| ICS+LABA | 4486 (39) | 969 (55) | 5455 (41) |
| LAMA | 5363 (47) | 985 (55) | 6348 (48) |
| LABA | 1101 (10) | 147 (8) | 1248 (9) |
| SAMA | 581 (5) | 100 (6) | 681 (5) |
| Mucolytics | 1028 (9) | 231 (13) | 1259 (10) |
COPD, chronic obstructive pulmonary disease; ICS, inhaled corticosteroids; LABA, long-acting beta agonist; LAMA, long-acting antimuscarinic; SAMA, short-acting antimuscarinic.
When looking at the association between FEV1 and the number of COPD exacerbations before and after COPD diagnosis (figure 6), the decline in lung function with an increased number of exacerbations appears to be faster in the period prior to COPD diagnosis than after diagnosis. Thus, we examined whether a similar pattern existed among the phenotypes we derived, as well as the extent of such a decline.
Figure 6.

Association between lung function and number of COPD exacerbations before and after COPD diagnosis. COPD, chronic obstructive pulmonary disease; FEV1, forced expiratory volume in 1 s.
Prior to COPD diagnosis
Table 2 presents the baseline characteristics of the three clusters of patients identified for the pre-COPD diagnosis period.
Table 2.
Baseline (year 1) phenotype characteristics prior to COPD diagnosis
| Variables | Phenotype | ||
| A (n=4339) | B (n=1040) | C (n=6103) | |
| Age, mean (SD), years | 69 (9) | 73 (8) | 68 (10) |
| Sex, male, no. (%) | 2456 (57) | 799 (77) | 3271 (54) |
| Body mass index, mean (SD), kg/m2 | 27 (6) | 29 (5) | 27 (5) |
| Body mass index, no. (%) with data | 4311 (99) | 1040 (100) | 6058 (99) |
| Underweight | 1618 (38) | 220 (21) | 2228 (37) |
| Normal weight | 1029 (24) | 381 (37) | 1460 (24) |
| Overweight | 1479 (34) | 427 (41) | 2164 (36) |
| Obese | 185 (4) | 12 (1) | 206 (3) |
| Smoking status, no. (%) | |||
| Active smoker | 1542 (36) | 306 (29) | 2619 (43) |
| Former smoker | 2797 (64) | 734 (71) | 3484 (57) |
| COPD severity, no. (%) with data | 2481 (57) | 556 (54) | 2822 (46) |
| Mild | 587 (24) | 174 (31) | 1196 (42) |
| Moderate | 1154 (46) | 316 (57) | 1361 (48) |
| Severe | 666 (27) | 62 (11) | 247 (9) |
| Very severe | 74 (3) | 4 (1) | 18 (1) |
| COPD exacerbations in the past year, mean (SD) | 0.5 (1.2) | 0.2 (0.7) | 0.1 (0.8) |
| COPD exacerbations in the past year, no. (%) | |||
| 0 | 3323 (77) | 899 (86) | 5514 (90) |
| 1 | 497 (11) | 85 (8) | 416 (7) |
| 2 | 266 (6) | 36 (4) | 131 (2) |
| >2 | 253 (6) | 20 (2) | 42 (1) |
| Forced expiratory volume in 1 s, mean (SD), L | 0.7 (0.2) | 0.7 (0.2) | 0.8 (0.2) |
| Emphysema, no. (%) | 308 (7) | 59 (6) | 279 (5) |
| Diabetes, no. (%) | 597 (14) | 382 (37) | 792 (13) |
| Hypertension, no. (%) | 1948 (45) | 703 (68) | 2666 (44) |
| Coronary artery disease, no. (%) | 33 (1) | 617 (59) | 25 (0.4) |
| Acute myocardial infarction, no. (%) | 75 (2) | 681 (66) | 66 (1) |
| Congestive cardiac failure, no. (%) | 223 (5) | 304 (29) | 192 (3) |
| Anxiety, no. (%) | 319 (7) | 101 (10) | 518 (9) |
| Depression, no. (%) | 1279 (30) | 348 (34) | 1863 (31) |
| Treatment, no. (%) | |||
| ICS | 4290 (99) | 408 (39) | 384 (6) |
| ICS+LABA | 4141 (95) | 339 (33) | 6 (0.1) |
| LAMA | 3022 (70) | 437 (42) | 1904 (31) |
| LABA | 227 (5) | 92 (9) | 780 (12.8) |
| SAMA | 206 (5) | 64(6) | 311 (5) |
| Mucolytics | 756 (17) | 108 (10) | 164 (23) |
COPD, chronic obstructive pulmonary disease; ICS, inhaled corticosteroids; LABA, long-acting beta agonist; LAMA, long-acting antimuscarinic; SAMA, short-acting antimuscarinic.
Phenotype A was characterised by a higher proportion (one-third) of severe/very severe COPD (with severity being defined by the physician) and a higher number of COPD exacerbations; almost half of them had hypertension, and one-third were depressed. Almost all patients with this phenotype were treated with ICS and a combination of ICS and LABA (long-acting beta agonist) treatment, while a considerable proportion was treated with LAMA (long-acting antimuscarinic) and mucolytics. Phenotype B was characterised by patients of an older age, a higher male majority, as well as a higher proportion of overweight patients, a high prevalence of diabetes and cardiovascular comorbidities (hypertension, coronary artery disease, acute myocardial infarction, congestive cardiac failure) and depression, but the majority of them had moderate COPD severity. Almost half of the patients in this phenotype were treated with ICS and LAMA and one-third of them with an ICS and LAMA combination. Phenotype C was characterised by patients of a younger age, more than one-third of whom were overweight, but almost half of them had moderate COPD severity. Patients in this phenotype have the lowest number of COPD exacerbations and better lung (FEV1) function, yet almost half of them had hypertension and one-third of them had depression. The most frequent treatment of those patients was LAMA and mucolytics. The most noticeable patients’ characteristics for each of the three derived phenotypes are summarised in table 3.
Table 3.
Phenotypes’ characteristics prior to COPD diagnosis
| Phenotype A | Phenotype B | Phenotype C |
| Highest prevalence of severe COPD | Older age | Younger age |
| Highest number of COPD exacerbations in the past year | Larger majority of males | Overweight (one-third) |
| Hypertension (almost half) | Overweight (almost half) | Lowest number of COPD exacerbations in the past year |
| Depression (one-third) | Highest prevalence of diabetes | Better lung function |
| Most-treated overall | Highest prevalence of cardiovascular comorbidities | Hypertension (almost half) |
| ICS (nearly all) | Hypertension (two-third) | Depression (one-third) |
| ICS+LABA (nearly all) | Coronary artery disease (more than half) | Least-treated overall |
| LAMA (large majority) | Acute myocardial infarction (more than half) | LAMA (one-third) |
| Mucolytics | Congestive cardiac failure (one-third) | Mucolytics |
| Depression (one-third) | ||
| Intermediate level of treatment | ||
| ICS (almost half) | ||
| ICS+LABA (one-third) | ||
| LAMA (almost half) |
COPD, chronic obstructive pulmonary disease; ICS, inhaled corticosteroids; LABA, long-acting beta agonist; LAMA, long-acting antimuscarinic.;
When observing the association between lung function and number of COPD exacerbations (figure 7), the fastest decline in FEV1 was observed in patients of phenotype C: Those patients were also younger, suggesting that phenotype C can resemble the clinical features of the fast decliner phenotype.2–4
Figure 7.

Association between lung function and number of exacerbations by phenotype—prior to COPD diagnosis. COPD, chronic obstructive pulmonary disease; FEV1, forced expiratory volume in 1 s.
Clusters validation after diagnosis
To validate the cluster assignments derived prior to COPD diagnosis, we developed a RF model, that used the three clusters (derived by k-means clustering) as the dependent variable and the 19 categorical variables (sex, body mass index, smoking, COPD severity, COPD exacerbations, emphysema, diabetes, hypertension, coronary artery disease, acute myocardial infarction, congestive cardiac failure, anxiety, depression and six types of treatment) and age, as independent variables.
The RF model was trained on a random sample of the training data set consisting 70% of the data (RF train data set; n=8037; figure 2) and tested on the remaining 30% of the data (RF test data set; n=3445; figure 2) for internal validation.
To improve the RF model’s performance, we used a 10-fold cross-validation method. This method involves splitting the data in 10 folds (samples): the first nine of them are used for training and one for testing. Then the next nine folds are used for training and 1 for testing and so forth until each one of the 10 folds has been used for testing. We further optimised the model’s performance by applying parameter tuning.19 This led to an (internal) accuracy of 99% for predicting the same clusters in the RF test data set.
The very same model was then trained in the full training data set (both RF train and RF test) and tested to predict cluster assignments in the blind validation data set (figure 2). The predicted clusters were compared with those of the validation data set—derived with the same approach described above for the training data set, that is, data reduction and k-means clustering—using the Adjusted Rand Index20 and Jaccard Index21 for external clustering validation (ie, measuring the extent of agreement between clusters derived by two different methods). Both indices showed an agreement of 80% between the predicted clusters using the RF model and the clusters derived using k-means clustering in the validation data set.
Predicted lung function loss after diagnosis
Given the prevalence of phenotype C in the sample and the limited literature on the fast decliner phenotype at present, we can predict the lung function of patients with this phenotype by training three regressors (decision tree, gradient boosting machine and linear regression) and a linear ensemble of those regressors in the data set prior to COPD diagnosis (figure 8).
Figure 8.
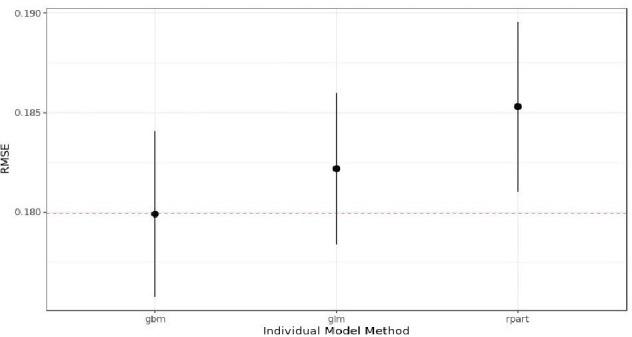
Models’ performance on training data set. The red dashed line shows the performance of the linear ensemble. RMSE, root mean squared error.
As shown in figure 8, the gradient boosting machine (gbm) performs better than the linear regression (generalised linear model (glm)) (ie, it has the lowest RMSE value) and the decision tree (rpart). Moreover, the performance of those models combined through a linear model (linear ensemble; red dashed line) is as good as the gbm model.
We then combined those three models (gbm, glm, rpart) under a RF ensemble and assessed the performance of all models after COPD diagnosis (table 4). We observe that the linear regression model performed as suitably as the gbm and the linear ensemble. In contrast, the rpart and the RF ensemble performed worst in the validation data set.
Table 4.
Models’ performance metrics on the validation data set
| RMSE | MAE | |
| Decision tree | 0.183 | 0.149 |
| Gradient boosting machine | 0.181 | 0.147 |
| Linear regression | 0.181 | 0.147 |
| Linear ensemble* | 0.181 | 0.147 |
| Random forest ensemble* | 0.188 | 0.152 |
*Ensemble of three models: decision tree, gradient boosting machine and linear regression.
MAE, mean absolute error; RMSE, root mean squared error.
Additionally, we used a more conventional linear regression to calculate the effect of the most important predictors for lung function decline (table 5) in the training data set.
Table 5.
Risk factors for lung function decline prior to COPD diagnosis
| Estimate | 95% CI | P value | % variance | |
| Sex, male* | −0.066 | −0.07 to −0.06 | <0.001 | 36 |
| COPD severity† | 18 | |||
| Moderate | −0.035 | −0.04 to −0.03 | <0.001 | |
| Severe | −0.064 | −0.07 to −0.05 | <0.001 | |
| Very severe | −0.031 | −0.06 to 0.002 | 0.075 | |
| LAMA, yes‡ | −0.037 | −0.04 to −0.03 | <0.001 | 12 |
| Age (years) | 0.0017 | 0.001 to 0.002 | <0.001 | 10 |
| COPD exacerbations in the past year§ | 9 | |||
| 1 | −0.038 | −0.05 to −0.03 | <0.001 | |
| 2 | −0.051 | −0.07 to −0.03 | <0.001 | |
| >2 | −0.078 | −0.10 to −0.05 | <0.001 | |
| LABA, yes‡ | −0.028 | −0.03 to −0.02 | <0.001 | 4 |
| Smoking¶ | 4 | |||
| Active smoker | −0.016 | −0.02 to −0.01 | <0.001 | |
| Diabetes, yes‡ | −0.024 | −0.03 to −0.02 | <0.001 | 2 |
*Reference group: Female.
†Reference group: Mild.
‡Reference group: No.
§Reference group: 0 exacerbations.
¶Reference group: Former smoker.
CI, Confidence Interval; COPD, chronic obstructive pulmonary disease; LABA, long-acting beta agonist; LAMA, long-acting antimuscarinic.
As shown in table 5, all of the above predictors explain 95% of the model’s variance. The most important predictor—that explained 36% of the variance— was sex, which was associated with a decline in lung function of 0.066 L (or 66 mL) for male compared with female patients. The second most important predictor was COPD severity, which explained 18% of the variance—where patients with moderate and severe COPD had a statistically significant lung function decline of 35 mL and 64 mL, respectively, compared with those with mild COPD. LAMA treatment was also associated with 37 mL decline in lung function as well an increased number of COPD exacerbations—ranged from 38 mL to 51 mL and 78 mL for one, two and more than two exacerbations, respectively.
The least important predictors were smoking, diabetes and LABA treatment—which explained from 2% to 4% of the variance—and predicted a lung function decline ranging from 16 mL to 24 mL and 28 mL, respectively. Age, however was associated with a statistically significant of 1.7 mL increase per year, which is not a surprising finding per se given that the fast decliner phenotype was characterised by better lung function in patients.
Discussion
This study aimed to better characterise patients with COPD—in particular patients with the ‘fast decliner’ phenotype—by means of statistical and machine learning tools. Statistical methods, such as MCA11 and cluster analysis,13–15 are traditionally used in COPD research and beyond to reduce the dimensionality of the data into few uncorrelated variables that explain most of the variability and group subjects of similar characteristics into homogeneous and distinct clusters. These methods use all patients’ information by integrating demographics along with clinical and treatment characteristics. Due to COPD heterogeneity, this integration allows for better identification and characterisation of COPD phenotypes that extends beyond the typical clinical approach (ie, following the Global Obstructive Lung Disease Initiative recommendations).22 Moreover, machine learning provides researchers and practitioners with rpart, RF and gbm models23 24 that can accommodate non-linear relationships.
Here, we applied these tools to go beyond the traditional analysis of demographic and clinical characteristics of patients with COPD to predict lung function decline after their COPD diagnosis. The strengths of our approach consist (a) using a prospective longitudinal public data set, (b) a large sample size of 13 260 patients, (c) multiple imputations for handling missing values and (d) a choice of variables to be included in cluster analysis, as well the number of clusters, by combining data-driven methods with knowledge from the existing literature and clinical expertise.
The use of a large sample size allowed us to identify three distinct clusters (ie, phenotypes) of patients with different demographic, clinical and treatment characteristics prior to COPD diagnosis able predict similar clusters of patients’ profiles post-diagnosis with an 80% agreement. This encouraging finding suggests that such phenotypes can be reproduced across different data sets and populations. Another advantage of using a large sample is the ability to split the training data set randomly (ie, prior to COPD diagnosis) into RF train and RF test subsets, train the RF model on the RF train data set and validate its predictions on the RF test data set—a process called internal validation. We further validated the phenotypes on the post COPD diagnosis data set to predict cluster assignment and compare these with those derived by the k-means method.
Moreover, the 10-fold cross-validation used when training our models (ie, rpart, RF, gbm, linear regression and ensembles), along with the tuning of the models’ parameters, improves performance and avoids overfitting—a phenomenon observed when the same model is used for both training and prediction without been tested (prior to prediction) on an unseen data set (whose observations did not contribute to its training.
Finally, we ensembled the individual models (ie, rpart, RF, gbm, linear regression) by using either a linear or a RF regressor to boost their performance. We then used the model with the best performance (ie, the linear regression) to identify the most important risk factors for lung function decline in patients with the fast decliner phenotype. Two of those predictors—COPD severity and COPD exacerbations—projected a decline in lung function of more than 30 mL, which is constant with findings of similar studies.2 25Specifically, Kerkhof et al2 used multilevel mixed-effects linear regression models to determine the association between annual exacerbation rate following initiation of ICS therapy and FEV1 decline. The authors also carried out a longitudinal study of a similar sample size to ours (n=12 178 patients with mild-to-moderate COPD) and found a decline in lung function of 19 mL/year for each exacerbation for patients with blood eosinophil counts equal to or greater than 350 cells/µL not on ICS and a reduced lung function loss that ranged from 4 mL/year to 15 mL/year for those treated with ICS. In his effort to explore the heterogeneity of COPD progression, Papi et al25 reported the variability in lung function decline from the Evaluation of COPD Longitudinally to Identify Predictive Surrogate End-point (ECLIPSE) cohort.4 In this 3-year prospective study, 38% and 31% of patients had a lung function decline of more than 40 mL/year and from 21 mL/year to 40 mL/year, respectively; 23% had a 20 mL/year decrease to 20 mL/year increase in their lung function, while just 8% had more than 20 mL/year lung function increase. In our sample—patients with the fast decliner phenotype—we observed a decrease of more than 40 mL in lung function in men (54%), those with severe COPD (9%) and those with equal to or more than two COPD exacerbations (3%); a decrease between 21 mL and 40 mL was also observed in patients with moderate or very severe COPD (49%) as well in those with one COPD exacerbation (7%), diabetes (13%) and those on LAMA (31%) and LABA (13%) treatment. We also observed a decrease in lung function of 16 mL in active smokers (43%). Furthermore, in their 5-year prospective study, Nishimura et al3 classified patients with COPD into three phenotypes based on lung function loss: the fast decliners with a decline in lung function of 63±2 mL/year, the slow decliners of a 31±1 mL decline per year and the sustainers of a 2±1 mL/year decline in their lung function. The severity of emphysema was found to be independently associated with a rapid decline in lung function.
Limitations
There are several limitations in our study, which also represent important calls for future research. One limitation relates to the quality of the available data, given that the data were collected from different GP practices with not standardised measurement processes. As such, the accuracy of respiratory values (eg, FEV1) reported may vary across practices. Moreover, by including patients with at least 3 years of spirometry follow-ups may improve the reliability of their lung function but could bias the results as patients with different follow-up times could be different. Another limitation is the lack of information on how the presence and/or the severity of emphysema was captured in our database. While the presence of emphysema in the RCGP and RSC database is recorded based on the clinician’s assessment,9 this is not sufficient to capture its severity. Had a severity score of emphysema, similar to the one calculated by Nishimura et al3—using a visual and computerised emphysema severity assessment—was available, our algorithm would be more accurate to predict the change in lung function attributed to this risk factor. A third limitation is the lack of biomarkers from the RCGP database, such as the eosinophil count which is a significant predictor in lung function decline.2 Should biomarkers be used as predictors, our regressors would be more accurate to predict lung function in a blind data set. Our sample also lacks detailed treatment information such as dosage and frequency of treatment intake. Should such information had added to our model, a GP could infer by what amount a treatment can be adjusted or how frequently should be taken to mitigate lung function loss. We, however believe that these are all important calls for future research and would be potentially tackled in the future by applying our models for prediction on other available COPD data sets, such as the Optimum Patients Care Research Database (OPCRD) database,26 which also contains a proper assessment of emphysema severity and biomarker information.
Despite the above limitations, this work represents, to the best of our knowledge, the first study—among those studies that have implemented machine learning to identify clinically meaningful COPD phenotypes27—that fully characterises patients with COPD with a fast decline in their lung function as well as predicts lung function loss. This was achieved using regressors ranging from the conventional linear regression to the most advanced rpart, RF and gbm.
First, we used k-means clustering to identify three COPD phenotypes prior to diagnosis. Next, using a RF model, we showed that these phenotypes can be reproduced in a different blind data set (after COPD diagnosis) by achieving a high level of agreement (80%) between the predicted cluster assignments to those derived by k-means clustering.
Additionally, we trained three models (rpart, gbm and glm) on the data set prior to COPD diagnosis and validated them after diagnosis to predict lung function loss after diagnosis. We further developed two ensembles models using either a linear or a RF model to improve the performance in the blind validation data set. We found that the most advanced machine learning models were as good as the linear regression model. This led us to identify several risk factors to predict lung function loss in patients with the fast decliner phenotype. Similar models can be developed for the other two phenotypes, which are included in our future research agenda.
Moving forward, we anticipate that validations of our framework in non-UK populations may help further understand individual patient lung function profiles, improve treatment decision-making in patients with COPD with major lung function decline and prevent lung function loss at an early stage.
Acknowledgments
We acknowledge patients for allowing their data to be used for surveillance and research. Practices who have agreed to be part of the RCGP RSC and allow us to extract and used health data for surveillance and research. Ms Filipa Ferreira from RCGP and Mr Julian Sherlock from the University of Surrey. Apollo Medical Systems for data extraction. Collaboration with EMIS, TPP, In-Practice and Micro-test CMR supplier for facilitating data extraction. Colleagues at Public Health England.
Footnotes
Contributors: VN is responsible for conceptualisation, data curation, formal analysis, investigation, methodology, validation, visualisation, writing of the original draft, reviewing and editing the final manuscript. SM is responsible for reviewing, writing and editing the final manuscript. WG, MF and LS are responsible for providing resources, software, supervision, validation and reviewing the manuscript. DBP is responsible for conceptualisation and reviewing the manuscript. All authors approved the final version of this manuscript and agree to be accountable for all aspects of the work. VN acts as a gaurantor of the overall content of the study.
Funding: The authors have not declared a specific grant for this research from any funding agency in the public, commercial or not-for-profit sectors.
Competing interests: VN is an employee of Parexel. SM is the director of the Organisational Neuroscience Laboratory. DBP declares advisory board membership with Aerocrine, Amgen, AstraZeneca, Boehringer Ingelheim, Chiesi, Mylan, Mundipharma, Napp Pharmaceuticals, Novartis and Teva; consultancy agreements with Almirall, Amgen, AstraZeneca, Boehringer Ingelheim, Chiesi, GlaxoSmithKline, Mylan, Mundipharma, Napp Pharmaceuticals, Novartis, Pfizer, Teva and Theravance; grants and unrestricted funding for investigator-initiated studies (conducted through Observational and Pragmatic Research Institute) from Aerocrine, AKL Research and Development, AstraZeneca, Boehringer Ingelheim, British Lung Foundation, Chiesi, Mylan, Mundipharma, Napp Pharmaceuticals, Novartis, Pfizer, Respiratory Effectiveness Group, Teva, Theravance, UK National Health Service and Zentiva; payment for lectures/speaking engagements from Almirall, AstraZeneca, Boehringer Ingelheim, Chiesi, Cipla, GlaxoSmithKline, Kyorin, Mylan, Merck, Mundipharma, Novartis, Pfizer, Skyepharma and Teva; payment for manuscript preparation from Mundipharma and Teva; payment for the development of educational materials from Mundipharma and Novartis; payment for travel/accommodation/meeting expenses from Aerocrine, AstraZeneca, Boehringer Ingelheim, Mundipharma, Napp Pharmaceuticals, Novartis and Teva; funding for patient enrolment or completion of research from Chiesi, Novartis, Teva and Zentiva; stock/stock options from AKL Research and Development, which produces phytopharmaceuticals; owns 74% of the social enterprise Optimum Patient Care (Australia and UK) and 74% of Observational and Pragmatic Research Institute (Singapore);); 5% shareholding in Timestamp, which develops adherence monitoring technology; is peer reviewer for grant committees of the Efficacy and Mechanism Evaluation programme and Health Technology Assessment; and was an expert witness for GlaxoSmithKline.
Patient and public involvement: Patients and/or the public were not involved in the design, or conduct, or reporting, or dissemination plans of this research.
Provenance and peer review: Not commissioned; externally peer reviewed.
Data availability statement
Data may be obtained from a third party and are not publicly available.
Ethics statements
Patient consent for publication
Not applicable.
Ethics approval
University of Surrey’s Institutional Review Board (353003-352994-40371074).
References
- 1.Nhs inform on chronic obstructive pulmonary disease. Available: https://www.nhsinform.scot/illnesses-and-conditions/lungs-and-airways/copd/chronic-obstructive-pulmonary-disease#about-copd [Accessed 15 Feb 2020].
- 2.Kerkhof M, Voorham J, Dorinsky P, et al. Association between COPD exacerbations and lung function decline during maintenance therapy. Thorax 2020;75:744–53. 10.1136/thoraxjnl-2019-214457 [DOI] [PMC free article] [PubMed] [Google Scholar]
- 3.Nishimura M, Makita H, Nagai K, et al. Annual change in pulmonary function and clinical phenotype in chronic obstructive pulmonary disease. Am J Respir Crit Care Med 2012;185:44–52. 10.1164/rccm.201106-0992OC [DOI] [PubMed] [Google Scholar]
- 4.Vestbo J, Edwards LD, Scanlon PD, et al. Changes in forced expiratory volume in 1 second over time in COPD. N Engl J Med 2011;365:1184–92. 10.1056/NEJMoa1105482 [DOI] [PubMed] [Google Scholar]
- 5.Kerkhof M, Voorham J, Dorinsky P, et al. The long-term burden of COPD exacerbations during maintenance therapy and lung function decline. Int J Chron Obstruct Pulmon Dis 2020;15:15. 10.2147/COPD.S253812 [DOI] [PMC free article] [PubMed] [Google Scholar]
- 6.Royal College of general practitioners (RCG) research and surveillance centre (RSC). Available: http://www.rcgp.org.uk/rsc
- 7.de Lusignan S, Correa A, Smith GE, et al. RCGP research and surveillance centre: 50 years' surveillance of influenza, infections, and respiratory conditions. Br J Gen Pract 2017;67:440–1. 10.3399/bjgp17X692645 [DOI] [PMC free article] [PubMed] [Google Scholar]
- 8.Correa A, Hinton W, McGovern A, et al. Royal College of general practitioners research and surveillance centre (RCGP RSC) sentinel network: a cohort profile. BMJ Open 2016;6:e011092. 10.1136/bmjopen-2016-011092 [DOI] [PMC free article] [PubMed] [Google Scholar]
- 9.Coded thesaurus of clinical terms. Available: https://digital.nhs.uk/services/terminology-and-classifications/read-codes [Accessed 01 Apr 2018].
- 10.NICE . Overview | chronic obstructive pulmonary disease in over 16S: diagnosis and management | guidance | NICE. Available: https://www.nice.org.uk/guidance/ng115 [Accessed : 25 Feb 2019].
- 11.Mori Y, Kuroda M, Makino N. Nonlinear principal component analysis. In: Nonlinear principal component analysis and its applications. Singapore: Springer, 2016: 7–20. [Google Scholar]
- 12.Buuren Svan, Groothuis-Oudshoorn K. mice : Multivariate Imputation by Chained Equations in R. J Stat Softw 2011;45:1–67. 10.18637/jss.v045.i03 [DOI] [Google Scholar]
- 13.Murtagh F, Legendre P. Ward’s hierarchical agglomerative clustering method: which algorithms implement Ward’s criterion? Journal of Classification 2014;31:274–95. 10.1007/s00357-014-9161-z [DOI] [Google Scholar]
- 14.Bholowalia P, Kumar A. EBK-means: a clustering technique based on elbow method and k-means in WSN. International Journal of Computer Applications 2014;105:17–24. [Google Scholar]
- 15.Rousseeuw PJ. Silhouettes: a graphical aid to the interpretation and validation of cluster analysis. J Comput Appl Math 1987;20:53–65. 10.1016/0377-0427(87)90125-7 [DOI] [Google Scholar]
- 16.Pikoula M, Quint JK, Nissen F, et al. Identifying clinically important COPD sub-types using data-driven approaches in primary care population based electronic health records. BMC Med Inform Decis Mak 2019;19:86. 10.1186/s12911-019-0805-0 [DOI] [PMC free article] [PubMed] [Google Scholar]
- 17.Deane-Mayer ZA, Knowles JE. Ensembles of Caret Models. “Package caretEnsemble”, 2019. Available: https://github.com/zachmayer/caretEnsemble
- 18.R Core Team . R: a language and environment for statistical computing. Vienna, Austria: R Foundation for Statistical Computing, 2013. http://www.R-project.org/ [Google Scholar]
- 19.Breiman L. Random forests. Mach Learn 2001;45:5–32. 10.1023/A:1010933404324 [DOI] [Google Scholar]
- 20.Steinley D. Properties of the Hubert-Arabie adjusted Rand index. Psychol Methods 2004;9:386–96. 10.1037/1082-989X.9.3.386 [DOI] [PubMed] [Google Scholar]
- 21.Fletcher S, Islam MZ. Comparing sets of patterns with the Jaccard index. Australasian Journal of Information Systems 2018;22. 10.3127/ajis.v22i0.1538 [DOI] [Google Scholar]
- 22.Global Initiative for Chronic Obstructive Lung Disease . Pocket guide to COPD diagnosis, management and prevention, report, 2019. Available: https://goldcopd.org/wp-content/uploads/2018/11/GOLD-2019-POCKET-GUIDE-FINAL_WMS.pdf [Accessed 15 February 2020].
- 23.Breiman L, Friedman JH, Olshen RA, et al. Classification and regression trees. Belmont, CA: Wadsworth. International Group 1984;432:151–66. [Google Scholar]
- 24.Friedman JH. Stochastic gradient boosting. Comput Stat Data Anal 2002;38:367–78. 10.1016/S0167-9473(01)00065-2 [DOI] [Google Scholar]
- 25.Papi A, Magnoni MS, Muzzio CC, et al. Phenomenology of COPD: interpreting phenotypes with the eclipse study. Monaldi Arch Chest Dis 2016;83:721. 10.4081/monaldi.2016.721 [DOI] [PubMed] [Google Scholar]
- 26.Clinical practice research Datalink (CPRD) and optimum patient care research database (OPCRD) http://www.cprd.com/;https://opcrd.co.uk/ http://www.cprd.com/;https://opcrd.co.uk/
- 27.Nikolaou V, Massaro S, Fakhimi M, et al. Copd phenotypes and machine learning cluster analysis: a systematic review and future research agenda. Respir Med 2020;171:106093. 10.1016/j.rmed.2020.106093 [DOI] [PubMed] [Google Scholar]
Associated Data
This section collects any data citations, data availability statements, or supplementary materials included in this article.
Data Availability Statement
Data may be obtained from a third party and are not publicly available.