Abstract
The role of B7‐H3 in acute myeloid leukemia (AML) is not fully understood. Two previous studies investigating its expression and significances in AML are partially different. In this study, we aimed to systematically characterize the genomic and immune landscape in AML patients with altered B7‐H3 expression using multi‐omics data in the public domain. We found significantly increased B7‐H3 expression in AML compared to either other hematological malignancies or healthy controls. Clinically, high B7‐H3 expression was associated with old age, TP53 mutations, wild‐type WT1 and CEBPA, and the M3 and M5 FAB subtypes. Moreover, we observed that increased B7‐H3 expression correlated significantly with a poor outcome of AML patients in four independent datasets. Gene set enrichment analysis (GSEA) revealed the enrichment of the “EMT” oncogenic gene signatures in high B7‐H3 expressers. Further investigation suggested that B7‐H3 was more likely to be associated with immune‐suppressive cells (macrophages, neutrophils, dendritic cells, and Th17 cells). B7‐H3 was also positively associated with a number of checkpoint genes, such as VISTA (B7‐H5), CD80 (B7‐1), CD86 (B7‐2), and CD70. In summary, we uncovered distinct genomic and immunologic features associated with B7‐H3 expression in AML. This may lead to a better understanding of the molecular mechanisms underlying B7‐H3 dysregulation in AML and to the development of novel therapeutic strategies.
Keywords: acute myeloid leukemia, B7‐H3, immune checkpoint, prognosis
In this paper, we found significantly increased B7‐H3 expression in AML compared to either other hematological malignancies or healthy controls. Importantly, we observed that increased B7‐H3 expression correlated significantly with a poor outcome of AML patients in four independent datasets. We also uncovered distinct genomic and immunologic features associated with B7‐H3 expression in AML.
1. INTRODUCTION
Acute myeloid leukemia (AML) is a group of heterogeneous diseases characterized by diverse cytogenetic aberrations and variable responses to therapy. Identification of essential molecular abnormalities underlying leukemogenesis could help facilitate better therapeutic decisions.
Recent progress in cancer immunology has contributed to the compelling success of immune checkpoint blockade (ICB) therapy. 1 However, sustainable responses to ICB have been observed in only a minority of patients, and the impressive success of ICB in a subset of solid tumors has yet to be translated fully to hematological malignancies. 2 , 3 , 4 Hematological malignancies, especially AML, are characterized by a distinct immune microenvironment: they have originated from bone marrow (BM) where most immune cells develop and reside, thus making them highly immunosuppressive. 5 For example, we recently reported that M2 macrophages, cells that exhibit pro‐tumor and immunosuppressive phenotypes, are preferentially enriched in AML compared with normal BM. 6 We have also identified the M2 marker CD206 as a strong predictor of adverse outcomes in AML patients. Furthermore, negative regulatory immune checkpoint molecules, such as PD‐L1, CTLA‐4, LAG‐3, TIM‐3, and IDO1, have all been demonstrated to be up‐regulated in AML and some of them may become promising therapeutic targets. 7 Therefore, more efforts are needed to understand the roles of checkpoint genes in AML.
B7‐H3, also known as CD276, is a relatively new immune checkpoint molecule belonging to the B7‐CD28 superfamily. 8 It was found to play both co‐stimulatory and co‐inhibitory roles in T‐cell‐mediated immune responses, 9 with broad expression at the mRNA level in most tissues, but with limited expression at the protein level in some immune cells. 10 , 11 Also, the expression patterns and clinical significances of B7‐H3 have been extensively studied in a wide range of solid tumors, such as lung, prostate, ovarian, pancreatic, gastric, and colorectal cancers. 12 , 13 , 14 , 15 , 16 , 17 In hematological malignancies, however, very few such studies have yet been performed. Although increased expression of B7‐H3 in AML has been reported in two previous studies, 18 , 19 their analyses were restricted to relatively small sample sizes and, to date, the genetic and transcriptional features underlying B7‐H3 alteration has not been thoroughly investigated. Moreover, it will also be interesting to examine the relationship between B7‐H3 and tumor‐infiltrating leukocytes (TILs) as well as other checkpoint genes. Therefore, in this study, drawing on rich multi‐omics data in the public domain and state‐of‐the‐art algorithms to quantify TILs (CIBERSORT and ssGSEA), 20 , 21 we aimed to validate B7‐H3 expression and its prognostic value in AML with an enlarged sample size and to systematically characterize the genomic and immune landscape in AML patients with altered B7‐H3 expression.
2. MATERIALS AND METHODS
2.1. Patients and database
Transcriptome‐wide gene expression data (RNA‐seq and RNA microarray) and DNA methylation profiling data (Reduced Representation Bisulfite Sequencing; RRBS) for over 1000 cancer cell lines were accessed from Cancer Cell Line Encyclopedia (CCLE) (https://www.broadinstitute.org/ccle). RNA‐seq data of 64 cell lines from The Human Protein Atlas (HPA) (https://www.proteinatlas.org/) were utilized to validate B7‐H3 expression patterns in cell lines. Molecular data for the TCGA LAML project, including mRNA expression (RNA‐seq and RNA microarray), copy number, mutation data, and clinical information, were downloaded from TCGA data portal (https://gdc.nci.nih.gov). The study was approved by the Washington University Human Studies Committee, and written informed consents were obtained from patients. In addition, we used six microarray data obtained from Gene Expression Omnibus (GEO) (http://www.ncbi.nlm.nih.gov/geo), under accession numbers GSE13159, GSE63270, GSE30029, GSE10358, GSE12417 (U133plus2), and GSE71014. As for the GEO datasets, all informed consents were obtained from respective cohorts. The former three datasets contain both healthy and AML samples. The latter three for which survival data were available were used to analyze the association between B7‐H3 and patient outcome. For a more detailed description of these datasets, please refer to our previous publications. 6 , 22 In case of multiple probes per gene, B7‐H3 expression was determined using a probe set with the highest mean expression.
2.2. Estimation of immune cell fractions
The relative abundances of 22 immune cell populations were estimated using CIBERSORT as previously described. 6 , 20 As CIBERSORT may not be suitable for the use of the RNA‐seq data, 23 this algorithm was exclusively applied to the TCGA microarray, GSE10358, and GSE13159 datasets. To give a more robust estimation of immune infiltration, we further collected four sets of immune gene signatures published by Angelova et al, 24 Bindea et al, 25 Charoentong et al, 26 and Senbabaoglu et al. 27 The single sample Gene Set Enrichment Analysis (ssGSEA) method, 21 as implemented in the R Bioconductor package gsva, 28 was then introduced to quantify enrichment scores of respective cell populations in each collection. ssGSEA signature scores between patients with high and low B7‐H3 expression were compared using the limma package. 29 The p values were adjusted for multiple testing using the Benjamini–Hochberg procedure. Furthermore, 20 immune cell types from the Charoentong et al collection were divided into cell types executing anti‐tumor immunity (Activated CD4 T cell, Activated CD8 T cell, Central memory CD4 T cell, Central memory CD8 T cell, Effector memory CD4 T cell, Effector memory CD8 T cell, Type 1 T helper cell, Type 17 T helper cell, Activated dendritic cell, CD56bright natural killer cell, Natural killer cell, and Natural killer T cell) and cell types executing pro‐tumor, immune suppressive functions (Regulatory T cell, Type 2 T helper cell, CD56dim natural killer cell, Immature dendritic cell, Macrophage, MDSC, Neutrophil, and Plasmacytoid dendritic cell), according to Jia et al. 30 The ssGSEA score of the respective group were summarized to represent the abundances of these two categories.
2.3. Statistical analysis and bioinformatics
Overall survival (OS) was defined as the time from the date of diagnosis to death due to any cause. Event‐free survival (EFS) was defined as the time from diagnosis to disease relapse, progression, or death due to any cause. Survival analysis was conducted in R using the “survival” library. The optimal cutoff points of B7‐H3 expression were determined by maximally selected rank statistics (maxstat) implemented in the “survminer” R package. Survival probabilities of patient groups were estimated by the Kaplan–Meier method and compared with log‐rank test.
We used Wilcoxon rank‐sum test to compare differences between two groups, or one‐way ANOVA for more than two groups, followed by multiple pairwise‐comparison using Tukey’s test. To determine statistical significance between the means of each patient group from GSE13159, we used one‐way ANOVA, since the largest standard deviation (AML, 0.94) is less than double the smallest standard deviation (normal, 0.65). Correlation between two continuous variables was computed using Spearman's rank correlation method. Differential gene expression analysis for TCGA RNA‐seq data was calculated using the raw read counts with the R/Biocondcutor package “edgeR”. 31 Gene set enrichment analysis (GSEA) was performed using GSEA v4.0 software (http://www.broad.mit.edu/gsea), with oncogenic and hallmark gene sets obtained from the Molecular Signatures Database (MSigDB). The gene sets were considered to be significantly enriched at a false discovery rate <0.25 and normalized p‐value <0.05. We applied STRING (Search Tool for the Retrieval of Interacting Genes) (http://string.embl.de/) to construct a protein–protein interaction (PPI) network of the differentially expressed genes (DEGs). We chose a confidence score >0.4 as the judgment criterion. Cytoscape visualization software (version 3.6.1) was used to present the B7‐H3‐related sub‐network.
The genetic alterations of B7‐H3 in pan‐cancers, including somatic mutations, amplification, and deep deletion were assessed through the cbioportal for Cancer Genomics (http://www.cbioportal.org). Differentially mutated genes between two cohorts were identified with the mafCompare function in “Maftools” package. 32 To detect copy number alterations (deletions and amplications) in AML patients, we analyzed filtered segmented copy number data (Affymetrix SNP 6.0 platform) using the GISTIC 2.0 algorithm. 33 Visualization was performed using the following R packages: “ggplot2”, “ggsci”, “ggpubr”, “pheatmap”, “PairViz” (for network of multiple pairwise‐comparison analysis), “circlize” (for circos plot), and “Maftools” (for forest plot and co‐onco plot). All statistical tests were two‐sided, and a p‐value less than 0.5 was considered to indicate statistical significance.
3. RESULTS
3.1. B7‐H3 expression in human cell lines
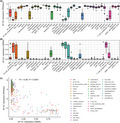
To examine the expression patterns of B7‐H3 in cancers at a large scale, we first exploited the RNA‐sequencing data of over 1,000 cell lines from the Cancer Cell Line Encyclopedia (CCLE) (https://www.broadinstitute.org/ccle). We found that B7‐H3 is robustly expressed in cell lines of solid tumors and glioma. For hematologic malignancies, the expression of B7‐H3 is relatively low and more variable, with increased expression in AML compared to other myeloid malignancies like CML and the lymphoid malignancies (Figure 1A). A similar expression pattern was observed in the RNA microarray data from CCLE (Figure S1A). These results were confirmed by analyzing the RNA‐seq data of 64 cell lines from The Human Protein Atlas (HPA) (https://www.proteinatlas.org/) (Figure S1B). Using CCLE, we then examined the DNA methylation status (Reduced Representation Bisulfite Sequencing: RRBS) of B7‐H3 across the cancer cell lines. Interestingly, B7‐H3 was found to be unmethylated in nearly all solid tumor cell lines. Aberrant methylation of B7‐H3 was detected in lymphomas and lymphoid malignancies, whereas AML showed the lowest median methylation level in all hematologic malignancies (Figure 1B). Further analysis revealed that B7‐H3 expression and methylation levels were significantly negatively correlated (Figure 1C). This negative correlation was also seen when analyzing the TCGA dataset (Figure S2). This indicated that B7‐H3 expression was potentially regulated by DNA methylation.
FIGURE 1.
The expression and methylation levels of B7‐H3 in cancer cell lines. (A) B7‐H3 mRNA expression levels (RNA‐seq data) across cancer cell lines from the Cancer Cell Line Encyclopedia (CCLE) (https://www.broadinstitute.org/ccle). (B) B7‐H3 DNA methylation levels across cancer cell lines from the Cancer Cell Line Encyclopedia (CCLE) (https://www.broadinstitute.org/ccle). (C) Correlation between B7‐H3 mRNA expression and DNA methylation levels in the CCLE datasets. (R, Spearman correlation coefficient)
3.2. Gene alterations of B7‐H3 in pan‐cancers
Next, we surveyed the genetic alterations of B7‐H3 in TCGA pan‐cancer datasets using the cbioportal for Cancer Genomics (http://www.cbioportal.org). The frequencies of genetic alterations regarding B7‐H3, including mutations, amplifications, and deletions, are shown in Figure S3A. We found that the overall genetic alteration rate of B7‐H3 in cancers appeared to be very low: it was altered in 130 of 10950 pan‐cancer patients (1.2%, Figure S3B). Kidney chromophobe demonstrated the highest frequency of B7‐H3 mutation (3.08%), followed by skin cutaneous melanoma (2.93%) and uterine corpus endometrial carcinoma (2.84%). For copy number variations (CNVs), amplifications were more commonly seen. For example, amplifications of B7‐H3 were the only genetic events in mesothelioma (3.45%) and uterine carcinosarcoma (1.75%). In AML, however, no genetic alterations of B7‐H3 were existed, suggesting DNA methylation might be the only reason for abnormal B7‐H3 expression in AML (Figure S3A).
3.3. B7‐H3 expression is elevated in AML patients
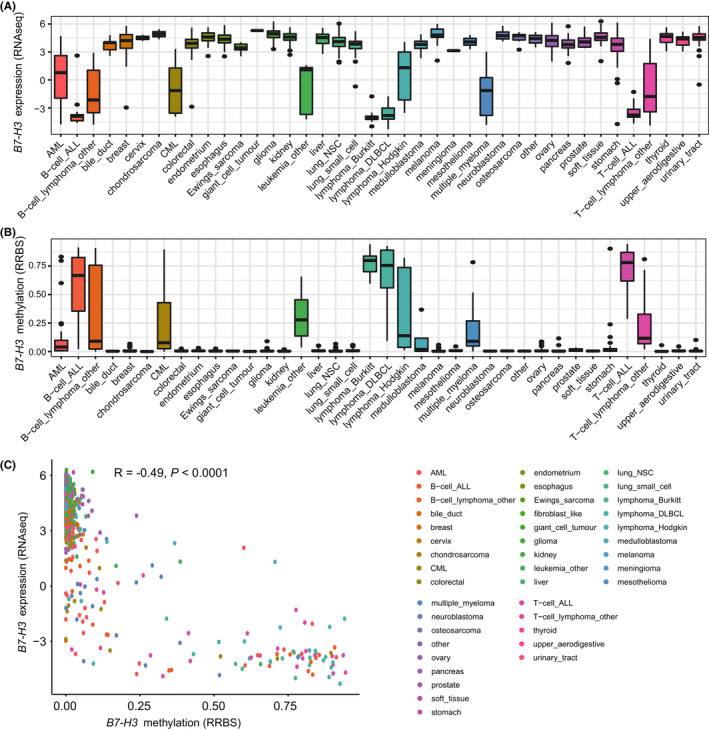
We next examined the expression of B7‐H3 in primary AML samples from patients. By analyzing the MILE dataset (GSE13159, n = 2096), we found significant differences in B7‐H3 expression across five major hematological malignancies (CML, MDS, AML, CLL, and ALL) and healthy controls (ANOVA, p < 0.0001), with the highest level observed in AML (Figure 2A). The means and standard deviations of B7‐H3 expression in each patient group were as follows: normal = 7.31 ± 0.65, CML = 7.17 ± 0.93, MDS = 7.57 ± 0.66, AML = 7.71 ± 0.94, CLL = 7.22 ± 0.9, and ALL = 7.08 ± 0.85. Patients with myeloid malignancies had higher B7‐H3 expression than that with lymphoid malignancies (Figure 2A), which agreed favorably with previous observations in cell lines. Of the pairwise between‐group comparisons, there were significant differences between AML and other four groups (p < 0.0001) and a trend toward higher B7‐H3 expression as compared with MDS (p = 0.066) (Figure 2B). Importantly, the finding that B7‐H3 was more highly expressed in AML than normal controls was separately confirmed in two independent datasets (GSE63270, n = 104; GSE30029, n = 121) (Figure 2C,D). The increased expression of B7‐H3 was also seen in leukemia stem cells (LSCs) compared with hematopoietic stem cells (HSCs) (Figure 2E).
FIGURE 2.
The expression of B7‐H3 in primary AML samples and normal controls. (A) Box plots showing the expression of B7‐H3 in five major hematological malignancies (CML, MDS, AML, CLL, and ALL) and healthy controls, using the MILE dataset (GSE13159, n = 2096). (B) Network diagram illustrating the p‐values of multiple pairwise‐comparison analysis for groups described in (A), using the “PairViz” package. (C, D, and E) Box plots showing B7‐H3 expression levels in normal controls and AML in the GSE63270 (C) and GSE30029 (D) datasets, and in hematopoietic stem cells (HSCs) and leukemia stem cells (LSCs) from the GSE63270 dataset (E). Except for GSE30029 (D), where the original data downloaded from GEO were used for visualization, data of GSE13159 and GSE63270 (A, C, and E) were log2 transformed for boxplot presentation
3.4. B7‐H3 expression correlates with distinct genomic alterations in AML
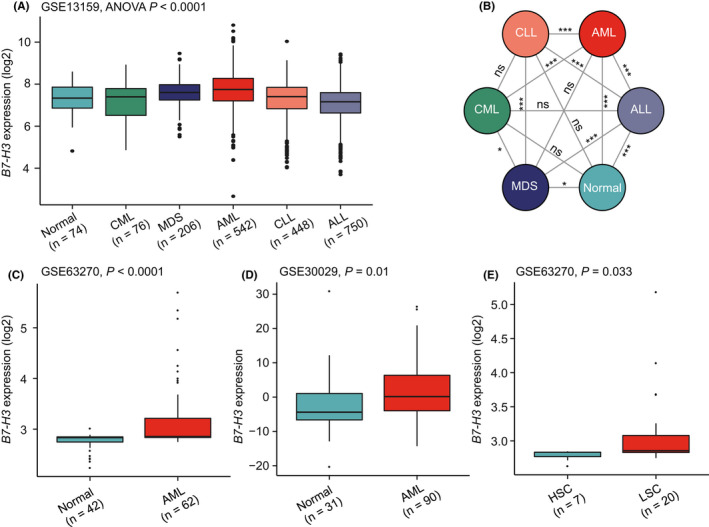
To determine whether B7‐H3 expression correlated with distinct mutational events characterized for AML. Using curated mutational data from TCGA, we compared mutation profiles between patients with high and low B7‐H3 expression (as determined by the median expression value) to detect differentially mutated genes. The results were visualized as forestplot and oncoplot (Figure 3A,B). It was found that high B7‐H3 expressers were more likely to carry TP53 mutations than low B7‐H3 expressers (12% vs. 4%, p = 0.045). Patients with low B7‐H3 expression had a higher incidence of WT1 (12% vs. 0%, p = 0.001) and CEBPA mutations (13% vs. 2%, p = 0.018) than patients with high B7‐H3 expression.
FIGURE 3.
B7‐H3 expression correlates with distinct genomic alterations in AML. (A) Forest plot showing the comparison of mutational profiles between patients with high and low B7‐H3 expression in the TCGA dataset. (B) Co‐onco plots showing the comparison of mutational profiles between patients with high and low B7‐H3 expression in the TCGA dataset. (C,D) GISTIC analyses identified recurrent copy number alterations in AML patients with high (C) and low (D) B7‐H3 expression
Regarding other clinical characteristics, patients with high B7‐H3 expression tend to be older than those with low B7‐H3 expression (median, 61 years versus 55 years, p = 0.014). B7‐H3 was more highly expressed in the M3 and M5 FAB subtypes (Figure S4), consistent with previous observations. 19 No differences were found between these two groups in terms of sex, white blood cell (WBC) count, and cytogenetic risk groups (data not shown).
Next, we performed GISTIC analyses of TCGA copy number data to identify copy number alterations in two patient groups. Overall, there was significantly fewer amplification than deletion events in both groups (Figure 3C,D). In samples with high B7‐H3 expression, recurrent alterations included the deletion of short arm of chromosome 12 (12p), which contains tumor suppressors such as CDKN1B, ETV6, DUSP16, and miR‐613. We also identified cytokine receptor genes (PLXNC1 and NR2C1) being deleted in high B7‐H3 expressers. Frequently amplified genomic regions included the oncogenic driver ERG, whose increased expression often predicts poor outcomes in AML. 34 For low B7‐H3 expressers, significantly altered regions contain quite a few non‐coding RNAs (miRNAs and lncRNAs). One alteration regards the microdeletions on 17q (17q11.2), a region where the famous tumor suppressor gene NF1 resides. 35
3.5. Distinct gene‐expression signatures associated with B7‐H3 expression in AML
To gain more biological insight in AML characterized by high B7‐H3 expression, we performed differential gene expression using the TCGA RNAseq dataset. This analysis revealed 451 up‐regulated and 240 down‐regulated genes between patients with high and low B7‐H3 expression (FDR <0.05, |log2 FC| >1.5; Figure 4A,B; Data S1). Many of the genes up‐regulated in high B7‐H3 patients were, as expected, implicated in immune response. Among them were cytokines (i.e., ADM2, AGT, BMP2, and CD70), cytokine receptors (i.e., IL17RE, IL1R1, IL1R2, and IL22RA1), and chemokines (CCL2, CCL19, CCL20, and CCL22). Notably, two expression markers of the M2 macrophages‐CD163 and CD204‐were found to be significantly associated with B7‐H3 expression. Also up‐regulated were some oncogenes, such as FGF10, MAFB, MRAS, PRDM14, TWIST1, and MMP7. Specifically, TWIST1 and MMP7 are known to be involved in epithelial‐mesenchymal transition (EMT), a key process in cancer progression. In contrast, two members of the protocadherin tumor suppressor family‐PCDH9 and PCDH10‐were down‐regulated in high B7‐H3 expressers. We then performed a gene set enrichment analysis (GSEA) by comparing transcriptomes between cases with high and low B7‐H3 expression. We found B7‐H3 was positively associated with gene signatures that are up‐regulated upon overexpression of certain oncogenes, including AKT1, CTNNB1, Cyclin D1, and MEK (Figure 4C). Genes down‐regulated in cells overexpressing ligand‐activatable oncoprotein ERBB2 and in cells treated with the angiogenic factor VEGFA were, on the contrary, negatively associated with B7‐H3 (Figure 4C). In the high‐B7‐H3 group, several cancer hallmarks including angiogenesis, apical junction, EMT, hypoxia, inflammatory response, and Wnt/beta‐catenin signaling, were significantly enriched in comparison with the low‐B7‐H3 group (Figure 4D). No significant“hallmark” gene sets/hallmark signatures were enriched in the low‐B7‐H3 group (FDR >0.25).
FIGURE 4.
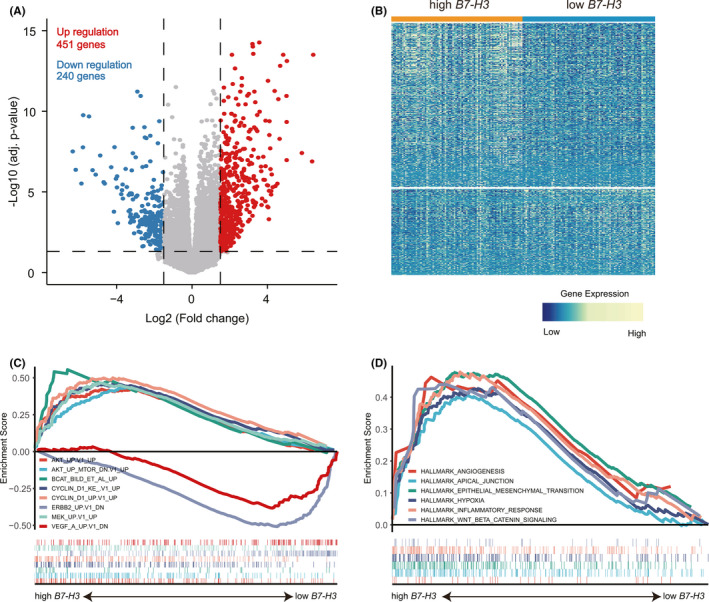
Distinct gene‐expression signatures associated with B7‐H3 expression in AML. (A,B) Volcano plot (A) and heatmap (B) showing gene expression differences between patients with low and high B7‐H3 expression. Significantly down‐regulated genes (blue points) and up‐regulated genes (red points) in patients with low B7‐H3 expression are indicated (FDR <0.05, |log2 FC| >1.5). (C,D) Gene set enrichment analysis (GSEA) of patients with low and high B7‐H3 expression, with oncogenic (C) and hallmark (D) gene sets obtained from the Molecular Signatures Database (MSigDB)
3.6. PPI analysis of B7‐H3 related DEGs
We then conducted a PPI network analysis of the 691 DEGs to explore the potential interactions among them. Choosing a median confidence score (0.4), 648 nodes and 1983 edges were obtained in the final network (Figure S5). In this PPI network, we found seven genes that are directly correlated with B7‐H3 (CD70, CXCL10, CCL2, LYVE1, TNFRSF18, TNFRSF4, and TNF) (Figure 5). Notably, all seven genes were positively correlated with B7‐H3 and were involved in immune response regulation. The genes directly interact with the seven genes were also shown in the network (Figure 5).
FIGURE 5.
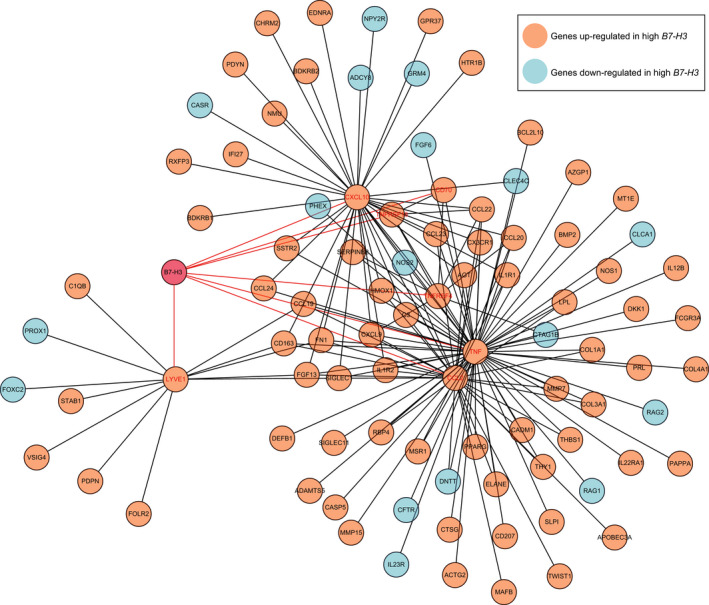
Cytoscape analysis of B7‐H3‐related sub‐network using PPI information obtained from STRING database (http://stringdb.org/). Orange represents genes up‐regulated in high B7‐H3 expressers, while blue represents genes down‐regulated in high B7‐H3 expressers. Genes directly interact with B7‐H3 were marked in red
3.7. B7‐H3 expression is associated with immune‐suppressive cell populations in AML
Since B7‐H3 has classically been implicated in immune regulation, we decided to comprehensively evaluate its relation with immune cell infiltration. The overall immune cell compositions were estimated by CIBERSORT across three datasets (TCGA microarray, GSE10358, and GSE13159), for samples with high and low B7‐H3 expression, respectively (Figure S6). We then compared the inferred relative fractions of 22 subpopulations between the high‐B7‐H3 and low‐B7‐H3 group. There were no consistent differences of these cell populations across three datasets. For example, high B7‐H3 expressers had significantly lower proportions of resting T cells CD4 memory cells in the TCGA and GSE10358 datasets, but not in the GSE13159 dataset. The opposite pattern was observed for CD8 T cells in the previous two datasets (Figure 6).
FIGURE 6.
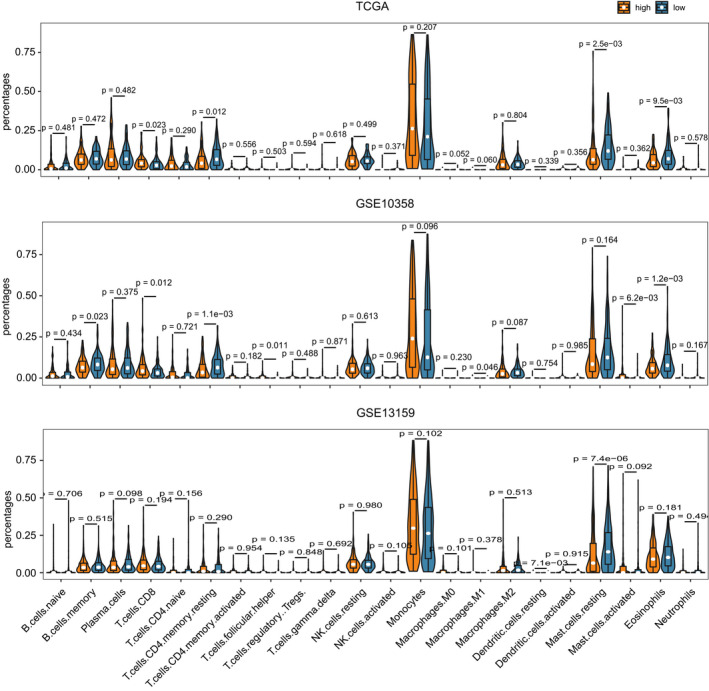
The relation between B7‐H3 expression and immune cell infiltration. Violin plot showing the differences of immune cell fractions between patients with low and high B7‐H3 expression. The overall immune cell compositions were estimated by CIBERSORT across three datasets (TCGA microarray, GSE10358, and GSE13159)
To resolve the inconsistent results obtained from CIBERSORT analyses, we further collected immune gene signatures from four studies to compute immune infiltration scores using ssGSEA. 24 , 25 , 26 , 27 Then, we compared the ssGSEA scores computed for high B7‐H3‐expressing samples with those in low B7‐H3‐expressing samples. Significant differences were found between two groups in estimates for a number of immune populations (FDR <0.05), across different gene signature and data sources (Data S2). Table 1 shows the number of differentially enriched cell populations across four gene signature sources in at least 1 dataset. Notably, there was a significant increase in several immunosuppressive cells (i.e., macrophages, neutrophils, dendritic cells, Th17 cells, CD56dim natural killer cells, and monocytes) in patients with high B7‐H3,while cells executing anti‐tumor reactivity (i.e., activated CD4 T cells, effector memory CD4 T cell, and activated CD8 T cells) were generally under‐represented (Table 1). This indicates that B7‐H3 may play a pro‐tumourigenic immune suppressive role in the tumor microenvironment.
TABLE 1.
The number of differentially enriched cell populations across four gene signature sources in at least 1 dataset (TCGA microarray, GSE10358, and GSE13159).
| Gene Signatures | Angelova | Bindea | Charoentong | Senbabaoglu | Sum |
|---|---|---|---|---|---|
| Up‐regulated in high B7‐H3 | |||||
| Macrophage | 2 | 2 | 2 | 2 | 8 |
| Neutrophil | 2 | 2 | 2 | 2 | 8 |
| Dendritic cell | 2 | 2 | 1 | 3 | 8 |
| Type 17 T helper cell | 2 | 2 | 2 | 2 | 8 |
| CD56dim natural killer cell | 1 | 1 | 2 | 1 | 5 |
| Monocytes | 1 | 0 | 3 | 0 | 4 |
| Mast cell | 1 | 0 | 2 | 0 | 3 |
| MDSC | 1 | 0 | 2 | 0 | 3 |
| Regulatory T cell | 0 | 0 | 2 | 0 | 2 |
| Down‐regulated in high B7‐H3 | |||||
| Memory B cell | 3 | 0 | 3 | 0 | 6 |
| B cell | 0 | 1 | 0 | 2 | 3 |
| T helper cell | 0 | 1 | 0 | 2 | 3 |
| Activated CD4 T cell | 1 | 0 | 1 | 0 | 2 |
| Effector memory CD4 T cell | 1 | 0 | 1 | 0 | 2 |
| Activated CD8 T cell | 1 | 0 | 0 | 0 | 1 |
| Natural killer cell | 0 | 0 | 0 | 1 | 1 |
To evaluate this hypothesis, 20 of 28 immune gene signatures published by Charoentong et al 26 were classified as “immune‐active” (n = 12) and “immune‐suppressive” (n = 8) subtype as defined by Jia Q et al. 30 We observed a strong correlation of the summarized ssGSEA scores between two immune subtypes in all three datasets (Spearman p = 0.000, Figure 7A). This is consistent with previous observation in lung cancers, which may reflect a concomitant counter‐activation of immune suppression associated with immune‐activation. Further analyses revealed that B7‐H3 expression was associated with anti‐tumor immunity in two of the three datasets (Figure 7B); however, the association between B7‐H3 expression and pro‐tumor suppression was much more significant across three datasets (Figure 7C). Overall, these results indicate that the role of B7‐H3 in AML may be more inclined to immune suppression.
FIGURE 7.
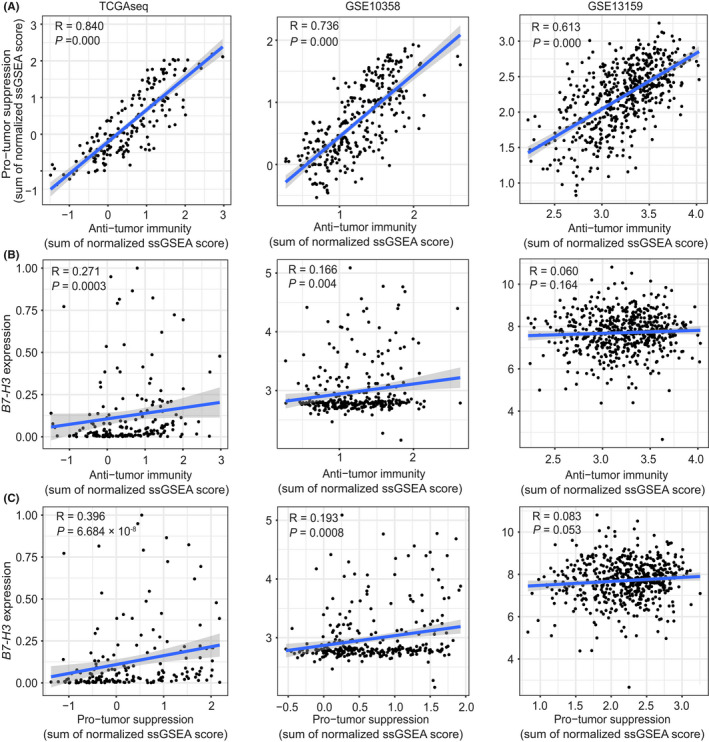
B7‐H3 expression is associated with immune‐suppressive cell populations in AML. (A) Correlation between summarized ssGSEA scores of immune subtypes executing anti‐tumor immunity (ActCD4, ActCD8, TcmCD4, TcmCD8, TemCD4, TemCD8, Th1, Th17, ActDC, CD56briNK, NK, NKT) and cell types executing pro‐tumor, immune suppressive functions (Treg, Th2, CD56dimNK, imDC, TAM, MDSC, Neutrophil, and pDC) across three datasets (TCGA microarray, GSE10358, and GSE13159). (B,C) Correlation between B7‐H3 expression and summarized ssGSEA scores of immune subtypes executing anti‐tumor immunity (B) and cell types executing pro‐tumor, immune suppressive functions (C) across three datasets (TCGA microarray, GSE10358, and GSE13159). Spearman correlations and p values are indicated. The linear models describing the correlations are depicted as blue lines
3.8. Correlation between B7‐H3 and other immune checkpoints in AML
Given that immune checkpoints have been proved to be promising therapeutic target for cancer treatment, we also evaluated the relationship between B7‐H3 and a collection of checkpoint genes describe by De Simone et al. 36 Results from Spearman correlation analysis across three datasets are given in Data S3. Nine genes were constantly associated with B7‐H3 in all three datasets as shown by Circos plots (Figure 8). Interestingly, four genes from the Tumor Necrosis Factor family‐TNFRSF4 (OX40), TNFSF9 (CD137L), TNFSF14 (LIGHT), and TNFRSF18 (GITR)‐were among the top genes that were positively correlated with B7‐H3 expression. Two other genes that showed significant positive correlations with B7‐H3 were VISTA (B7‐H5) and CD70. Notably, both preclinical models and an early clinical trial have shown that blocking CD70 in combination with hypomethylating agents as a promising and effective therapeutic strategy for AML patients. 37 , 38 Genes had constant negative correlations with B7‐H3 were CD200, CD244, and TMIGD2, in which TMIGD2 was recognized as a receptor for the recently identified B7 family member HHLA2. 39
FIGURE 8.

Correlation between B7‐H3 and other immune checkpoints in AML. (A, B, and C) TCGA microarray (A), GSE10358 (B), and GSE13159 (C) datasets
Except for VISTA (B7‐H5), no correlations were found between other B7 family checkpoints and B7‐H3, or significant correlation was only found in one or two datasets for genes including ICOSLG (B7‐H2), VTCN1 (B7‐H4), CD80 (B7‐1), and CD86 (B7‐2) (Data S3). Finally, PD‐1 and CTLA‐4, two most widely studied immune checkpoints, were found to be positively correlated with B7‐H3 expression in the GSE13159 dataset.
3.9. High expression of B7‐H3 was associated with poor outcomes in AML patients
Next, we analyzed the relevance of B7‐H3 expression to patient survival in the TCGAseq and GSE10358 datasets. The patients from each dataset were divided into two groups according to B7‐H3 expression and patients’ survival using the maxstat method. Kaplan–Meier analysis demonstrated that high B7‐H3 expression at diagnosis was significantly associated with worse OS and EFS within the whole cohort for both datasets (Figure 9A,C). A similar pattern was observed in the Kaplan–Meier curves of cytogenetically normal (CN)‐AML patients (Figure 9B,D). Importantly, these findings were further validated in two independent CN‐AML cohorts (GSE12417 [U133plus2], n = 79; GSE71014, n = 104) for OS (Figure S7). Collectively, these data indicated that B7‐H3 is a negative prognostic indicator in AML patients.
FIGURE 9.
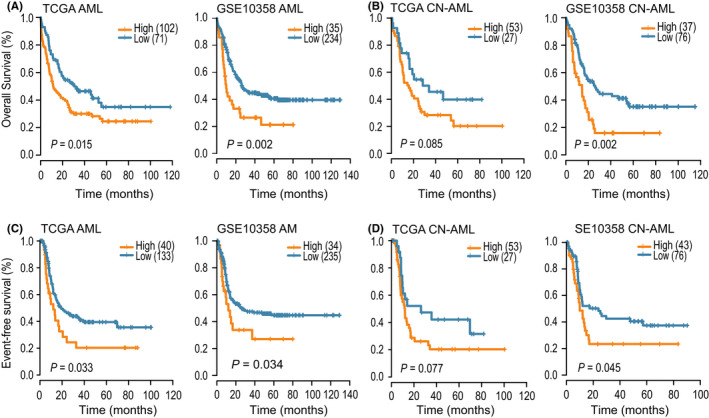
High expression of B7‐H3 was associated with poor outcomes in AML patients. (A,B) OS of the whole cohort (A) and CN‐AML (B) patients in the TCGA and GSE10358 datasets, according to B7‐H3 expression status. (C,D) EFS of the whole cohort (C) and CN‐AML (D) patients in the TCGA and GSE10358 datasets, according to B7‐H3 expression status
4. DISCUSSION
Using transcriptional data of cancer cell lines from CCLE and HPA,we demonstrated that B7‐H3 expression was relatively low in hematologic malignancies as compared with solid tumors, while AML cell lines displayed the highest expression levels among hematologic malignancies. Further analyzing over 2000 patient samples encompassing five major hematologic malignancies and normal controls, we found that B7‐H3 expression was highest in AML patients and lowest in ALL. This is consistent with previous data obtained from flow cytometry: fluorescent signals of B7‐H3 were relatively weak in lymphocytes but strong in myeloid leukemia cells. 19 Also consistent with the previous report was the observation of higher B7‐H3 expression in the M3 and M5 FAB subtypes and in patients with wild‐type CEBPA. Although our results were limited to a narrow view of B7‐H3 expression patterns in AML by focusing only mRNA levels, the strengths of our study include the large sample size and independent validation in different patient cohorts. More importantly, we think that both approaches complement and validate each other and together strongly indicate that B7‐H3 up‐regulation is a common event in AML.
Another study by Hu Y et al, 18 analyzing both mRNA and protein expression of B7‐H3 in AML, have reported somewhat inconsistent results with Guery T et al. 19 First, as opposed to Guery T et al, 19 Hu Y et al 18 did not find any differences in B7‐H3 expression among different FAB classifications. Second, while Hu Y et al 18 has reported that B7‐H3‐positive cases were more likely to have unfavorable karyotypes, no significant association between B7‐H3 and cytogenetic risk was observed by Guery T et al. 19 Lastly, Hu Y et al 18 showed that B7‐H3 expression predicts worse outcome in acute leukemia (AL); in contrast, significantly better EFS and in trend a better OS in B7‐H3‐positive patients was observed by Guery T et al. 19 Our results on the prognostic relevance are in line with Hu Y et al 18 showing that high B7‐H3 expression was associated worse clinical outcome. There are several potential explanations for the different findings with respect to the prognostic impact of B7‐H3. The two previous studies were based on smaller cohort of patients (less than 100) and shorter follow‐up time; moreover, the study by Hu Y et al 18 comprised both AML and ALL patients and the chemotherapy regimen was not indicated. Our analysis, in contrast, covers four larger patient cohorts (625 in total) with longer follow‐up data and, the prognostic value of B7‐H3 was also assessed in more uniformly treated AML patients with normal cytogenetics. Additionally, quantifying B7‐H3 expression at mRNA or protein levels might affect the prognosis assessment. Indeed, B7‐H3 protein has been demonstrated to exert both co‐inhibitory and co‐stimulatory effect in T‐cell activation, 9 thereby mediating pro‐ or anti‐tumor activities depending on the immune contexture and tumor types. The inconsistencies might also be caused by differences in age, race, and ethnic group among study cohorts, for which different genetic and environmental factors might affect the elements of cancer immunity in AML. Obviously, additional studies involving both B7‐H3 mRNA and protein expression in significantly larger cohorts are necessary to establish firmly the prognostic value of B7‐H3 in AML.
We also extended our analysis toward the genomic (point mutations and gene copy number gains or losses) and transcriptomic features associated with B7‐H3, which allowed us to gain further insight into the functional significance of B7‐H3 expression in AML. As for copy number alterations, we found that in high B7‐H3 expressers, several tumor suppressors (CDKN1B, ETV6, DUSP16, and miR‐613) was deleted, whereas the poor prognosticator ERG was amplified, indicating a potential oncogenic role for B7‐H3. More evidences were provided by genome‐wide B7‐H3‐associated gene‐expression signatures and following GSEA analysis, whereby several oncogenes and oncogenic gene signatures were significantly enriched in patients with high B7‐H3 expression. Notably, we found two genes implicated in EMT process (TWIST1 and MMP7) was significantly associated with B7‐H3 expression. GSEA analysis also revealed the enrichment of the “apical junction” and “EMT” hallmarks. EMT is a critical step driving tumor invasion and metastasis; these two processes have recently been reported as non‐immunological roles played by B7‐H3 in cancer progression. 40 , 41 In U937 AML cell line (M5 subtype), Zhang W et al have shown that B7‐H3 knockdown significantly reduced the migratory rate and invasive capacity of the cell, and also the expression of two EMT regulators (MMP‐2 and MMP‐9). 42 Importantly, we have previously demonstrated that dysregulation of EMT genes could be an early event in leukemogenesis and may have profound prognostic implications in AML. Therefore, identifying a possible interaction between B7‐H3 and the EMT program will be of particular interest in future studies.
Previously, it was found that B7‐H3 is preferentially expressed on the monocytic lineage. 19 This was consistent with the higher B7‐H3 levels their group and ours observed in patients with M5 subtypes. In accordance with these findings, we reported here that, in patients with high B7‐H3 expression, monocytes and macrophages were highly enriched. It is noteworthy that macrophages, which are differentiated from monocytes, turned out to be the top differentially infiltrated cell types (8 comparisons) across different gene signature and data sources. Furthermore, B7‐H3 was found to be positively associated with CD163 and CD204, markers of the immunosuppressive/ pro‐tumorigenic M2 macrophages. We have recently shown that M2 macrophages fractions were increased significantly in AML compared with normal controls and conferred adverse outcome in AML patients. It has also been shown that AML blasts can polarize monocytes to an M2‐like phenotype. 43 Therefore, it is reasonable to expect that B7‐H3 may be highly expressed on M2 macrophages in AML, and might also participate in M2 macrophages‐mediated pro‐tumor/immune‐suppressive activities. Clearly, future studies will be required to test these hypotheses.
Despite the breakthrough of checkpoint blockade therapy in solid tumors, its progress in the less immunogenic AML has somewhat lagged behind. Nevertheless, recent studies have shown the combination of hypomethylating agents and checkpoint inhibition as an effective strategy in treating AML. 44 This may be because hypomethylating agents can up‐regulate checkpoint genes such as PD‐1, PD‐L1, and PD‐L2 in AML patients, which in turn serve as targets for checkpoint blockade. In our analyses, we found that B7‐H3 was positively associated with a number of checkpoint genes, such as VISTA (B7‐H5), CD80 (B7‐1), CD86 (B7‐2), and CD70, indicating potential synergistic effects between these molecules. Our PPI network analysis also revealed a direct interaction between B7‐H3 and CD70, consistent with a previous report that B7‐H3 and CD70 were highly co‐expressed and up‐regulated in multiple tumor types. 45 Interestingly, a recent preclinical study has reported that combining decitabine treatment with CD70 blockade significantly reduced AML LSC frequencies both in vitro and in vivo, with HSCs only marginally affected. 37 On the other hand, B7‐H3 was reported by Hu Y et al to be preferentially expressed on CD34+ cells 18 ; we similarly demonstrated the up‐regulation of B7‐H3 in LSCs as compared to HSCs. We have also shown that B7‐H3 expression might potentially be regulated by DNA methylation. Hence, we deemed that B7‐H3 blockade as a monotherapy, or in combination with hypomethylating agents, might be a promising avenue of therapeutic intervention in AML, which deserves future preclinical and clinical investigations.
In summary, our study confirms and extends the findings of two previous studies for the expression patterns and clinical significances of B7‐H3 in AML. A key advantage of our analyses was the enlarged sample size and independent validations using different datasets. In addition, we uncovered distinct genomic and immunologic features associated with B7‐H3 expression in AML that may lead to better understanding of the molecular mechanisms underlying B7‐H3 dysregulation and to the development of novel therapeutic strategies.
ETHICS APPROVAL AND CONSENT TO PARTICIPAT
All informed consents were obtained from all patients from respective cohorts. The article was completely based on data from public sources, the ethics of public data has been established already. It was not involving our own data and patients.
DISCLOSURE STATEMENT
No potential conflicts of interest were disclosed.
Supporting information
Fig S1‐S7
Data S1
Data S2
Data S3
Zhang L‐Y, Jin Y, Xia P‐H, et al. Integrated analysis reveals distinct molecular, clinical, and immunological features of B7‐H3 in acute myeloid leukemia. Cancer Med. 2021;10:7831–7846. 10.1002/cam4.4284
Ling‐yi Zhang, Ye Jin, Pei‐hui Xia and Jiang Lin are joint first authors.
Funding information
This study was supported by the National Natural Science Foundation of China (81970118, 81900163), Medical Innovation Team of Jiangsu Province (CXTDB2017002), youth medical talents project of “Ke Jiao Qiang Wei” project of Jiangsu province (QNRC2016450), “Liu Ge Yi Gong Cheng” of Jiangsu Province (LGY2018024), Zhenjiang Clinical Research Center of Hematology (SS2018009), Social Development Foundation of Zhenjiang (SH2019065), and Scientific Research Project of The Fifth 169 Project of Zhenjiang (21).
Contributor Information
Zi‐jun Xu, Email: xuzijun1989@hotmail.com.
Hong Zhou, Email: hongzhou@ujs.edu.cn.
Jun Qian, Email: qianjun0008@sina.com.
DATA AVAILABILITY STATEMENT
The datasets analyzed in this study are available in the following open access repositories: TCGA, http://www.cbiop ortal.org, http://gdac.broad insti tute.org. GEO, https://www.ncbi.nlm.nih.gov/geo/ (GEO accession numbers: GSE13159, GSE63270, GSE30029, GSE10358, GSE12417, GSE71014).
REFERENCES
- 1. Smyth MJ, Ngiow SF, Ribas A, et al. Combination cancer immunotherapies tailored to the tumour microenvironment. Nat Rev Clin Oncol. 2015;13(3):143‐158. doi: 10.1038/nrclinonc.2015.209 [DOI] [PubMed] [Google Scholar]
- 2. Brahmer JR, Tykodi SS, Chow LQ, et al. Safety and activity of anti‐PD‐L1 antibody in patients with advanced cancer. N Engl J Med. 2012;366(26):2455‐2465. doi: 10.1056/NEJMoa1200694 [DOI] [PMC free article] [PubMed] [Google Scholar]
- 3. Topalian SL, Hodi FS, Brahmer JR, et al. Safety, activity, and immune correlates of anti‐PD‐1 antibody in cancer. N Engl J Med. 2012;366(26):2443‐2454. doi: 10.1056/NEJMoa1200690 [DOI] [PMC free article] [PubMed] [Google Scholar]
- 4. Sharma P, Hu‐Lieskovan S, Wargo JA, et al. Primary, adaptive, and acquired resistance to cancer immunotherapy. Cell. 2017;168(4):707‐723. doi: 10.1016/j.cell.2017.01.017 [DOI] [PMC free article] [PubMed] [Google Scholar]
- 5. Curran EK, Godfrey J, Kline J. Mechanisms of immune tolerance in leukemia and lymphoma. Trends Immunol. 2017;38(7):513‐525. doi: 10.1016/j.it.2017.04.004 [DOI] [PMC free article] [PubMed] [Google Scholar]
- 6. Xu ZJ, Gu Y, Wang CZ, et al. The M2 macrophage marker CD206: a novel prognostic indicator for acute myeloid leukemia. Oncoimmunology. 2020;9(1):1683347. doi: 10.1080/2162402x.2019.1683347 [DOI] [PMC free article] [PubMed] [Google Scholar]
- 7. Davidson‐Moncada J, Viboch E, Church SE, et al. Dissecting the immune landscape of acute myeloid leukemia. Biomedicines. 2018;6(4):110. doi: 10.3390/biomedicines6040110 [DOI] [PMC free article] [PubMed] [Google Scholar]
- 8. Chapoval AI, Ni J, Lau JS, et al. B7–H3: a costimulatory molecule for T cell activation and IFN‐gamma production. Nat Immunol. 2001;2:269‐274. doi: 10.1038/85339 [DOI] [PubMed] [Google Scholar]
- 9. Hofmeyer KA, Ray A, Zang X. The contrasting role of B7‐H3. Proc Natl Acad Sci USA. 2008;105(30):10277‐10278. doi: 10.1073/pnas.0805458105 [DOI] [PMC free article] [PubMed] [Google Scholar]
- 10. Suh WK, Gajewska BU, Okada H, et al. The B7 family member B7–H3 preferentially down‐regulates T helper type 1‐mediated immune responses. Nat Immunol. 2003;4(9):899‐906. doi: 10.1038/ni967 [DOI] [PubMed] [Google Scholar]
- 11. Luo L, Chapoval AI, Flies DB, et al. B7‐H3 enhances tumor immunity in vivo by costimulating rapid clonal expansion of antigen‐specific CD8+ cytolytic T cells. Journal of immunology 2004;173(9):5445‐5450. doi: 10.4049/jimmunol.173.9.5445 [DOI] [PubMed] [Google Scholar]
- 12. Sun Y, Wang Y, Zhao J, et al. B7–H3 and B7–H4 expression in non‐small‐cell lung cancer. Lung Cancer. 2006;53(2):143‐151. doi: 10.1016/j.lungcan.2006.05.012 [DOI] [PubMed] [Google Scholar]
- 13. Zang X, Thompson RH, Al‐Ahmadie HA, et al. B7–H3 and B7x are highly expressed in human prostate cancer and associated with disease spread and poor outcome. Proc Natl Acad Sci USA. 2007;104(49):19458‐19463. doi: 10.1073/pnas.0709802104 [DOI] [PMC free article] [PubMed] [Google Scholar]
- 14. Zang X, Sullivan PS, Soslow RA, et al. Tumor associated endothelial expression of B7–H3 predicts survival in ovarian carcinomas. Mod Pathol. 2010;23:1104‐1112. doi: 10.1038/modpathol.2010.95 [DOI] [PMC free article] [PubMed] [Google Scholar]
- 15. Yamato I, Sho M, Nomi T, et al. Clinical importance of B7–H3 expression in human pancreatic cancer. Br J Cancer. 2009;101:1709‐1716. doi: 10.1038/sj.bjc.6605375 [DOI] [PMC free article] [PubMed] [Google Scholar]
- 16. Wu CP, Jiang JT, Tan M, et al. Relationship between co‐stimulatory molecule B7‐H3 expression and gastric carcinoma histology and prognosis. World J Gastroenterol. 2006;12(3):457‐459. doi: 10.3748/wjg.v12.i3.457 [DOI] [PMC free article] [PubMed] [Google Scholar]
- 17. Sun J, Chen LJ, Zhang GB, et al. Clinical significance and regulation of the costimulatory molecule B7–H3 in human colorectal carcinoma. Cancer Immunol Immunother. 2010;59(8):1163‐1171. doi: 10.1007/s00262-010-0841-1 [DOI] [PMC free article] [PubMed] [Google Scholar]
- 18. Hu Y, Lv X, Wu Y, et al. Expression of costimulatory molecule B7–H3 and its prognostic implications in human acute leukemia. Hematology. 2015;20(4):187‐195. doi: 10.1179/1607845414y.0000000186 [DOI] [PubMed] [Google Scholar]
- 19. Guery T, Roumier C, Berthon C, et al. B7–H3 protein expression in acute myeloid leukemia. Cancer Med. 2015;4(12):1879‐1883. doi: 10.1002/cam4.522 [DOI] [PMC free article] [PubMed] [Google Scholar]
- 20. Newman AM, Liu CL, Green MR. Robust enumeration of cell subsets from tissue expression profiles. Nat Methods. 2015;12(5):453‐457. doi: 10.1038/nmeth.3337 [DOI] [PMC free article] [PubMed] [Google Scholar]
- 21. Barbie DA, Tamayo P, Boehm JS, et al. Systematic RNA interference reveals that oncogenic KRAS‐driven cancers require TBK1. Nature. 2009;462(7269):108‐112. doi: 10.1038/nature08460 [DOI] [PMC free article] [PubMed] [Google Scholar]
- 22. Xu ZJ, Ma JC, Zhou JD, et al. Reduced protocadherin17 expression in leukemia stem cells: the clinical and biological effect in acute myeloid leukemia. J Transl Med. 2019;17(1):102. doi: 10.1186/s12967-019-1851-1 [DOI] [PMC free article] [PubMed] [Google Scholar]
- 23. Tamborero D, Rubio‐Perez C, Muiños F, et al. A pan‐cancer landscape of interactions between solid tumors and infiltrating immune cell populations. Clin Cancer Res. 2018;24(15):3717‐3728. doi: 10.1158/1078-0432.ccr-17-3509 [DOI] [PubMed] [Google Scholar]
- 24. Angelova M, Charoentong P, Hackl H, et al. Characterization of the immunophenotypes and antigenomes of colorectal cancers reveals distinct tumor escape mechanisms and novel targets for immunotherapy. Genome Biol. 2015;16:64. doi: 10.1186/s13059-015-0620-6 [DOI] [PMC free article] [PubMed] [Google Scholar]
- 25. Bindea G, Mlecnik B, Tosolini M, et al. Spatiotemporal dynamics of intratumoral immune cells reveal the immune landscape in human cancer. Immunity. 2013;39(4):782‐795. doi: 10.1016/j.immuni.2013.10.003 [DOI] [PubMed] [Google Scholar]
- 26. Charoentong P, Finotello F, Angelova M, et al. Pan‐cancer immunogenomic analyses reveal genotype‐immunophenotype relationships and predictors of response to checkpoint blockade. Cell Rep. 2017;18(1):248‐262. doi: 10.1016/j.celrep.2016.12.019 [DOI] [PubMed] [Google Scholar]
- 27. Şenbabaoğlu Y, Gejman RS, Winer AG, et al. Tumor immune microenvironment characterization in clear cell renal cell carcinoma identifies prognostic and immunotherapeutically relevant messenger RNA signatures. Genome Biol. 2016;17(1):231. doi: 10.1186/s13059-016-1092-z [DOI] [PMC free article] [PubMed] [Google Scholar]
- 28. Hänzelmann S, Castelo R, Guinney J. GSVA: gene set variation analysis for microarray and RNA‐seq data. BMC Bioinformatics. 2013;14(1):7. doi: 10.1186/1471-2105-14-7 [DOI] [PMC free article] [PubMed] [Google Scholar]
- 29. Ritchie ME, Phipson B, Wu D, et al. Limma powers differential expression analyses for RNA‐sequencing and microarray studies. Nucleic Acids Res. 2015;43(7):e47. doi: 10.1093/nar/gkv007 [DOI] [PMC free article] [PubMed] [Google Scholar]
- 30. Jia Q, Wu W, Wang Y, et al. Local mutational diversity drives intratumoral immune heterogeneity in non‐small cell lung cancer. Nat Commun. 2018;9(1):5361. doi: 10.1038/s41467-018-07767-w [DOI] [PMC free article] [PubMed] [Google Scholar]
- 31. Robinson MD, McCarthy DJ, Smyth GK. edgeR: a Bioconductor package for differential expression analysis of digital gene expression data. Bioinformatics. 2010;26(1):139‐140. doi: 10.1093/bioinformatics/btp616 [DOI] [PMC free article] [PubMed] [Google Scholar]
- 32. Mayakonda A, Lin DC, Assenov Y, et al. Maftools: efficient and comprehensive analysis of somatic variants in cancer. Genome Res. 2018;28(11):1747‐1756. doi: 10.1101/gr.239244.118. [DOI] [PMC free article] [PubMed] [Google Scholar]
- 33. Mermel CH, Schumacher SE, Hill B, et al. GISTIC2.0 facilitates sensitive and confident localization of the targets of focal somatic copy‐number alteration in human cancers. Genome Biol. 2011;12(4):R41. doi: 10.1186/gb-2011-12-4-r41 [DOI] [PMC free article] [PubMed] [Google Scholar]
- 34. Marcucci G, Baldus CD, Ruppert AS, et al. Overexpression of the ETS‐related gene, ERG, predicts a worse outcome in acute myeloid leukemia with normal karyotype: a Cancer and Leukemia Group B study. J Clin Oncol. 2005;23(36):9234‐9242. doi: 10.1200/jco.2005.03.6137. [DOI] [PubMed] [Google Scholar]
- 35. Dorschner MO, Sybert VP, Weaver M, et al. NF1 microdeletion breakpoints are clustered at flanking repetitive sequences. Hum Mol Genet. 2000;9(1):35‐46. doi: 10.1093/hmg/9.1.35. [DOI] [PubMed] [Google Scholar]
- 36. De Simone M, Arrigoni A, Rossetti G, et al. Transcriptional landscape of human tissue lymphocytes unveils uniqueness of tumor‐infiltrating T regulatory cells. Immunity. 2016;45(5):1135‐1147. doi: 10.1016/j.immuni.2016.10.021. [DOI] [PMC free article] [PubMed] [Google Scholar]
- 37. Hinterbrandner M, Kallen NM, Lüthi U, et al. Blocking CD70/CD27 signaling in combination with hypomethylating agents eradicates human CD34+ AML stem and progenitor cells in vitro and in vivo. Blood. 2017;130:2652. doi: 10.1182/blood.V130.Suppl_1.2652.2652 [DOI] [Google Scholar]
- 38. Ochsenbein AF, Riether C, Bacher U, et al. Argx‐110 targeting CD70, in combination with azacitidine, shows favorable safety profile and promising anti‐leukemia activity in newly diagnosed AML patients in an ongoing phase 1/2 clinical trial. Blood. 2018;132:2680. doi: 10.1182/blood-2018-99-118302 [DOI] [Google Scholar]
- 39. Janakiram M, Chinai JM, Zhao A, et al. HHLA2 and TMIGD2: new immunotherapeutic targets of the B7 and CD28 families. Oncoimmunology. 2015;4:e1026534. doi: 10.1080/2162402x.2015.1026534 [DOI] [PMC free article] [PubMed] [Google Scholar]
- 40. Wang J, Chong KK, Nakamura Y, et al. B7–H3 associated with tumor progression and epigenetic regulatory activity in cutaneous melanoma. J Invest Dermatol. 2013;133(8):2050‐2058. doi: 10.1038/jid.2013.114 [DOI] [PMC free article] [PubMed] [Google Scholar]
- 41. Wang L, Zhang Q, Chen W, et al. B7–H3 is overexpressed in patients suffering osteosarcoma and associated with tumor aggressiveness and metastasis. PLoS One. 2013;8(8):e70689. doi: 10.1371/journal.pone.0070689 [DOI] [PMC free article] [PubMed] [Google Scholar]
- 42. Zhang W, Wang J, Wang Y, et al. B7–H3 silencing by RNAi inhibits tumor progression and enhances chemosensitivity in U937 cells. OncoTargets Ther. 2015;8:1721‐1733. doi: 10.2147/ott.s85272 [DOI] [PMC free article] [PubMed] [Google Scholar]
- 43. Mussai F, De Santo C, Abu‐Dayyeh I, et al. Acute myeloid leukemia creates an arginase‐dependent immunosuppressive microenvironment. Blood. 2013;122(5):749‐758. doi: 10.1182/blood-2013-01-480129 [DOI] [PMC free article] [PubMed] [Google Scholar]
- 44. Boddu P, Kantarjian H, Garcia‐Manero G, et al. The emerging role of immune checkpoint based approaches in AML and MDS. Leuk Lymphoma. 2018;59(4):790‐802. doi: 10.1080/10428194.2017.1344905 [DOI] [PMC free article] [PubMed] [Google Scholar]
- 45. Yang M, Tang X, Zhang Z, et al. Tandem CAR‐T cells targeting CD70 and B7–H3 exhibit potent preclinical activity against multiple solid tumors. Theranostics. 2020;10(17):7622‐7634. doi: 10.7150/thno.43991 [DOI] [PMC free article] [PubMed] [Google Scholar]
Associated Data
This section collects any data citations, data availability statements, or supplementary materials included in this article.
Supplementary Materials
Fig S1‐S7
Data S1
Data S2
Data S3
Data Availability Statement
The datasets analyzed in this study are available in the following open access repositories: TCGA, http://www.cbiop ortal.org, http://gdac.broad insti tute.org. GEO, https://www.ncbi.nlm.nih.gov/geo/ (GEO accession numbers: GSE13159, GSE63270, GSE30029, GSE10358, GSE12417, GSE71014).


