

Abstract
Per- and poly-fluoroalkyl substances (PFAS) adsorb at air-water interfaces during transport in unsaturated porous media. This can cause surfactant-induced flow and enhanced retention that is a function of concentration, which complicates characterization and modeling of PFAS transport under unsaturated conditions. The influence of surfactant-induced flow and nonlinear air-water interfacial adsorption (AWIA) on PFAS transport was investigated with a series of miscible-displacement transport experiments conducted with a several-log range in input concentrations. Perfluorooctane sulfonic acid (PFOS), perfluorooctanoic acid (PFOA), and ammonium perfluoro 2-methyl-3-oxahexanoate (GenX) were used as model PFAS. The results were interpreted in terms of critical reference concentrations associated with PFAS surface activities and their relationship to the relevancy of transport processes such as surfactant-induced flow and nonlinear AWIA for concentration ranges of interest. Analysis of the measured transport behavior of PFAS under unsaturated-flow conditions demonstrated that AWIA was linear when the input concentration was sufficiently below the critical reference concentration. This includes the absence of significant shelf-sharpening and extended elution tailing of the breakthrough curves, as well as the similarity of retardation factors measured for a wide range of input concentrations. Independently-predicted simulations produced with a comprehensive flow and transport model that accounts for transient variably-saturated flow, surfactant-induced flow, nonlinear rate-limited solid-phase sorption, and nonlinear rate-limited AWIA provided excellent predictions of the measured transport. A series of simulations was conducted with the model to test the specific impact of various processes potentially influencing PFOS transport. The simulation results showed that surfactant-induced flow was negligible and that AWIA was effectively linear when the input concentration was sufficiently below the critical reference concentration. PFAS retention associated with AWIA can be considered to be ideal in such cases, thereby supporting the use of simplified mathematical models. Conversely, apparent nonideal transport behavior was observed for experiments conducted with input concentrations similar to or greater than the critical reference concentration.
Keywords: PFOS, PFOA, transport, adsorption, per- and polyfluoroalkyl substances
Graphical Abstract

1. Introduction
Per- and poly-fluoroalkyl substances (PFAS) have been identified as emerging contaminants of critical concern due to their ubiquitous presence, recalcitrance, and potential ecological and human-health impacts. It is now clearly established that soil serves as a long-term source for many sites contaminated by per- and poly-fluoroalkyl substances (PFAS). This has been demonstrated by field-sampling surveys and mathematical-modeling studies (e.g., Washington et al., 2010; Shin et al., 2011; Xiao et al., 2015; Anderson et al., 2016; Rankin et al., 2016; Weber et al., 2017; Anderson et al., 2019; Dauchy et al., 2019; Washington et al., 2019; Brusseau et al., 2020a; Guo et al., 2020). Hence, there is great interest in the transport behavior of PFAS in the vadose zone, which can be considerably more complex than in groundwater.
One primary source of complexity is that flow and transport occur under water-unsaturated conditions. This condition introduces two important processes that can impact the transport of PFAS in the vadose zone. Both processes are associated with the accumulation or adsorption of PFAS at air-water interfaces created under unsaturated conditions.
First, adsorption of surfactants and other matter at the air-water interface can alter surface tensions, which can affect capillary pressure and in turn impact water flow (i.e., surfactant-induced flow), depending upon extant conditions. Concomitantly, the changes in water flow will impact the advective-dispersive transport of solute. In addition, the change in the local water saturation caused by surfactant-induced flow causes a change in the magnitude of air-water interfacial area, which will impact the magnitude of solute retained by adsorption at the air-water interface. Thus, surfactant-induced flow can have multiple impacts on the retention and transport of surfactants. This has been demonstrated through laboratory experiments and mathematical modeling for both hydrocarbon surfactants (e.g., Mingorance et al., 2007; Costanza-Robinson et al., 2012; Karagunduz et al., 2015; Costanza-Robinson and Henry, 2017; El Ouni et al., 2021) and PFAS (e.g., Brusseau et al., 2020b; Guo et al., 2020).
Second, adsorption at the air-water interface provides a source of retention that can significantly impact PFAS transport, depending on a number of factors. The impact of air-water interfacial adsorption on PFAS transport in unsaturated porous media has been demonstrated in several studies employing miscible-displacement experiments (Lyu et al., 2018; Brusseau et al., 2019a, 2020b; Brusseau, 2020; Lyu and Brusseau, 2020; Yan et al., 2020; Li et al., 2021). The potential importance of air-water interfacial adsorption for PFAS transport has also been indicated in a number of theoretical (Brusseau, 2018; Brusseau, 2019a; Constanza et al., 2019; Silva et al., 2019) and mathematical-modeling (Brusseau et al., 2019b; Brusseau, 2020; Guo et al., 2020; Silva et al., 2020) studies. The transport of PFAS undergoing air-water interfacial adsorption (AWIA) is complicated by the nonlinearity of the process, wherein the effective AWIA coefficient is a function of aqueous concentration.
A key aspect with regard to characterizing and simulating the transport of PFAS in unsaturated porous media is the extent to which surfactant-induced flow and the nonlinearity of AWIA impact transport under relevant conditions and for concentration ranges of interest. The question of the nonlinearity of PFAS AWIA has been the focus of recent research and discussion (Brusseau, 2018, 2019b, 2021; Lyu et al., 2018; Schaefer et al., 2019, 2020; Arshadi et al., 2020). For example, Brusseau and colleagues have investigated the concentration dependency of AWIA coefficients (Kia) using both transport-measured and directly-measured adsorption data (Lyu et al., 2018; Brusseau, 2021). Another example relates to discussions of the representativeness of Langmuir versus Freundlich isotherms for characterizing AWIA of PFAS (Schaefer et al., 2019, 2020; Arshadi et al., 2020). The impact of surfactant-induced flow on PFAS transport has just begun to receive attention (Brusseau et al., 2020b; Guo et al., 2020).
The occurrence of surfactant-induced flow and nonlinear AWIA have significant consequences for PFAS transport, both for characterizing magnitudes of retention and for the complexity of mathematical models required for simulating transport. Therefore, it is a critical question to address. This study is the first to systematically examine the issue with a combination of transport experiments and mathematical modeling.
The objective of this research is to investigate the influence of surfactant-induced flow and nonlinear AWIA on PFAS transport. Miscible-displacement transport experiments are conducted at different input concentrations to provide direct experimental observations of PFOS and PFOA transport under unsaturated conditions. The input concentrations span several orders of magnitude, representing the largest range of concentrations employed to date in a transport study. A comprehensive flow and transport model (Guo et al., 2020) that accounts for nonsteady flow, surfactant-induced flow, nonlinear rate-limited solid-phase sorption, and nonlinear rate-limited AWIA is used to produce independently-predicted simulations of the measured data. A second mathematical model (Brusseau, 2020) that does not consider surfactant-induced flow and for which simulations are conducted with AWIA treated as linear and instantaneous is used to test the robustness of a simplified modeling approach. The results are interpreted in terms of critical reference concentrations associated with PFAS surface activities and their relationship to the relevancy of transport processes such as nonlinear AWIA and surfactant-induced flow for concentration ranges of interest.
2. Materials and Methods
Surface tensions were measured to characterize surface activities and to determine critical reference concentrations of the PFAS. Measurement and data-analysis methods are presented in the Supporting Information (SI) file. Miscible-displacement transport experiments were conducted with PFOS and PFOA. The same input concentrations were used for the PFOS and PFOA experiments, 0.1, 1, and 10 mg/L. Additional experiments were conducted with PFOA using two lower concentrations of 1 and 10 μg/L.. The experiments were conducted using a 0.35-mm diameter natural quartz sand. An electrolyte solution comprised of 0.01 M NaCl was used for all experiments. The sand and electrolyte were selected to be consistent with materials used in prior PFAS transport experiments. Numerous measurements of air-water interfacial area have been reported for this medium (Araujo et al., 2015; Brusseau et al., 2015; El Ouni et al., 2021; Brusseau, 2021).
Nonreactive tracer tests were conducted to characterize the hydrodynamic conditions of the packed columns. Transport experiments were conducted under saturated-flow conditions to characterize solid-phase sorption. Experiments were then conducted under steady unsaturated-flow conditions to characterize the impact of AWIA on retention and transport. All experiments except one were conducted with a water saturation of ~0.68. The methods used for the miscible-displacement experiments are the same as those used in our prior PFAS transport studies (Lyu et al., 2018; Brusseau et al., 2019a; Yan et al., 2020). Additional information about the experiment methods is provided in the SI.
Effluent samples were collected continuously for the miscible-displacement experiments using a fraction collector. The samples were weighed to quantify water discharge, and then subject to chemical analysis to determine concentrations. The PFAS samples were analyzed by two methods. Samples for all experiments except those for PFOS with input concentration of 10 mg/L were analyzed by high-performance liquid chromatography tandem mass spectrometry. The samples for PFOS experiments conducted with an input concentration of 10 mg/L were analyzed by methylene blue active substances assay. Details of the chemical-analysis methods are provided in the SI file.
Breakthrough curves were measured for each miscible-displacement experiment. The effluent volumetric discharge was divided by the resident water volume of the packed column to obtain pore volumes (nondimensional time). The effluent concentrations were divided by the input concentration to obtain relative concentrations. Measured retardation factors were determined for each breakthrough curve by the standard methods of calculating the area above the breakthrough curve (frontal analysis) and temporal moment analysis. These methods have been demonstrated to be robust for PFAS applications (Brusseau et al., 2019b; Van Glubt et al., 2021).
The measured data generated in the present study for PFOA transport are combined with the results of our prior studies (Lyu et al., 2018; Lyu and Brusseau, 2020). A data set for GenX transport reported in Yan et al. (2020) is also used for comparison. The same sand and experiment methods were used for all studies. Data have been measured for PFOS, PFOA, and GenX sorption by the sand in our prior studies (Yan et al., 2020; Van Glubt et al., 2021). In addition, a data set for PFOA transport in a similar sand reported recently is used for comparison (Li et al., 2021). The Li et al. study examined PFOA transport under unsaturated conditions (water saturation of 0.64) for two sets of ionic compositions, NaCl and CaCl2, with three ionic strengths for each (0.0015, 0.01, and 0.03 M).
The retardation factor (R) for aqueous phase transport of solute undergoing retention by adsorption to solid−water and air−water interfaces is given as (Lyu et al., 2018):
| (1) |
where Kd is the solid-phase adsorption coefficient (cm3/g), Aia is the specific air−water interfacial area (cm2/cm3), ρb is porous-medium bulk density (g/cm3), and θw is volumetric water content (volume of water per volume of porous medium,-). θa is volumetric air content (−) and n is porosity, by phase balance, θw + θa = n. Water saturation is defined as Sw= θw/n. The fraction of the measured total retention associated with adsorption at the air−water interface is determined as:
| (2) |
Measured Kia values are determined from the miscible-displacement experiments by rearranging equation 2, with R obtained from analysis of the breakthrough curve and all other variables determined independently: . Values for Aia for the sand have been measured in our prior studies, as compiled by Brusseau (Brusseau, 2021).
Two mathematical models were employed for this study. The first is a one-dimensional numerical model that couples transient, variably saturated flow and advective and dispersive transport (Guo et al., 2020). The model accounts for surfactant-induced flow, nonlinear rate-limited solid-phase sorption, and nonlinear rate-limited air-water interfacial adsorption. The second model does not incorporate transient or surfactant-induced flow, but does account for nonlinear rate-limited solid-phase sorption, and nonlinear rate-limited air-water interfacial adsorption (Brusseau, 2020). The equations and solutions used for both models are reported in the respective citations. Both models are used in a predictive mode, with values for all input variables determined independently. The sources of the input values are discussed in the SI.
3. Results and Discussion
3.1. Surface Tensions and Critical Reference Concentrations
The surface tensions of PFOS, PFOA, and GenX as a function of aqueous concentration are presented in Figure SI-1. The surface activities are a function of chain length, as expected and as demonstrated in numerous prior studies. Good replication is obtained for PFOS, with a 95% measurement uncertainty of ~14% for Kia. These data are used to determine γ-C and Kia functions for use in the mathematical modeling. For comparison, maximum Kia values of 0.027, 0.0037, and 0.001 cm are calculated for PFOS, PFOA, and GenX, respectively. The differences in the magnitudes of the values reflect the differences in surface activity.
The concept of critical reference concentrations and how they can be used to evaluate the potential for specific processes to influence PFAS transport was recently introduced (Brusseau, 2019b, 2021; Brusseau and Van Glubt, 2021). In terms of surface-tension data, the critical reference concentration is determined from the inflection point of the surface-tension curves. The respective concentrations are approximately 1, 10, and 30 mg/L for PFOS, PFOA, and GenX, based on the concentrations at which the surface tensions are reduced by 2.5% (Brusseau and Van Glubt, 2021). Kia values determined from surface-tension data would represent essentially maximum values for target concentrations below these critical reference concentrations (Brusseau, 2019b, 2021). As such, AWIA is anticipated to be effectively linear for PFAS transport at such concentrations. The nonlinearity of AWIA under transport conditions will be investigated in the following sections by examining the measured and simulated PFAS transport behavior observed for the miscible-displacement experiments.
3.2. Measured Transport Data
The transport of the nonreactive tracer under unsaturated-flow conditions was observed to be relatively ideal (data not shown), consistent with our prior studies (Lyu et al., 2018; Brusseau et al., 2019a; Yan et al., 2020). Representative breakthrough curves measured for transport of PFOA, PFOS, and GenX in columns packed with unsaturated sand are presented in Figures 1–4 and SI-3-5. The magnitude of retention is greater under unsaturated-flow conditions compared to saturated conditions (data not shown) due to the impact of AWIA. The effluent recoveries for the experiments averaged 99.4% (±4.3, 95% confidence interval). The Kia values determined from the retardation factors measured by moment analysis of the breakthrough curves are similar to the values determined from the surface-tension data. This is consistent with our prior studies (Lyu et al., 2018; Brusseau et al., 2019a; Brusseau, 2021).
Fig. 1.

Measured and simulated breakthrough curves for PFOA transport in unsaturated sand for an input concentration (C0) of 10 μg/L. The solid line represents an independently predicted simulation of transport (no calibration) produced with the comprehensive model of Guo et al (2020). Directly-measured neutron-reflectometry data are used to determine the air-water interfacial adsorption coefficient.
Fig. 4.
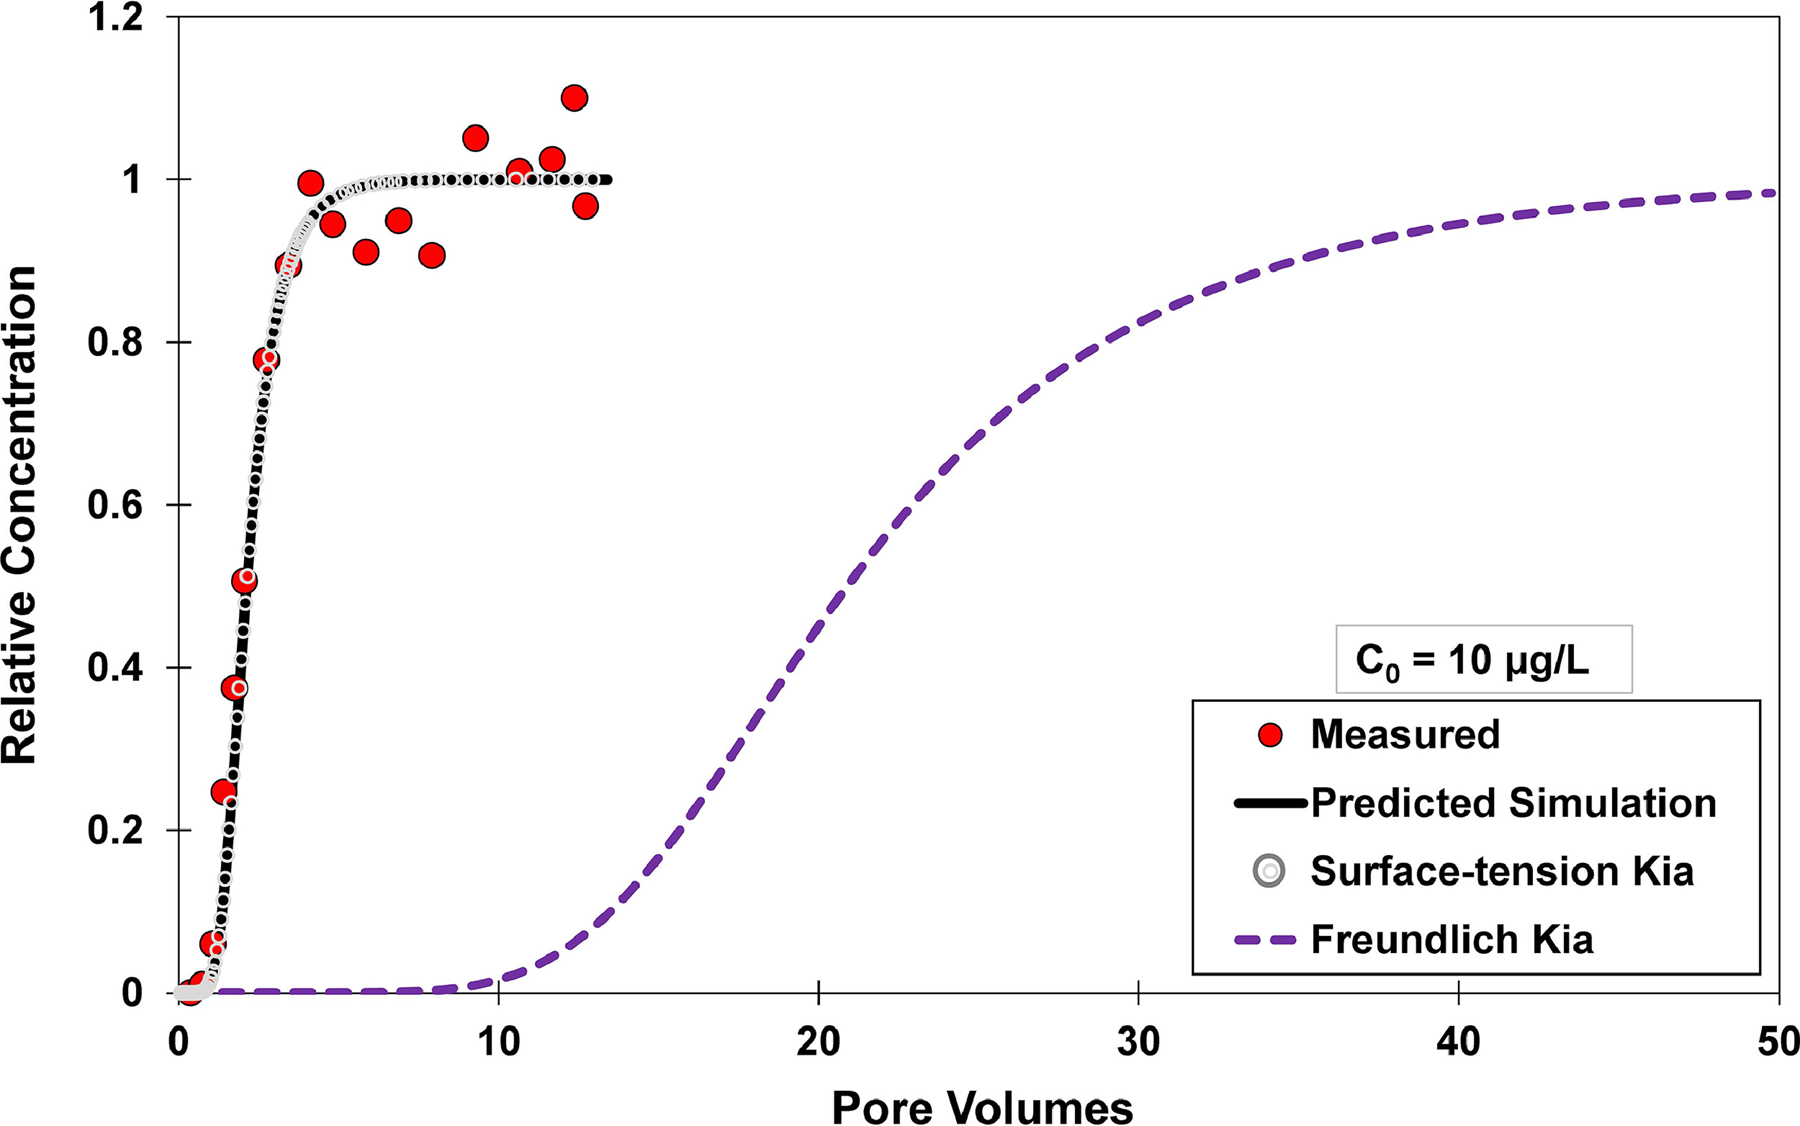
Measured and simulated breakthrough curves for PFOA transport in unsaturated sand, with an input concentration (C0) of 10 µg/L. All of the lines represent independently predicted simulations of transport (no calibration) produced with the multi-process mass-transfer model of Brusseau (2020). It does not incorporate surfactant-induced flow, and air-water interfacial adsorption is treated as linear and instantaneous for the simulations. Directly-measured neutron-reflectometry data are used to determine the air-water interfacial adsorption coefficient for the black solid-line simulation (Predicted Simulation), whereas surface-tension data are used for the gray dotted-line simulation (Surface-tension Kia). A Freundlich-isotherm estimation is used to determine the air-water interfacial adsorption coefficient for the purple dashed-line simulation (Freundlich Kia).
3.3. Validation of Independently Determined Input Parameters
It is well established that conducting independent predictions is the most robust means by which to employ mathematical modeling to analyze measured transport data and characterize relevant processes. This approach is used in the present study. The first step in this procedure is to obtain values for all relevant input parameters. Inspection of equation 1 reveals that several retention-related parameters need to be determined a priori to produce independently-predicted simulations of transport. Two critical parameters for PFAS retention under unsaturated-flow conditions are the air-water interfacial area and the AWIA coefficient. A priori parameterization of these two variables is likely to pose the greatest difficulty for most modeling analyses of PFAS retention and transport under unsaturated-flow conditions.
The validity of the values used for these two critical parameters in the mathematical modeling will be examined in this subsection. An independently-predicted simulation produced with the Guo et al. (2020) model will be compared to measured transport data for a PFOA transport experiment conducted at sufficiently low input concentration such that transport is ideal. Hence, the evaluation of parameter-value validity will not be conflated by potential impacts of nonideal factors such as surfactant-induced flow.
The transport data sets presented in this study were all obtained for experiments conducted with a 0.35-mm diameter commercial, natural quartz sand. It is quite possible that more interfacial-area measurements have been reported for this medium than for any other. Brusseau (2021) aggregated the published measurements and showed that there was good consistency of measured values obtained by different research groups with various interfacial-tracer methods. Our previously reported measured Aia data sets (Araujo et al., 2015; Brusseau et al., 2015, 2020b) were consolidated and used to develop an Aia-Sw function that can be employed to determine Aia for any given Sw for the sand (Jiang et al., 2020; Guo et al., 2020). Brusseau (2021) determined a measurement uncertainty of 10% for the data. This function was used to determine Aia values for the simulations presented herein.
An et al. (1996) used neutron reflectometry to directly measure the adsorption of PFOA at the air-water interface in 0.01 M NaCl solution. Neutron reflectometry is an advanced, high-resolution method for characterizing and quantifying soft-matter interfaces. Hence, it represents a robust means by which to directly measure surfactant adsorption at interfaces. The directly-measured adsorption data reported by An et al. were used by Brusseau (2021) to determine corresponding directly-measured Kia values for PFOA. Notably, a maximum value of 0.0032 cm was measured. These data provide a robust source of Kia values for PFOA that is independent of the standard approach of using surface-tension data, and will be used for the following independent prediction.
The measured breakthrough curve for PFOA transport in the sand under unsaturated conditions is presented in Figure 1. Air-water interfacial adsorption is responsible for the majority (~81%) of PFOA retention. These data were obtained with an input concentration of 10 μg/L. This concentration is three orders-of-magnitude below the critical reference concentration of PFOA. Accompanying simulations demonstrated the absence of surfactant-induced flow for this experiment, which is consistent with the small change in surface tension measured for PFOA in this concentration range (Figure SI-1).
It is observed that the independently-predicted simulation produced with the model of Guo et al. (2020) provides an excellent match to the measured data. The fact that the independent prediction accurately simulates the measured data indicates that the model appropriately captures the relevant transport processes. It also demonstrates that the input-parameter values employed are robust and representative of the transport system. This includes the values used for Aia and Kia. In particular, given that the Kia was obtained from a high-resolution direct measurement, these results validate the robustness of the measured values used for Aia.
3.4. PFAS Transport for Input Concentrations below the Critical Reference Concentration
With the parameterization of Kia and Aia values determined to be robust, the influence of input concentration on PFAS transport can be investigated via comparison of measured and simulated data sets. The measured breakthrough curves for PFOS transport under unsaturated-flow conditions with an input concentration of 0.1 mg/L are presented in Figure 2. Note that this concentration is one order-of-magnitude lower than the critical reference concentration of 1 mg/L. Good correspondence is observed for the two measured data sets. The full breakthrough curve is observed to be relatively symmetrical. PFOS transport experiences a relatively large magnitude of retention, with an equivalent retardation factor of 10.5. Air-water interfacial adsorption is responsible for the majority (~83%) of PFOS retention.
Fig. 2.

Measured and simulated breakthrough curves for PFOS transport in unsaturated sand. Only the arrival front was measured for the second experiment. The two lines represent independently predicted simulations of transport (no calibration). The solid black line is produced with the comprehensive model of Guo et al (2020). The simulation accounts for surfactant-induced flow, and air-water interfacial adsorption is treated as nonlinear and rate-limited. The dotted gray curve is produced with the multi-process mass-transfer model of Brusseau (2020); note that this curve is essentially identical to the solid curve. It does not incorporate surfactant-induced flow, and air-water interfacial adsorption is treated as linear and instantaneous for the simulation. Surface-tension data are used to determine the air-water interfacial adsorption coefficient.
The independently-predicted simulation produced with the comprehensive model of Guo et al. (2020) provides an excellent match to the measured data (Figure 2). It is important to note again that this simulation was produced without calibration to the measured data, wherein all input parameters were obtained independently. This demonstrates that the model accurately represents the relevant processes influencing PFOS transport, as well as indicating that the parameter values used were robust.
A series of simulations was conducted to test the specific impact of the various processes potentially influencing PFOS transport. Simulations produced with and without surfactant-induced flow are essentially identical, indicating negligible impact for this system (Figures 2 and SI-2). Inspection of Figure SI-1 shows that the surface tension for PFOS changes minimally for concentrations below 0.1 mg/L, the input concentration employed for the experiment. This explains the absence of surfactant-induced flow for this experiment. This result is consistent with prior simulations of PFAS transport (Brusseau et al., 2020b; Guo et al., 2020).
Sorption of PFOS by the sand is nonlinear and rate-limited, as demonstrated in our prior experiments conducted under saturated-flow conditions (Van Glubt et al., 2021). However, the simulations demonstrate that nonlinear sorption has a negligible impact and that rate-limited sorption has minimal impact for PFOS transport under unsaturated conditions (Figure SI-2). This is because solid-phase sorption provides a relatively small contribution (~17%) to total retention. Simulations treating AWIA as rate limited versus instantaneous are coincident, indicating that mass transfer to and from the air-water interface is rapid with respect to the residence time for the miscible-displacement experiments. This is consistent with the results of a prior study (Brusseau, 2020).
The simulation produced with AWIA treated as linear (a fixed Kia) is essentially identical to the simulation accounting for nonlinearity (Figure 2). This indicates that AWIA is effectively linear for the conditions of the experiment. This is consistent with the measured and simulated breakthrough curves not exhibiting appreciable self-sharpening of the arrival front or extended concentration tailing for the elution front, both of which are hallmarks of transport influenced by nonlinear adsorption. As discussed above, the critical reference concentration for PFOS is 1 mg/L, below which the surface-tension measured Kia is essentially constant. Hence, the observed behavior of the measured transport data, the results of the mathematical modeling, and the characterization of surface activity via the surface-tension data are all consistent.
Similar series of simulations were conducted for PFOA and GenX transport in the sand (results not shown). This includes the transport of PFOA for an input concentration of 1 mg/L, which is ten-times below PFOA’s critical reference concentration, and the transport of GenX for an input concentration of 10 mg/L that is 3-times lower than its critical reference concentration. Surfactant-induced flow was negligible and AWIA exhibited minimal nonlinearity for both cases. This is consistent with the prior simulations of PFOS transport. In total, these results demonstrate that surfactant-induced flow is not relevant and that AWIA can be treated as effectively linear for PFAS transport when concentrations are approximately a factor of 3–10 below the critical reference concentration.
3.5. Simulating PFAS Transport with a Simplified Mathematical Model
The independently-predicted simulation produced with the multi-process mass-transfer model of Brusseau (2020) is observed to provide an excellent match to the measured PFOS transport data (Figure 2). Notably, this model does not incorporate surfactant-induced flow. In addition, AWIA is treated as linear and instantaneous for the simulation. The performance of the model was further tested by applying it to multiple additional data sets.
The first is a data set for PFOA transport in the sand, with an input concentration of 1 mg/L. Note that this concentration is 10-times higher than the concentration used for the prior PFOS experiment, but is 10-times below the PFOA critical reference concentration. The measured and simulated breakthrough curves are presented in Figure SI-3. The model produces a good prediction of the measured data, with no representation of surfactant-induced flow and with AWIA treated as linear and instantaneous. Independent predictions produced with the model also provided excellent simulations of measured PFOA transport data for experiments conducted with lower input concentrations of 1, 10, and 100 μg/L (Figures 3, 4, and SI-4, respectively). Another data set is for GenX transport in the sand, with an input concentration of 10 mg/L. This is three-times lower than the critical reference concentration of 30 mg/L. Similar to the PFOS and PFOA data sets, the simplified model provides a very good prediction of the measured data without accounting for surfactant-induced flow or nonlinear, rate-limited AWIA (Figure SI-3).
Fig. 3.
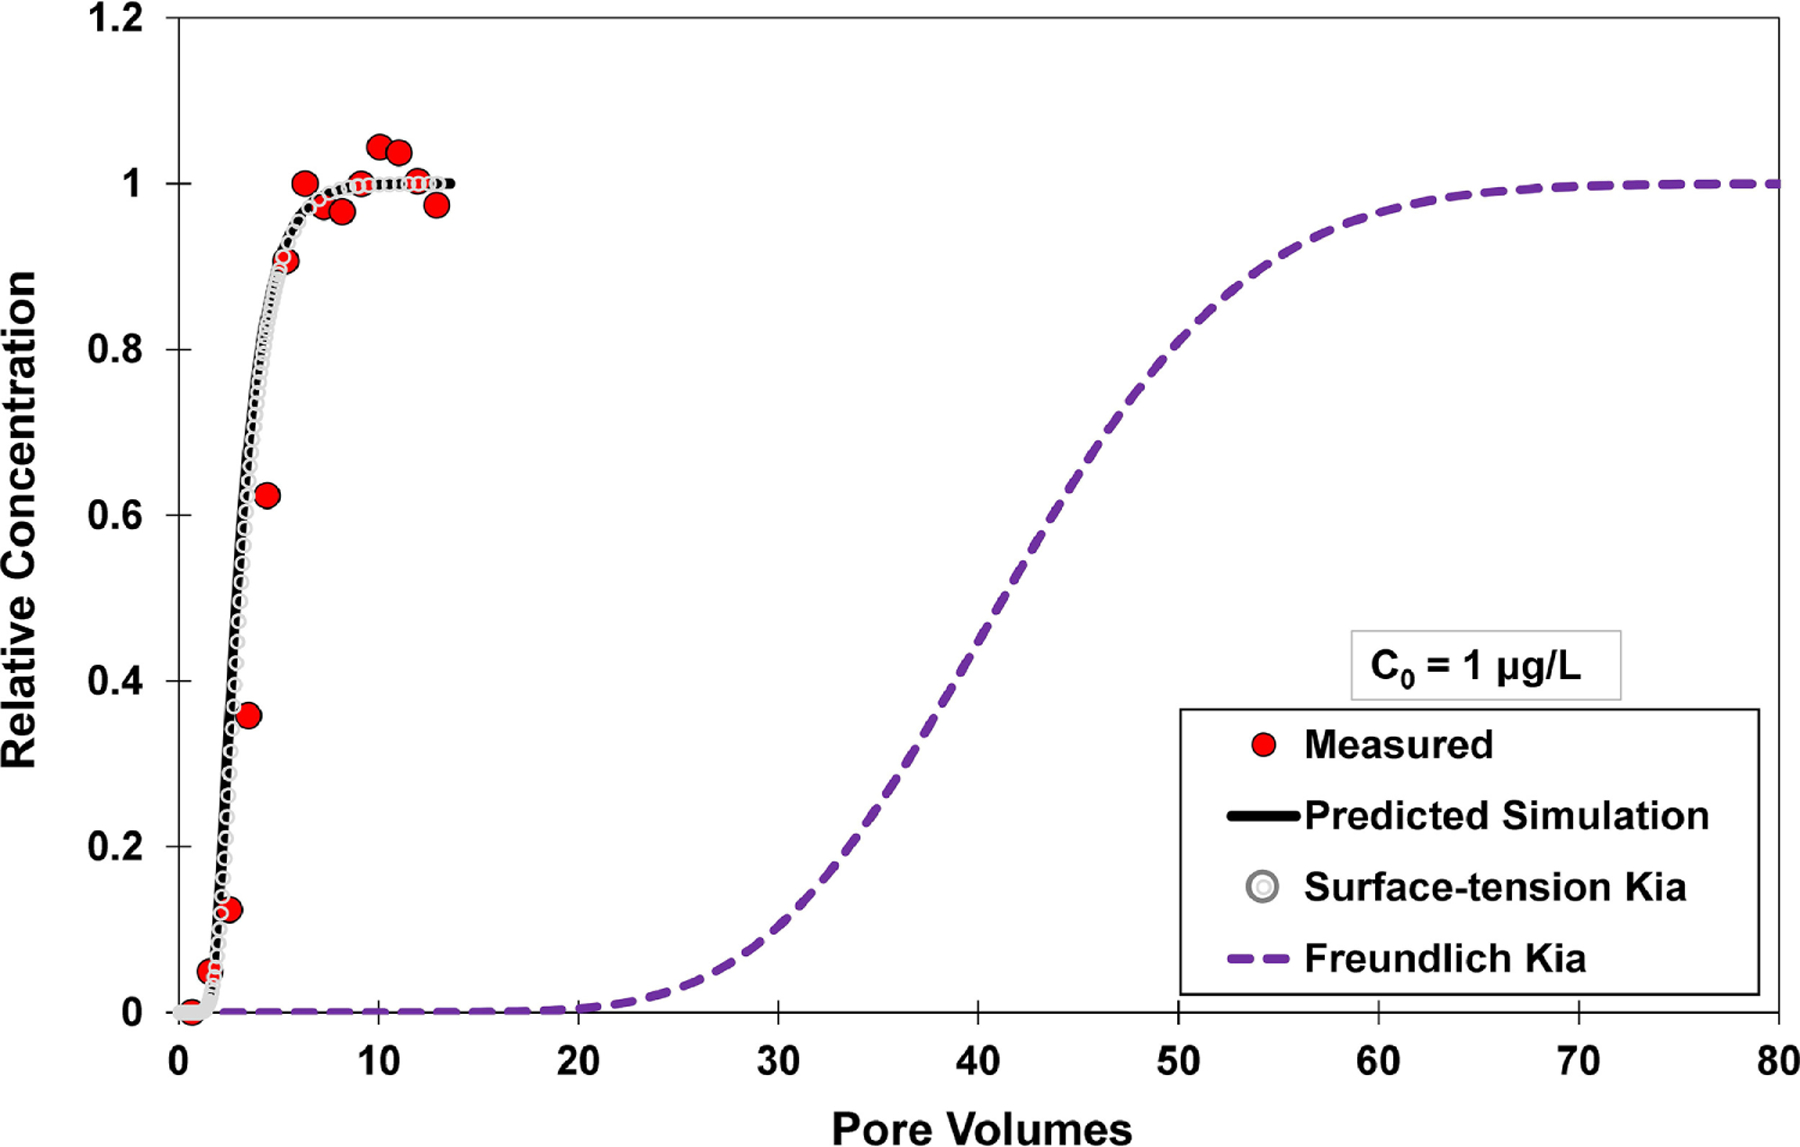
Measured and simulated breakthrough curves for PFOA transport in unsaturated sand, with an input concentration (C0) of 1 μg/L. All of the lines represent independently predicted simulations of transport (no calibration). The simulations are produced with the multi-process mass-transfer model of Brusseau (2020). it does not incorporate surfactant-induced flow, and air-water interfacial adsorption is treated as linear and instantaneous for the simulations. Directly-measured neutron-reflectometry data are used to determine the air-water interfacial adsorption coefficient for the black solid-line simulation (Predicted Simulation), whereas surface-tension data are used for the gray dotted-line simulation (Surface-tension Kia). A Freundlich-isotherm estimation is used to determine the air-water interfacial adsorption coefficient for the purple dashed-line simulation (Freundlich Kia).
In total, the simplified model was used successfully to independently predict PFAS transport for six experiments comprising three PFAS and a range of input concentrations. The ability of the model to accurately predict the measured data indicates that simpler mathematical models can be employed to simulate PFOS transport under appropriate conditions. Specifically, surfactant-induced flow can be ignored and AWIA can be treated as linear when the relevant concentration range is sufficiently below the critical reference concentration.
3.6. Linearity of Air-Water Interfacial Adsorption
The results of the several individual transport experiments and simulations presented in the preceding sections demonstrate that AWIA is effectively linear for concentrations sufficiently below the critical reference concentration. The linearity of AWIA can also be investigated directly by comparing the magnitudes of measured retardation factors as a function of the respective input concentrations used for the combined set of transport experiments. Inspection of equation 1 shows that when AWIA is linear (i.e., constant Kia), retardation factors incorporating only AWIA should be constant for experiments conducted at different input concentrations when the same porous medium and water contents are used (i.e., Aia is constant). In the present case, the retardation factor is anticipated to increase slightly for lower concentrations due to the impact of nonlinear solid-phase sorption.
A plot of retardation factors versus the input concentrations used for the PFOA experiments is presented in Figure 5. The comparison of R values as a function of concentration requires no specification of individual parameter values such as Kia or Aia, and thus is not subject to any sort of parameter-determination uncertainty. Thus, it represents a direct and definitive assessment of the nonlinearity of AWIA under transport conditions. The magnitudes of the measured retardation factors increase minimally over the four order-of-magnitude range in concentrations. The small increase is due to the impact of nonlinear solid-phase sorption. The essentially constant retardation factors measured for PFOA over a several-log change in concentration is another confirmation of the linearity of AWIA below the critical reference concentration.
Fig. 5.

Measured and predicted retardation factors for PFOA transport in unsaturated sand. Water saturation is approximately 0.68 for all experiments. UAZ Data represent combined data measured in this and prior studies (Lyu et al., 2018; Lyu and Brusseau, 2020). The green triangle represents a data set reported by Li et al. (2021) for PFOA in a range of ionic-strength solutions. The error bars represent 95% confidence intervals; the error bars for the 1000 μg/L data point are too small to see on the scale.
3.7. Relevancy of Kia Measurement Methods
Given that the values used for Aia have been validated for the present system, the representativeness of other sources of Kia values can be investigated. The standard means by which to determine Kia values is by application of the Gibbs adsorption equation to measured surface-tension data. Brusseau (2021) analyzed the results of 10 individual sets of surface-tension measurements for PFOA in 0.01 M NaCl solution, and determined a mean Kia of 0.0032 cm for a concentration of 10 μg/L. The Kia of 0.0037 cm determined from the PFOA surface-tension data presented in Figure SI-1 is very similar to this mean value. In addition, the mean value is identical to the directly-measured value. Hence, the predicted simulation obtained with the surface-tension determined Kia is identical to the simulation employing the directly-measured value, thereby producing an excellent match to the measured data (Figure 4). This consistency is observed for all of the other PFOA data sets (see Figures 3, SI-4, and SI-5). In addition, excellent matches are also obtained using surface-tension Kia values for predicted simulations of PFOS (Figure 2) and GenX (Figure SI-3). These results demonstrate that Kia values determined from surface-tension data are appropriate for representing PFAS AWIA during transport in unsaturated media. This is consistent with the results of prior comparisons of transport-measured and surface-tension determined values (Lyu et al., 2018; Brusseau et al., 2019a; Brusseau, 2021).
As noted in the Introduction, the Freundlich isotherm has been proposed as an alternative method to estimate Kia values for PFAS adsorption at air-water interfaces. With this approach, Kia does not attain an upper limiting value at lower concentrations. Rather, the magnitude of Kia increases continuously as concentration decreases. For example, application of the Freundlich-isotherm estimation produces a Kia value for PFOA that is 34-times larger than the values determined from neutron reflectometry and surface tension for an input concentration of 1 μg/L. As a result, the simulated breakthrough curve for PFOA transport with the Freundlich-isotherm Kia exhibits much greater retardation than the measured data (Figure 3), with respective Freundlich and measured R values of ~41 and 3.9. Similar results are obtained for PFOA transport at the input concentrations of 10 μg/L (Figure 4), 100 μg/L (Figure SI-4), and 1 mg/L (Figure SI-5). In order for the Freundlich-predicted retardation to match the retardation of the measured breakthrough curve for the input concentration of 1 μg/L, the Aia must be reduced to a value of ~3 cm−1. This interfacial area is >20-times lower than the measured interfacial area, and represents a physically unrealistic value for the porous medium and system conditions. In addition, a different greatly reduced Aia value is required to match the measured retardation for each of the input concentrations, which also is not physically realistic.
The Freundlich-predicted retardation factors increase exponentially and exhibit increasingly greater deviations from the measured values as concentrations decrease (Figure 5). This is not consistent with the linearity of AWIA demonstrated by the absence of self-sharpening and extended elution tailing for the measured breakthrough curves, the results of the mathematical-modeling simulations, and the constancy of measured retardation factors for different input concentrations. Conversely, the retardation factors predicted using the Kia values determined from the surface-tension data are consistent with the measured data (Figure 5).
3.8. PFAS Transport for Input Concentrations at or above the Critical Reference Concentration
Transport experiments were also conducted using input concentration near or above the critical reference concentration. The breakthrough curve for PFOS transport with an input concentration of 10 mg/L, ten-times larger than the critical reference concentration, is presented in Figure 6. The breakthrough curve exhibits a sharp arrival front and extended elution-concentration tailing. The effective Kia determined from the breakthrough curve is similar to that determined from the surface-tension data.
Fig. 6.
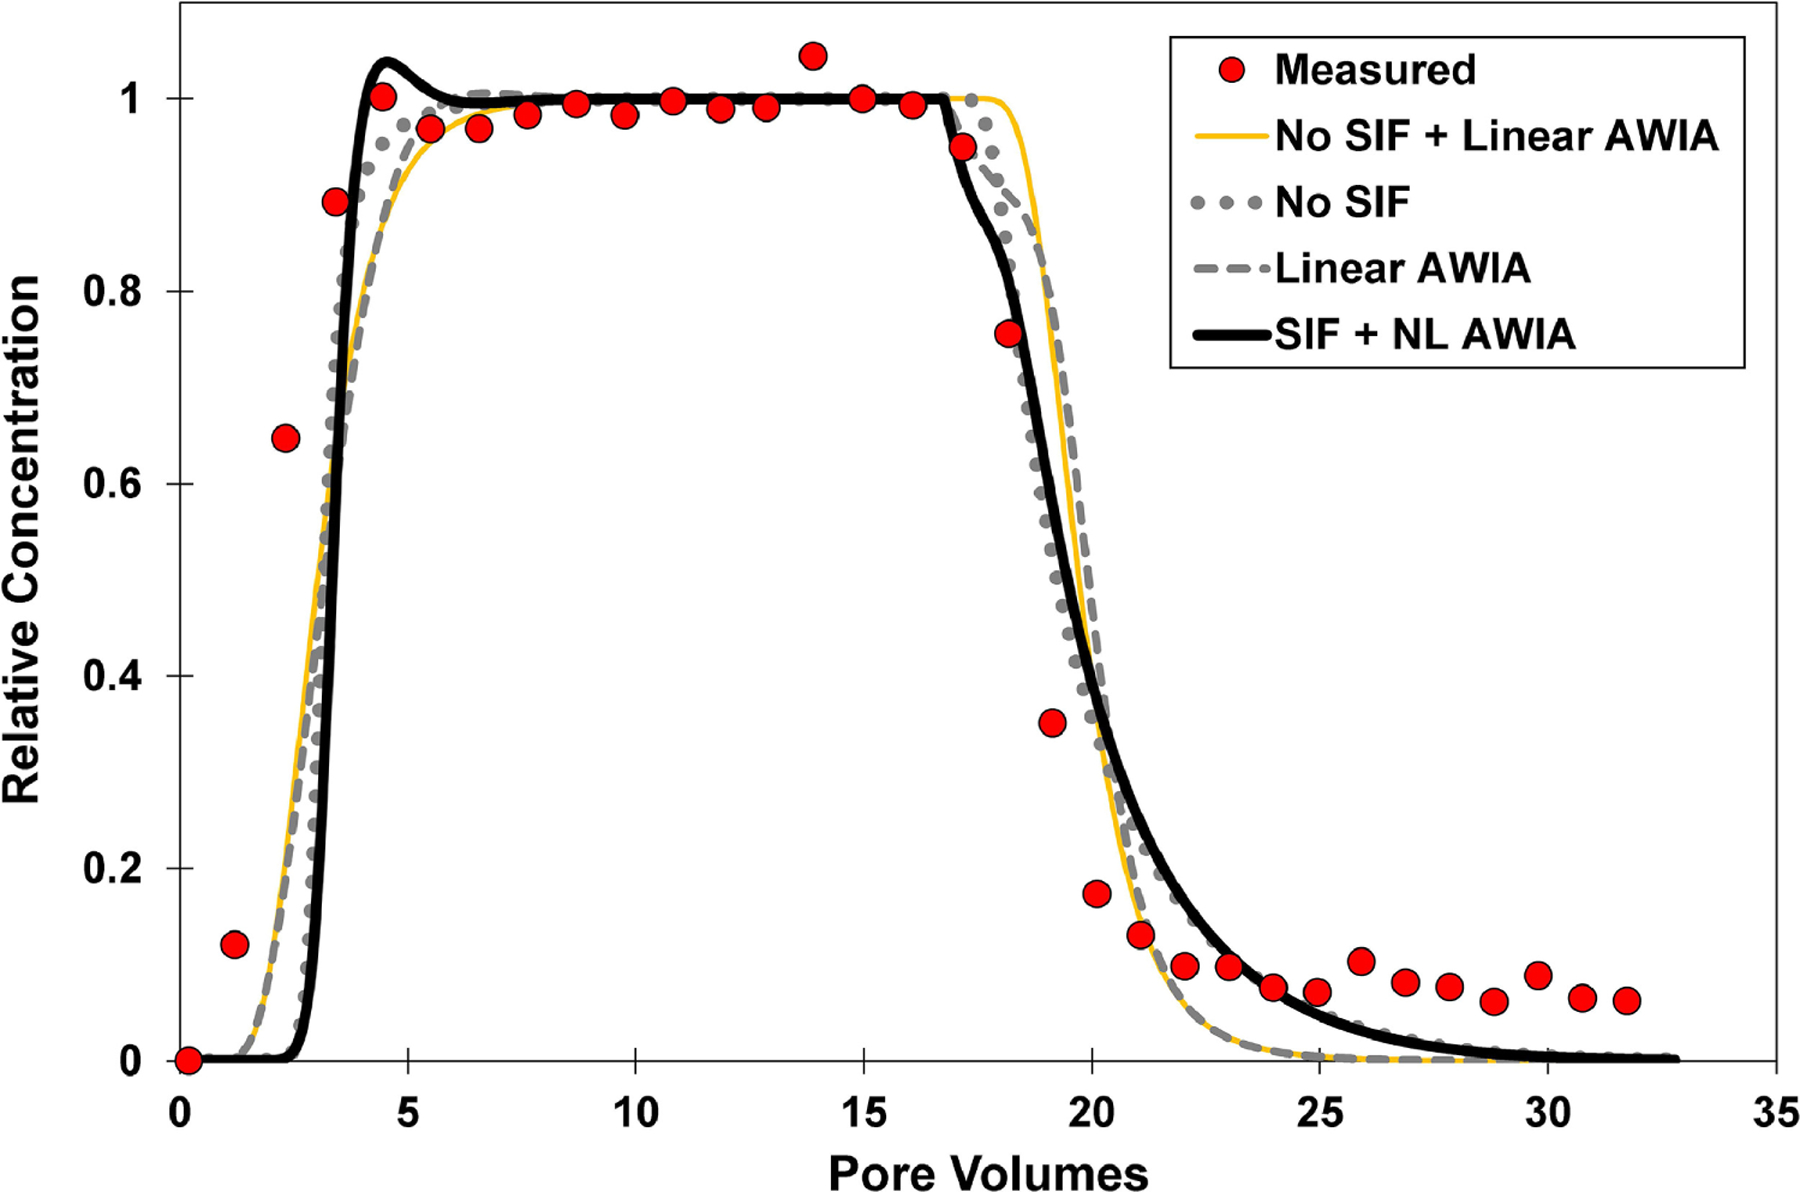
Measured and simulated breakthrough curves for PFOS transport in unsaturated sand with an input concentration of 10 mg/L and a water saturation of 0.68. The lines represent independently predicted simulations of transport (no calibration) produced with the comprehensive model of Guo et al (2020). The solid-line simulation accounts for surfactant-induced flow (SIF) and nonlinear air-water interfacial adsorption (AWIA). The dotted-line simulation accounts for nonlinear air-water interfacial adsorption but excludes surfactant-induced flow. The dashed-line simulation treats air-water interfacial adsorption as linear and includes surfactant-induced flow. The simulation for the thin golden line simulation treats air-water interfacial adsorption as linear and excludes surfactant-induced flow. The lower 95% confidence-interval values are used for Kia and Aia input.
The predicted simulation produced with the Guo et al. (2020) model could not match the measured data. Measurement uncertainty for input-parameter values should be considered when comparing predicted and measured transport data. Another simulation was conducted using the lower ranges of the measured Aia and Kia values noted above. This predicted simulation was also not able to match the early arrival and extended elution tailing exhibited by the measured breakthrough curve (Figure 6). Similar results are obtained for two additional PFOS transport experiments conducted with input concentrations of 10 mg/L and similar water saturations (data not shown). An experiment was also conducted with the same input concentration but a higher water saturation (Figure SI-6). In this case, the arrival front was adequately simulated, but not the extended elution tailing. This may indicate a lesser degree of nonideal transport at the higher water saturation; additional investigation is required to confirm such behavior.
The predicted simulations presented in Figures 6 and SI-6 include surfactant-induced flow and nonlinear AWIA. The simulations without surfactant-induced flow deviate only slightly from the original simulations, indicting relatively minor impact. The simulations with linear AWIA deviate measurably from the original simulations. This illustrates that AWIA is nonlinear for these cases. This is consistent with the observation of self-sharpening arrival fronts and extended elution tailing for the breakthrough curves.
Experiments were also conducted for PFOS transport with an input concentration of 1 mg/L and PFOA transport with an input concentration of 10 mg/L (Figure 7). These concentrations are identical to the respective critical reference concentrations of PFOS and PFOA. The effective Kia values determined from the breakthrough curves are similar to those determined from the surface-tension data. Similar magnitudes of early arrival and extended elution tailing are observed for both experiments, along with concentration disruptions observed for the arrival fronts starting at relative concentrations of 0.7 and 0.8, respectively. While the predicted simulations could not fully match the early arrival and extended tailing, the degree of deviation is not as great as observed for the PFOS experiments conducted at 10 mg/L input concentration (Figure 6).
Fig. 7.

Measured and simulated breakthrough curves for PFOS (input C of 1 mg/L) and PFOA (input C of 10 mg/L) transport in unsaturated sand with water saturations of ~0.68. The lines represent independently predicted simulations of transport (no calibration) produced with the comprehensive model of Guo et al (2020). The simulations account for surfactant-induced flow (SIF) and nonlinear air-water interfacial adsorption (AWIA). The lower 95% confidence-interval values are used for Kia and Aia input.
The preceding results indicate that PFOS and PFOA experience nonideal transport for conditions with input concentrations similar to or greater than the critical reference concentration. The disparity observed between the simulated and measured transport suggests the existence of a process or interaction that is not represented in the model. As discussed above, the modelling indicated that surfactant-induced flow was of minimal importance for these experiments. As represented in the model, surfactant-induced flow impacts water flow, the local water saturation, and the magnitude of air-water interface, which concomitantly impacts PFAS retention and transport. It appears that there may be some additional manifestation of surfactant-induced flow that is not represented in the model. The early arrival exhibited by the measured breakthrough curves may indicate an impact of preferential transport, with some initial bypassing of a portion of the air-water interfacial area. The extended elution tailing may indicate a degree of constrained access to some portion of the air-water interfacial area. However, the observation that the Kia values determined from moment-analysis of the breakthrough curves are similar to those determined from the surface-tension data indicates that all interfacial area is accessed eventually. These phenomena are the focus of on-going research.
4. Conclusions
This study presents the first systematic investigation of the impact of surfactant-induced flow and nonlinear AWIA on PFAS transport with a combination of miscible-displacement experiments and mathematical modeling. Analysis of measured transport behavior of PFAS under unsaturated-flow conditions demonstrated that AWIA was linear when the input concentration was sufficiently below the critical reference concentration. This includes the absence of significant shelf-sharpening and extended elution tailing of breakthrough curves, as well as the similarity of retardation factors measured for a several-log range of input concentrations. The results of surface-activity characterization via surface-tension measurements and those from mathematical-modeling investigations supported this observation. These results indicate that Kia attains a limiting maximum value under transport conditions. The results also demonstrate that Kia values determined from surface-tension data are appropriate for representing AWIA of PFAS during transport in unsaturated media.
The concept of critical reference concentrations was shown to be an effective approach for evaluating the potential for specific processes to influence PFAS transport. The results of the transport experiments and mathematical modeling demonstrated that surfactant-induced flow can be ignored and AWIA can be treated as linear when the relevant concentration range is 3–10 times below the critical reference concentration. In addition, this and prior research (Brusseau, 2020) has indicated that AWIA can be reasonably treated as effectively instantaneous for transport. Hence, PFAS retention associated with AWIA can be considered to be ideal under the appropriate conditions. This has significant implications for characterizing retention processes and for simulating PFAS transport. Specifically, the results demonstrate that simplified mathematical models that exclude surfactant-induced flow and treat AWIA as linear and instantaneous can be employed in some cases to simulate PFAS transport. This not only reduces the complexity required for process representation, thus simplifying the model required, but it also reduces the level of information needed for input-data parameterization. Conversely, apparent nonideal transport behavior was observed for experiments conducted with input concentrations similar to or greater than the critical reference concentration. This phenomenon requires further investigation.
Based on studies reported to date (e.g., Washington et al., 2010; Anderson et al., 2016; Rankin et al., 2016; Dauchy et al., 2019; Brusseau et al., 2020a), the soil concentrations for PFAS at a great majority of sites are likely to be below the respective critical reference concentrations for many PFAS of interest, especially for short- and medium-chain PFAS. This is anticipated to be true for secondary-source sites such as landfills and locations receiving land application of treated wastewater or biosolids, and for some legacy AFFF and PFAS-manufacturing sites. However, this may not be true for sites with recent or new AFFF applications or spills. In these latter cases, the relatively high concentrations present may lead to nonideal AWIA behavior that cannot be adequately represented with simplified models.
In addition, it is important to note that other factors may contribute to the complexity of PFAS transport in the vadose zone. These include nonsteady flow conditions, physical heterogeneity, and potential preferential-flow phenomenon, which may directly impact air-water interfacial adsorption and transport. Other potentially important factors include soil geochemical heterogeneity and complex nonlinear, rate-limited, multi-process solid-phase sorption (e.g., Barzen-Hanson et al., 2017; Campos Pereira et al., 2018; Brusseau et al., 2019b; Knight et al., 2019; Xiao et al., 2019; Guelfo et al., 2020; Mejia-Avendano et al., 2020; Nguyen et al., 2020; Schaefer et al., 2021; Wang et al. 2021; Zhou et al., 2021), and the presence of PFAS mixtures, hydrocarbon surfactants, co-contaminants (e.g., Guelfo and Higgins, 2013; Brusseau and Van Glubt, 2019; Van Glubt and Brusseau, 2021), precursors (e.g., Nickerson et al., 2021), and newly-identified PFAS (e.g., Washington et al., 2020) in soils. Additional research is required to examine the impact of these other factors on transport, and to evaluate their relevance for PFAS migration in the vadose zone under field-scale conditions.
Supplementary Material
Highlights.
Ideal versus nonideal PFAS transport is examined for unsaturated conditions
Results are interpreted in terms of critical reference concentrations (CRC)
Surfactant-induced flow is not important for concentrations below the CRC
Air-water interfacial adsorption can be treated as linear below the CRC
Nonideal transport is observed above the CRC
Acknowledgements
This research was supported by the NIEHS superfund Research Program (#P42 ES 4940) and the National Science Foundation (#2023351). The contributions of Ni Yan were supported by the National Natural Science Foundation of China (No. 41907161) and the China Postdoctoral Science Foundation (No. 2019M662448). The contributions of Ying Lyu were supported by the National Natural Science Foundation of China (No. 41902247) and the Fund of the Education Department of Jilin Province (JJKH20201005KJ). We thank the editor and reviewers for their constructive comments.
Footnotes
Publisher's Disclaimer: This is a PDF file of an unedited manuscript that has been accepted for publication. As a service to our customers we are providing this early version of the manuscript. The manuscript will undergo copyediting, typesetting, and review of the resulting proof before it is published in its final form. Please note that during the production process errors may be discovered which could affect the content, and all legal disclaimers that apply to the journal pertain.
References
- An SW, Lu JR, Thomas RK, Penfold J., 1996. Apparent anomalies in surface excesses determined from neutron reflection and the Gibbs equation in anionic surfactants with particular reference to perfluorooctanoates at the air/water interface. Langmuir 12 (10), 2446–2453. [Google Scholar]
- Anderson RH, Long GC, Porter RC, Anderson JK, 2016. Occurrence of select perfluoroalkyl substances at US Air Force aqueous film-forming foam release sites other than fire-training areas: Field-validation of critical fate and transport properties. Chemo., 150, 678–685. [DOI] [PubMed] [Google Scholar]
- Anderson RH, Adamson DT and Stroo HF, 2019. Partitioning of poly- and perfluoroalkyl substances from soil to groundwater within aqueous film-forming foam source zones. J. Contam. Hydrol 220, 59–65. [DOI] [PubMed] [Google Scholar]
- Araujo JB, Mainhagu J, & Brusseau ML, 2015.Measuring air–water interfacial area for soils using the mass balance surfactant-tracer method. Chemosphere, 134, 199–202. [DOI] [PMC free article] [PubMed] [Google Scholar]
- Arshadi M, Costanza J, Abriola LM, Pennell KD, 2020. Comment on “uptake of poly- and perfluoroalkyl substances at the air–water interface”. Environ. Sci. Technol 54, 7019–7020. [DOI] [PubMed] [Google Scholar]
- Barzen-Hanson KA, Davis SE, Kleber M, Field JA Sorption of fluorotelomer sulfonates, fluorotelomer sulfonamide betaines, and a fluorotelomer sulfonamido amine in national foam aqueous film-forming foam to soil. Environ. Sci. Technol 51, 2394–12404. [DOI] [PubMed] [Google Scholar]
- Brusseau ML 2018. Assessing the potential contributions of additional retention processes to PFAS retardation in the subsurface. Sci. Total. Environ 613–614, 176–185. [DOI] [PMC free article] [PubMed] [Google Scholar]
- Brusseau ML 2019a. Estimating the relative magnitudes of adsorption to solid-water and air/oil-water interfaces for per- and poly-fluoroalkyl substances. Environ. Pollut 254(Pt B), 113102. [DOI] [PMC free article] [PubMed] [Google Scholar]
- Brusseau ML, 2019b. The influence of molecular structure on the adsorption of PFAS to fluid-fluid interfaces: Using QSPR to predict interfacial adsorption coefficients. Water Res. 152, 148–158. [DOI] [PMC free article] [PubMed] [Google Scholar]
- Brusseau ML 2020. Simulating PFAS transport influenced by rate-limited multi-process retention. Water Res. 168, 115179. [DOI] [PMC free article] [PubMed] [Google Scholar]
- Brusseau ML 2021. Examining the robustness and concentration dependency of PFAS air-water and NAPL-water interfacial adsorption coefficients. Water Res. 190, 116778. [DOI] [PMC free article] [PubMed] [Google Scholar]
- Brusseau ML and Van Glubt S 2019. The influence of surfactant and solution composition on PFAS adsorption at fluid-fluid interfaces. Water Res. 161, 17–26. [DOI] [PMC free article] [PubMed] [Google Scholar]
- Brusseau ML and Van Glubt S 2021. The influence of molecular structure on PFAS adsorption at air-water interfaces in electrolyte solutions. Chemo., 281, article 130829. [DOI] [PMC free article] [PubMed] [Google Scholar]
- Brusseau ML, El Ouni A, Araujo JB and Zhong H 2015. Novel methods for measuring air-water interfacial area in unsaturated porous media. Chemosphere 127, 208–213. [DOI] [PMC free article] [PubMed] [Google Scholar]
- Brusseau ML, Yan N, Van Glubt S, Wang Y, Chen W, Lyu Y, Dungan B, Carroll KC and Holguin FO 2019a. Comprehensive retention model for PFAS transport in subsurface systems. Water Res. 148, 41–50. [DOI] [PMC free article] [PubMed] [Google Scholar]
- Brusseau ML, Khan N, Wang Y, Yan N, Van Glubt S, Carroll KC, 2019b. Non- ideal transport and extended elution tailing of PFOS in soil. Environ. Sci. Technol 53, 10654–10664. [DOI] [PMC free article] [PubMed] [Google Scholar]
- Brusseau ML, Anderson RH and Guo B 2020a. PFAS concentrations in soils: Background levels versus contaminated sites. Sci. Total. Environ 740, 140017. [DOI] [PMC free article] [PubMed] [Google Scholar]
- Brusseau ML, Lyu Y, Yan N and Guo B 2020b. Low-concentration tracer tests to measure air-water interfacial area in porous media. Chemo. 250, 126305. [DOI] [PMC free article] [PubMed] [Google Scholar]
- Campos Pereira H, Ullberg M, Kleja DB, Gustafsson JP, Ahrens L Sorption of perfluoroalkyl substances (PFASs) to an organic soil horizon: Effect of cation composition and pH. Chemo., 207, 183–191. [DOI] [PubMed] [Google Scholar]
- Costanza J, Arshadi M, Abriola LM, & Pennell KD, 2019. Accumulation of PFOA and PFOS at the air–water interface. Environ. Sci. Technol. Letters, 6(8), 487–491. [Google Scholar]
- Costanza-Robinson MS, Zheng Z, Henry EJ, Estabrook BD, Littlefield MH, 2012. Implications of surfactant-induced flow for miscible-displacement estimation of air-water interfacial areas in unsaturated porous media. Environ. Sci. Technol 46, 11206–11212. [DOI] [PubMed] [Google Scholar]
- Costanza-Robinson MS, & Henry EJ, 2017. Surfactant-induced flow compromises determination of air-water interfacial areas by surfactant miscible-displacement. Chemosphere, 171, 275–283. [DOI] [PubMed] [Google Scholar]
- Dauchy X, Boiteux V, Colin A, Hemard J, Bach C, Rosin C, Munoz J-F, 2019. Deep seepage of per- and polyfluoroalkyl substances through the soil of a firefighter training site and subsequent groundwater contamination. Chemosphere, 214, 729–737. [DOI] [PubMed] [Google Scholar]
- El Ouni A, Guo B, Zhong H, Brusseau ML, 2021. Testing the validity of the miscible-displacement interfacial tracer method for measuring air-water interfacial area: independent benchmarking and mathematical modeling. Chemo. 263 article 128193. [DOI] [PMC free article] [PubMed] [Google Scholar]
- Guelfo JL, Wunsch A, Mccray J, Stults JF, Higgins CP, 2020. Subsurface transport potential of perfluoroalkyl acids (PFAAs): Column experiments and modeling. J. Contam. Hydrol 233, 9–20. [DOI] [PubMed] [Google Scholar]
- Guo B, Zeng J and Brusseau ML 2020. A mathematical model for the release, transport, and retention of per- and polyfluoroalkyl substances (PFAS) in the vadose zone. Water Resour Res. 56(2). [DOI] [PMC free article] [PubMed] [Google Scholar]
- Jiang H, Guo B and Brusseau ML 2020. Pore-Scale modeling of fluid-fluid interfacial area in variably saturated porous media containing microscale surface roughness. Water Resour. Res 56(1). [DOI] [PMC free article] [PubMed] [Google Scholar]
- Karagunduz A, Young MH and Pennell KD 2015. Influence of surfactants on unsaturated water flow and solute transport. Water Resour Res. 51(4), 1977–1988. [Google Scholar]
- Knight E.R.m Janik LJ, Navarro DA, Kookana RS, and McLaughlin MJ 2019. Predicting partitioning of radiolabelled 14C-PFOA in a range of soils using diffuse reflectance infrared spectroscopy. Sci. Total Environ, 686, 505–513. [DOI] [PubMed] [Google Scholar]
- Li Z, Lyu X, Gao B, Xu H, Wu J, Sun Y., 2021. Effects of ionic strength and cation type on the transport of perfluorooctanoic acid (PFOA) in unsaturated sand porous media. J. Hazard. Mater 403, 123688. [DOI] [PubMed] [Google Scholar]
- Lyu Y and Brusseau ML 2020. The influence of solution chemistry on air-water interfacial adsorption and transport of PFOA in unsaturated porous media. Sci. Total. Environ 713, 136744. [DOI] [PMC free article] [PubMed] [Google Scholar]
- Lyu Y, Brusseau ML, Chen W, Yan N, Fu X and Lin X 2018. Adsorption of PFOA at the air-water interface during transport in unsaturated porous media. Environ. Sci. Technol 52(14), 7745–7753. [DOI] [PMC free article] [PubMed] [Google Scholar]
- Mejia-Avendano S, Zhi Y, Yan B, Liu J., 2020. Sorption of polyfluoroalkyl surfactants on surface soils: effect of molecular structures, soil properties, and solution chemistry. Environ. Sci. Technol 54, 1513–1521. [DOI] [PubMed] [Google Scholar]
- Mingorance MD, Fernandez Galvez J, Pena A, and Barahona E., 2007. Laboratory methodology to approach soil water transport in the presence of surfactants, Colloids Surf. A, 306, 75–82. [Google Scholar]
- Nguyen TMH, Braunig J, Thompson K, Thompson T, Kabri S, Navarro DA, Kookana RS, Grimison C, Barnes CM, Higgins CP, McLaughlin MJ, and Mueller JF Influences of chemical properties, soil properties, and solution pH on soil−water partitioning coefficients of per- and polyfluoroalkyl substances (PFASs). Environ. Sci. Technol, 54, 15883–15892. [DOI] [PubMed] [Google Scholar]
- Nickerson A, Rofowa AE, Adamson DT, Field JA, Kularni PR, Kornuc JJ, and Higgins CP Spatial trends of anionic, zwitterionic, and cationic PFASs at an AFFF-impacted site. Environ. Sci. Technol, 55, 313–323. [DOI] [PubMed] [Google Scholar]
- Rankin K, Mabury S, Jenkins T, and Washington J., 2016. A North American and global survey of perfluoroalkyl substances in surface soils: distribution patterns and mode of occurrence. Chemo., 161, 333–341. [DOI] [PubMed] [Google Scholar]
- Schaefer CE, Culina V, Nguyen D, Field J., 2019. Uptake of poly and perfluoroalkyl substances at the air–water interface. Environ. Sci. Technol 53, 12442–12448. [DOI] [PubMed] [Google Scholar]
- Schaefer CE, Nguyen D, Field J., 2020. Response to the comment on “uptake of poly-and perfluoroalkyl substances at the air-water interface”. Environ. Sci. Technol 54, 7021–7022. [DOI] [PubMed] [Google Scholar]
- Schaefer CE, Nguyen D, Emerson C, Shea S, Higgins CP, and Field J., 2021. Desorption of poly- and perfluoroalkyl substances from soil historically impacted with aqueous film-forming foam. J. Environ. Eng, 147, 06020006. [Google Scholar]
- Shin HM, Vieira VM, Ryan PB, Detwiler R, Sanders B, Steenland K and Bartell SM 2011. Environmental fate and transport modeling for perfluorooctanoic acid emitted from the Washington Works Facility in West Virginia. Environ. Sci. Technol 45(4), 1435–1442. [DOI] [PubMed] [Google Scholar]
- Silva JA, Martin WA, Johnson JL, and McCray JE, 2019. Evaluating air-water and NAPL-water interfacial adsorption and retention of perfluorocarboxylic acids within the vadose zone. J. Contam. Hydrol, 223, 103472. [DOI] [PubMed] [Google Scholar]
- Silva JA, Simunek J, and McCray JE, 2020. A modified HYDRUS model for simulating PFAS transport in the vadose zone. Water, 12, 2758. [Google Scholar]
- Van Glubt S and Brusseau ML Contribution of non-aqueous phase liquids to the retention and transport of per and polyfluoroalkyl substances (PFAS) in porous media. Environ. Sci. Technol, 55, 3706–3715. [DOI] [PMC free article] [PubMed] [Google Scholar]
- Van Glubt S, Brusseau ML, Yan N, Huang D, Khan N and Carroll KC, 2021. Column versus batch methods for measuring PFOS and PFOA sorption to geomedia. Environ. Pollut 268(Pt B), 115917. [DOI] [PMC free article] [PubMed] [Google Scholar]
- Wang Y, Khan N, Huang D, Carroll KC and Brusseau ML 2021. Transport of PFOS in aquifer sediment: Transport behavior and a distributed-sorption model. Sci. Total. Environ, 779, article 146444. [DOI] [PMC free article] [PubMed] [Google Scholar]
- Washington JW, Yoo H, Ellington J, Jenkins T, Libelo E., 2010. Concentrations, distribution, and persistence of perfluoroalkylates in sludge-applied soils near Decatur, Alabama, USA. Environ. Sci. Technol, 44 (22), 8390–8396. [DOI] [PubMed] [Google Scholar]
- Washington JW, Rankin K, Libelo E, Lynch D, Cyterski M., 2019. Determining global background soil PFAS loads and the fluorotelomer-based polymer degradation rates that can account for these loads. Sci. Total Environ, 651, 2444–2449. [DOI] [PMC free article] [PubMed] [Google Scholar]
- Washington JW, Rosal CG, McCord JP, Strynar MJ, and Lindstrom AB Nontargeted mass-spectral detection of chloroperfluoropolyether carboxylates in New Jersey soils. Science, 368, 1103–1107. [DOI] [PMC free article] [PubMed] [Google Scholar]
- Weber AK, Barber LB, LeBlanc DR, Sunderland EM and Vecitis CD, 2017. Geochemical and hydrologic factors controlling subsurface transport of poly- and perfluoroalkyl substances, Cape Cod, Massachusetts. Environ. Sci. Technol 51(8), 4269–4279. [DOI] [PubMed] [Google Scholar]
- Xiao F, Simcik MF, Halbach TR and Gulliver JS, 2015. Perfluorooctane sulfonate (PFOS) and perfluorooctanoate (PFOA) in soils and groundwater of a U.S. metropolitan area: Migration and implications for human exposure. Water Res. 72, 64–74. [DOI] [PubMed] [Google Scholar]
- Xiao F, Jin B, Golovko SA, Golovko MY, Xing B., 2019. Sorption and desorption mechanisms of cationic and zwitterionic per- and polyfluoroalkyl substances in natural soils: thermodynamics and hysteresis. Environmental Science & Technology 53, 11818–11827. [DOI] [PubMed] [Google Scholar]
- Yan N, Ji Y, Zhang B, Zheng X and Brusseau ML, 2020. Transport of GenX in Saturated and Unsaturated Porous Media. Environ. Sci. Technol 54, 11876–11885. [DOI] [PMC free article] [PubMed] [Google Scholar]
- Zhou D, Brusseau ML, Zhang Y, Li S, Wei W, Sun H, and Zheng C., 2021. Simulating PFAS adsorption kinetics, adsorption isotherms, and nonideal transport in saturated soil with tempered one-sided stable density (TOSD) based models. J. Hazard. Mater, 411, article 125169. [DOI] [PMC free article] [PubMed] [Google Scholar]
Associated Data
This section collects any data citations, data availability statements, or supplementary materials included in this article.