

Abstract
The effects of DNASE1L3 or DNASE1 deficiency on cell-free DNA (cfDNA) methylation were explored in plasma of mice deficient in these nucleases and in DNASE1L3-deficient humans. Compared to wild-type cfDNA, cfDNA in DNASE1L3-deficient mice was significantly hypomethylated, while cfDNA in DNASE1-deficient mice was hypermethylated. The cfDNA hypomethylation in DNASE1L3-deficient mice was due to increased fragmentation and representation from open chromatin regions (OCRs) and CpG islands (CGIs). These findings were absent in DNASE1-deficient mice, demonstrating the preference of DNASE1 to cleave in hypomethylated OCRs and CGIs. We also observed a substantial decrease of fragment ends at methylated CpGs in the absence of DNASE1L3, thereby demonstrating that DNASE1L3 prefers to cleave at methylated CpGs. Furthermore, we found that methylation levels of cfDNA varied by fragment size in a periodic pattern, with cfDNA of specific sizes being more hypomethylated and enriched for OCRs and CGIs. These findings were confirmed in DNASE1L3-deficient human cfDNA. Thus, we have found that nuclease-mediated cfDNA fragmentation markedly affects cfDNA methylation level on a genome-wide scale. This work provides a foundational understanding of the relationship between methylation, nuclease biology, and cfDNA fragmentation.
Many exciting diagnostic and prognostic applications using cell-free DNA (cfDNA) have been developed for noninvasive prenatal testing and cancer liquid biopsies (Chiu et al. 2008; Chan et al. 2017; Wan et al. 2017; Corcoran and Chabner 2018; Chabon et al. 2020). Plasma cfDNA is essentially a mixture of short DNA molecules with a modal size of 166 bp that are released from different tissues in the body (Lo et al. 2021). Exploiting the unique pattern of methylation in multiple cell types, cfDNA has been interrogated at differentially methylated regions to determine the tissue-of-origin of cfDNA molecules, where the increase of cfDNA from specific tissues can allow for the site of pathology to be localized (Sun et al. 2015; Guo et al. 2017; Moss et al. 2018). For example, genome-wide analysis of DNA methylation differences between cancer and normal cells has been utilized for cancer detection (Chan et al. 2013; Kang et al. 2017; Liu et al. 2018). While cfDNA methylation is a promising marker for cancer and tissue-of-origin testing, the field has only just begun to explore the biology behind the fragmentation of cfDNA. In this regard, the fragmentation of DNA into cfDNA has been found to be nonrandom and to reflect the underlying position of nucleosomes (Chandrananda et al. 2015; Ivanov et al. 2015; Snyder et al. 2016; Mouliere et al. 2018; Sun et al. 2019). By studying the fragmentomics of cfDNA, we have previously shown that different nuclease deficiencies affect cfDNA fragment ends and size profiles (Serpas et al. 2019; Chan et al. 2020; Han et al. 2020). The fragmentomic profile of cfDNA has been revealed as an emerging biomarker for cancer (Jiang et al. 2020). Our group has previously demonstrated that there is a relationship between cfDNA methylation levels and fragment size (Lun et al. 2013). Hence, it would be an interesting question to explore whether there is a relationship between the nuclease-mediated cfDNA fragmentation and DNA methylation level. In this work, we endeavor to shed some light on the fundamental relationships between nuclease activity, cfDNA methylation, and cfDNA fragment size profile.
Results
Nuclease deficiency changes the apparent cfDNA methylation
A yet unanswered question in the biology of cfDNA fragmentation was whether nuclease-mediated DNA fragmentation was affected by DNA methylation. To investigate the relationship between cfDNA methylation and nuclease activity, we performed whole-genome bisulfite sequencing of pooled plasma cfDNA from 20 wild-type (WT), 20 DNASE1L3-deficient, and 20 DNASE1-deficient mice (Fig. 1A). We also performed whole-genome bisulfite sequencing of each pool's buffy coat genomic DNA to check that nuclease deficiency per se would not affect DNA methylation inside cells. The overall CpG methylation percentage of plasma cfDNA and buffy coat genomic DNA from each sample is shown in Figure 1B.
Figure 1.

cfDNA from DNASE1L3-deficient mice is hypomethylated and cfDNA from DNASE1-deficient mice is hypermethylated on a genome-wide level. (A) Whole-genome bisulfite sequencing was performed on six pooled plasma from 20 wild-type mice, six pooled plasma from 20 DNASE1L3-deficient mice, and six pooled plasma from 20 DNASE1-deficient mice. (B) The CpG methylation percentage was calculated from all sequenced fragments in plasma cfDNA and buffy coat genomic DNA of each sample. A paired t-test was performed on paired plasma and buffy coat samples. Welch's t-test was performed on other comparisons. The y-axis scale ranges from 55% to 85%. (C,D) Transcriptional start sites (TSSs) were aggregated with the TSS placed at position 0 (C). H3K27ac regions were aggregated with the center of each region placed at position 0 (D). The CpG methylation percentage of all fragments in each sample was calculated over these aggregated regions and the median of each genotype is shown in a ±3000-bp window. cfDNA from WT mice is in green, from DNASE1L3-deficient mice is in red, and from DNASE1-deficient mice in blue. The y-axis scale ranges from 0% to 80%. cfDNA from DNASE1L3-deficient mice is hypomethylated and cfDNA from DNASE1-deficient mice is slightly hypermethylated in these regions.
We observed that the CpG methylation percentages of plasma cfDNA were generally lower than that of the paired buffy coat genomic DNA, with a median fold change of 0.95 in WT plasma (median 71.3% [interquartile range (IQR) 1.1%]) compared to WT buffy coat (median 74.7% [IQR 3.2%], paired t-test P = 0.002), a median fold change of 0.87 in DNASE1L3-deficient plasma (median 65.4% [IQR 1.6%]) compared to DNASE1L3-deficient buffy coat (median 74.8% [IQR: 2.8%], paired t-test P = 0.0004), and a median fold change of 0.95 in DNASE1-deficient plasma (median 73.0% [IQR 1.0%]) compared to DNASE1-deficient buffy coat (median 76.7% [IQR 4.4%], paired t-test P = 0.09).
Comparing between the nuclease genotypes, plasma cfDNA from DNASE1L3-deficient mice was more hypomethylated than plasma cfDNA from WT mice (median fold change 0.92, Welch t-test P = 0.002). On the other hand, plasma cfDNA from DNASE1-deficient mice was relatively hypermethylated (median fold change 1.05, Welch t-test P = 0.01). In contrast to the differing methylation levels seen in plasma cfDNA, the CpG methylation percentages of genomic DNA between WT, DNASE1L3-deficient mice, and DNASE1-deficient mice were not appreciably different from each other (one-way ANOVA P = 0.8). Altogether, these data suggested that, while the methylation levels of DNA inside the buffy coat cells of different genotypes were largely unaffected by DNASE1L3 or DNASE1 deficiency, the apparent methylation of plasma cfDNA was affected by the absence of either one of these nucleases.
We explored whether this was a genome-wide or a regional phenomenon by comparing the median CpG methylation percentages of cfDNA from each genotype in randomly selected genomic regions and open chromatin regions (OCRs) such as transcription start sites (TSSs) and RNA Polymerase II binding sites (Pol II). We also studied sites with H3K4me3 and H3K27ac modifications, which are known as markers for active enhancers and active promoters, respectively. The apparent hypomethylation of plasma cfDNA from DNASE1L3-deficient mice and the apparent hypermethylation of plasma cfDNA from DNASE1-deficient mice were present in both the random regions (Supplemental Fig. 1) and OCRs (Fig. 1C,D; Supplemental Fig. 1). As random regions would reflect the whole genome that is >97% chromatin, the apparent hypomethylation of cfDNA from DNASE1L3-deficient mice and apparent hypermethylation of cfDNA from DNASE1-deficient mice appeared to be independent of open or closed chromatin states and to affect the whole genome.
Characterizing the effects of nuclease deficiency and methylation on the cfDNA size profile
We wanted to understand how nuclease deficiency could affect the apparent cfDNA methylation and wondered if the methylation differences among the nuclease-deficient genotypes were due to their differences in cfDNA size profile. Previously, we had separately characterized the effects of these different nucleases on the cfDNA size profile (Cheng et al. 2018; Serpas et al. 2019). In Figure 2A, we compared the median size profile of all three genotypes together. In comparison to cfDNA from WT mice (green) with a modal size of 167 bp, cfDNA from DNASE1L3-deficient mice (red) exhibited an increase in short, ≤150-bp fragments, a modal size of 164 bp with a decrease in 166-bp fragments, and a slight increase in fragments ≥250 bp, consistent with our previous findings (Serpas et al. 2019). There is a 2.10-fold increase in the median percentage of ultrashort, ≤80-bp fragments in the cfDNA of DNASE1L3-deficient mice (median 6.5% [IQR 3.1%]) compared with WT mice (median 3.1% [IQR 1.3%], Welch t-test P = 0.01) (Fig. 2B).
Figure 2.

cfDNA size profile is shorter in DNASE1L3-deficient mice and longer in DNASE1-deficient mice. (A,C,D) The median cfDNA size profile of each genotype was plotted using all sample fragments (A), only 0%-methylated fragments (C), or only 100%-methylated fragments (D). cfDNA from WT mice is in green, DNASE1L3-deficient mice is in red, and DNASE1-deficient mice in blue. The y-axis scale ranges from 0% to 2.5%. (B,E,F) The proportion of fragments that are ultrashort (≤80 bp) was calculated from all sample fragments (B), only 0%-methylated fragments (E), or only 100%-methylated fragments (F). Welch's t-test was performed for significance testing. Nonsignificant P-values are in gray. The y-axis scale ranges from 0% to 25%.
On the other hand, there was a subtler difference in size profiles when comparing cfDNA from DNASE1-deficient mice (blue) to cfDNA from WT mice (green). There was a slight reduction in the short, ≤150-bp fragments, an increase in the frequency of 166-bp fragments, and a modal size of 171 bp. Previously, we had reported that the size profile of cfDNA from DNASE1-deficient mice did not obviously differ from the size profile of cfDNA from WT mice (Cheng et al. 2018). While the difference had not been obvious, in retrospect, the subtle differences in the size profiles that we note here with the benefit of more samples were also present then (Cheng et al. 2018). Also, in our current samples, the decrease in the percentage of ultrashort, ≤80-bp fragments in the cfDNA of DNASE1-deficient mice (median 1.4% [IQR 0.3%]) is statistically significant compared with WT mice (0.45 median fold change, Welch t-test P = 0.01) and DNASE1L3-deficient mice (0.22 median fold change, Welch t-test P = 0.002) (Fig. 2B). Thus, compared to WT mice, DNASE1L3-deficient mice had a shorter cfDNA size profile and DNASE1-deficient mice had a slightly longer cfDNA size profile.
Previously, our group also found that hypomethylated cfDNA was shorter than hypermethylated cfDNA in human plasma (Lun et al. 2013). We checked to see if this relationship was still true in the plasma of mice with different nuclease genotypes. We identified cfDNA fragments with at least three CpGs and categorized the fragments with zero out of these CpGs being methylated as 0%-methylated fragments and the fragments with all of its CpGs being methylated as 100%-methylated fragments. We compared the median size profiles of these 0%-methylated fragments and 100%-methylated fragments in each of the three genotypes (Supplemental Fig. 2A–C). In all three genotypes, the 0%-methylated fragments had a size profile that had more short fragments than their 100%-methylated counterparts. The median fold change of ultrashort, ≤80-bp fragment percentages between 0%-methylated fragments and 100%-methylated fragments was 6.43 in WT (paired t-test P = 0.002), 4.74 in DNASE1L3-deficient mice (paired t-test P = 0.006), and 5.89 in DNASE1-deficient mice (paired t-test P = 0.01) (Supplemental Fig. 2D–F). Thus, similar to our previous findings in human plasma, irrespective of the nuclease-related genotype, unmethylated fragments were more likely to be shorter than methylated fragments.
Confirming that unmethylated fragments were generally shorter and that cfDNA from DNASE1L3-deficient mice had more short fragments raised the possibility that cfDNA from DNASE1L3-deficient mice could be hypomethylated solely because of the increase in short fragments. To tease out the relationship between these interrelated factors, we compared the median cfDNA size profile of each genotype within the 0%- and the 100%-methylated fragments to control for the methylation level (Fig. 2C,D).
In the cfDNA of DNASE1L3-deficient mice, the change in size profile that we previously observed using all fragments (Fig. 2A) was also apparent in the 0% (red, Fig. 2C) and in the 100% (red, Fig. 2D) methylated fragments: relative to the size profile of both WT and DNASE1-deficient mice, there appeared to be an increase in fragments ≤150 bp and ≥250 bp and a decrease in the 166-bp peak, with the difference being more subtle in 100%-methylated fragments (Fig. 2C,D). The modal size of 0%-methylated fragments was 166 bp in WT and 155 bp in DNASE1L3-deficient mice, and the modal size of 100%-methylated fragments was 168 bp in WT and 155 bp in DNASE1L3-deficient mice. Similarly, in DNASE1-deficient mice, the slightly longer size profile that we saw previously with all fragments (Fig. 2A) was also apparent in the 0% (blue, Fig. 2C) and 100% (blue, Fig. 2D) methylated fragments, with the difference more subtle in 100%-methylated fragments and only observable at the modal size peak. The modal size of both 0% and 100%-methylated fragments in DNASE1-deficient mice was 169 bp.
Since these changes in cfDNA size profile were apparent in both 0% and 100%-methylated fragments, the absence of DNASE1L3 or DNASE1 by themselves appeared to result in an altered cfDNA size profile independent of methylation. Methylation, however, did still play a role since the cfDNA size profile differences in DNASE1- and DNASE1L3-deficient mice were both more exaggerated in 0%-methylated fragments than in 100%-methylated fragments. In particular, the change in the frequency of ultrashort, ≤80-bp fragments between the genotypes was more obvious in 0%-methylated fragments than in 100%-methylated fragments (Fig. 2C,D; Supplemental Fig. 2A–C). Thus, the methylation status of fragments seemed to particularly affect the ultrashort, ≤80-bp fragments.
These ultrashort, ≤80-bp fragments were enriched in 0%-methylated fragments in both WT and DNASE1L3-deficient mice. In 0%-methylated fragments, DNASE1L3-deficient mice had a 1.56-fold increase of ultrashort, ≤80-bp fragments compared to WT mice, but the increase had not reached statistical significance (Fig. 2E). In DNASE1-deficient mice, the frequency of these ≤80-bp fragments was 0.51-fold of that of WT (P = 0.02, Welch t-test) and 0.33-fold of that of DNASE1L3-deficient mice (P = 0.01, Welch t-test) (Fig. 2E). In contrast, in 100%-methylated fragments, there is no difference in frequency of these ≤80-bp fragments between DNASE1-deficient and WT mice (Fig. 2F). Since the absence of DNASE1 resulted in a significant decrease of these ≤80-bp fragments in 0%-methylated fragments only, the presence of DNASE1 seemed to be necessary for the generation of these ultrashort, ≤80-bp fragments in 0%-methylated fragments. The slight increase in these ultrashort, ≤80-bp fragments seen in DNASE1L3-deficient mice is consistent with this since DNASE1L3-deficient mice would still have functioning DNASE1. Thus, DNASE1 had a role in generating the peak in ≤80-bp fragments in WT and DNASE1L3-deficient mice, and this process was sensitive to the methylation status of fragments.
In summary, while hypomethylated cfDNA tended to have a shorter size profile than hypermethylated cfDNA, the absence of these nucleases also exerted an independent effect on the cfDNA size profile. In addition, 0%-methylated fragments were enriched for ultrashort, ≤80-bp fragments in WT and DNASE1L3-deficient mice. The absence of this enrichment in DNASE1-deficient mice revealed that these ultrashort, ≤80-bp fragments in 0%-methylated fragments were associated with the presence of DNASE1 activity.
The role of OCR and CGI fragments in cfDNA methylation
These unmethylated ultrashort, ≤80-bp fragments appeared to be associated with DNASE1 activity and were relatively more abundant in DNASE1L3-deficient mice in which DNASE1 was still present. We hypothesized that these fragments may have contributed to the general hypomethylation of cfDNA in DNASE1L3-deficient mice and wondered if these fragments originated from any particular region of the genome. We explored the genomic origins of these DNASE1 activity-associated, short, unmethylated fragments in the cfDNA of DNASE1L3-deficient mice. We hypothesized that they might be associated with OCRs and CpG islands (CGIs) since these regions were known to be hypomethylated compared to the genome as a whole. We classified the ±500-bp regions flanking the center of TSS and Pol II regions, and regions with H3K27ac and/or H3K4me3 as OCRs and merged these regions with CGIs.
We observed that these OCR and CGI regions had increased end density in the cfDNA of DNASE1L3-deficient mice and decreased end density in the cfDNA of DNASE1-deficient mice compared to WT (Fig. 3A,B; Supplemental Fig. 3). In comparison, the normalized end density in random regions of the genome was similar and overlapping in the cfDNA of WT, DNASE1L3-deficient, and DNASE1-deficient mice (Supplemental Fig. 3). Thus, these OCR and CGI regions were differentially fragmented in the cfDNA of the different genotypes compared to random genomic regions. The increased fragmentation at these OCR and CGI regions in the cfDNA of DNASE1L3-deficient mice correlated with an increased proportion of ultrashort, ≤80-bp fragments from OCRs and CGIs (Supplemental Fig. 4). The marked reduction in the proportion of ultrashort, ≤80-bp cfDNA in OCRs and CGIs in cfDNA of DNASE1-deficient mice (Supplemental Fig. 4) linked these hypomethylated short fragments to DNASE1 fragmentation of OCRs and CGIs.
Figure 3.

OCR and CGI fragments have a prominent role in the relative hypomethylation of cfDNA. (A,B) The normalized end density is calculated from fragment end counts divided by the median end counts in the ±3000 bp region. The median normalized end density for each genotype is shown in a ±1000-bp window over the aggregated TSS region (A), and CGI regions (B). cfDNA from wild-type mice is in green, DNASE1L3-deficient mice is in red, and DNASE1-deficient mice in blue. The fragmentation of cfDNA from DNASE1L3-deficient mice is increased and decreased in DNASE1-deficient mice. The y-axis scale ranges from 0.5% to 3%. (C) The regions ±500 bp around the center of TSS, PoI II, H3K4me3, and H3K27ac regions were merged with CGI regions. The proportion of fragments in these OCR and CGI regions are shown. cfDNA from DNASE1L3-deficient mice had a significantly increased proportion of OCR and CGI fragments. Welch's t-test was performed for significance testing. The y-axis scale ranges from 2% to 8%. (D) OCR and CGI fragments were bioinformatically excluded in masking analysis. The CpG methylation percentage increased after these fragments were masked. The relative hypomethylation of cfDNA from DNASE1L3-deficient mice is substantially diminished after masking but remains significantly different from the cfDNA methylation of wild-type mice. Welch's t-test was performed for significance testing. The y-axis scale ranges from 55%–85%. (E) Circos plots showing genome-wide CpG methylation percentages before (outer ring) and after (inner ring) masking OCR and CGI fragments. Each dot represents the CpG methylation percentage in a 1-Mb bin of the mouse autosome and is colored in blue if ≥70% and in red if <70%. Representative Circos plots are shown for wild-type, DNASE1L3-deficient, and DNASE1-deficient mice.
The percentages of fragments within these selected OCRs and CGIs are shown in Figure 3C. Compared to cfDNA from WT mice, cfDNA from DNASE1L3-deficient mice had 1.42-fold more fragments in the OCRs and CGIs (WT median 3.66% [IQR: 0.3%] vs. DNASE1L3-deficient median 5.20% [IQR: 0.5%], Welch t-test P = 0.004). The percentage of these fragments between DNASE1-deficient (3.4% [IQR 0.2%]) and WT mice was not significantly different (Welch t-test P = 0.2). Overall, these OCR and CGI fragment percentages from each sample were all greater than the expected percentage of these OCRs and CGIs in the mouse genome, which is 2.61%. Thus, these hypomethylated OCR and CGI fragments generally appeared to be slightly enriched in plasma cfDNA.
To explore the contribution of these OCR and CGI fragments to the methylation differences of cfDNA from mice of the different nuclease genotypes, we recalculated the overall methylation levels of cfDNA in each of the genotypes after bioinformatically masking these fragments from the OCRs and CGIs (Fig. 3D). The large degree of hypomethylation that was seen in the cfDNA of DNASE1L3-deficient mice (Fig. 1B) returned to a median CpG methylation of 74.7% [IQR: 0.8%] (Fig. 3D) and was no longer significantly different from the buffy coat methylation percentages (DNASE1L3-deficient masked vs. buffy coat, paired t-test P = 0.3). In fact, the overall methylation level for all genotypes increased after these OCR and CGI originated fragments were excluded (WT median 76.4% [IQR 0.5%]; DNASE1-deficient median 77.6% [IQR 0.7%]), and compared to their paired buffy coat, the methylation levels were not significantly different (WT masked vs. buffy coat paired t-test P = 0.1; DNASE1-deficient masked vs, buffy coat paired t-test P = 0.3). Essentially, after masking the OCR and CGI fragments in plasma cfDNA, the methylation level reverted to that of their paired buffy coat. Thus, the enrichment of OCR and CGI fragments in plasma cfDNA may explain the general hypomethylation of plasma cfDNA relative to its buffy coat genomic DNA seen in Figure 1B.
Figure 3E and Supplemental Figure 5 are Circos plots (Krzywinski et al. 2009) from each sample where each dot represents the CpG methylation percentage in a 1-Mb bin of each of the murine autosomes and is colored in blue if ≥70% and in red if <70%. The outer ring is the CpG methylation percentage in each 1-Mb bin with all fragments included, and the inner ring is with the fragments in OCRs and CGIs excluded. Masking the fragments in OCRs and CGIs reduced the relatively hypomethylated regions of cfDNA from WT, DNASE1-deficient, and DNASE1L3-deficient mice in a genome-wide manner. The majority of hypomethylated regions in cfDNA from DNASE1L3-deficient mice disappeared after masking these OCRs and CGIs. These results suggested that it was the fragments in these OCRs and CGIs that were a major cause of the observed hypomethylation of cfDNA from DNASE1L3-deficient mice; these OCR and CGI fragments also played a role in the general hypomethylation of plasma cfDNA compared with genomic DNA.
Differential methylation levels, and OCR and CGI proportions by cfDNA fragment size
Thus far, we had explored the cfDNA size profile of each genotype in unmethylated and methylated fragments, and we had found that the enrichment of OCR and CGI fragments played a role in the hypomethylation of both plasma cfDNA relative to buffy coat DNA and of plasma cfDNA of DNASE1L3-deficient mice. We deduced from the absence of this enrichment in the cfDNA of DNASE1-deficient mice that DNASE1 activity contributed to this enrichment of OCR and CGI fragments in the absence of DNASE1L3 in DNASE1L3-deficient mice. We wanted to look into further detail how CpG methylation of each genotype changed by fragment size since different fragment sizes were associated with different cfDNA structures.
To analyze the methylation level of cfDNA by fragment size, the CpG methylation percentage was calculated for all the fragments of a particular size and the median of each genotype was plotted in Figure 4A. In all genotypes, the CpG methylation appeared to follow a periodic pattern with peaks in methylation at around 170-bp, 360-bp, and 550-bp fragment sizes. These fragment sizes corresponded to sizes associated with mono-, di-, and trinucleosomes, suggesting that nucleosome-associated cfDNA fragments were more likely to be methylated.
Figure 4.
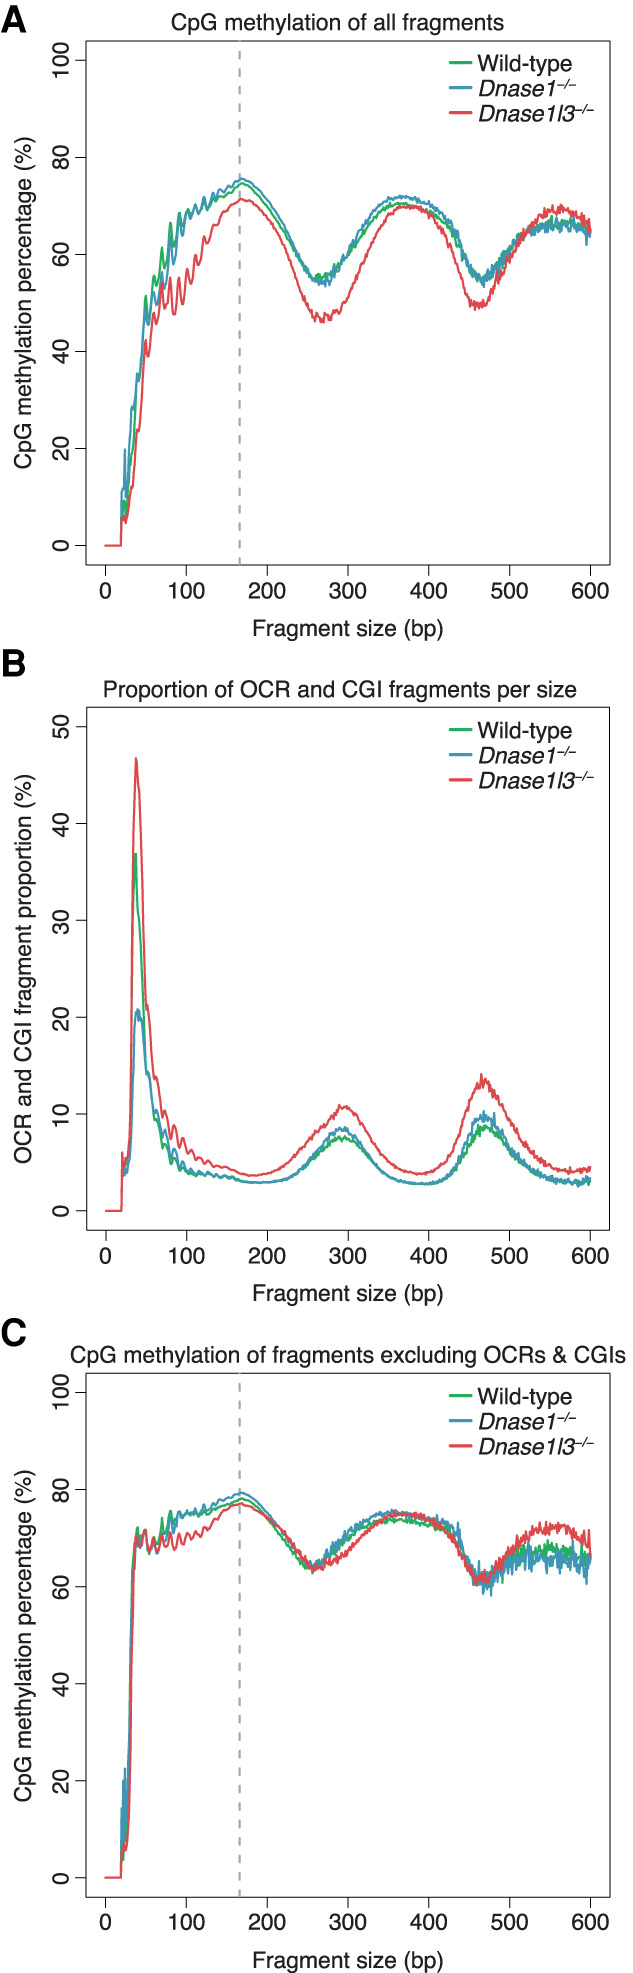
Differential methylation levels by cfDNA fragment size. (A) The CpG methylation percentage was calculated with all fragments of a particular size and the median of each genotype was plotted. A periodic pattern of methylation is shown with peaks in methylation at around 170 bp, 360 bp, and 550 bp, corresponding to sizes associated with mono-, di-, and trinucleosomes. cfDNA from DNASE1L3-deficient mice is hypomethylated from 0 to 500 bp. The y-axis scale ranges from 0% to 100%. (B) The proportion of OCR and CGI fragments within each fragment size was calculated and the median of each genotype was plotted. OCR and CGI fragments are a large proportion of fragments ≤80 bp. cfDNA from DNASE1L3-deficient mice has more OCR and CGI fragments in all fragment sizes while cfDNA from DNASE1-deficient mice has less OCR and CGI fragments in fragments ≤80 bp. The y-axis scale ranges from 0% to 50%. (C) The CpG methylation percentage for each fragment size was replotted after masking OCR and CGI fragments. The hypomethylation of cfDNA from DNASE1L3-deficient mice is diminished after masking in most size ranges, except ∼80–200 bp. The y-axis scale ranges from 0% to 100%. cfDNA from wild-type mice is in green, from DNASE1L3-deficient mice is in red, and from DNASE1-deficient mice in blue. Gray dashed line marks the 166-bp fragment size.
The troughs in cfDNA methylation percentage were around fragment sizes 270 bp and 460 bp. These troughs in cfDNA methylation corresponded to higher proportions of OCR and CGI fragments for all genotypes (Fig. 4B). Across all fragment sizes, the OCR and CGI fragment proportions were higher in cfDNA from DNASE1L3-deficient mice than in cfDNA from WT and DNASE1-deficient mice. In cfDNA from DNASE1-deficient mice, the OCR and CGI fragment proportions were reduced in the ultrashort fragments ≤80 bp, suggesting a role for DNASE1 in increasing the OCR and CGI proportions of cfDNA at these fragment sizes. In the fragment sizes associated with troughs in methylation (∼270 bp and ∼460 bp), cfDNA from DNASE1-deficient mice had a slightly higher OCR and CGI fragment proportion than in cfDNA from WT mice. The slightly higher OCR and CGI proportions in these fragment sizes might be related to other enzymes. Hence, we have shown that different fragments sizes of cfDNA were associated with different methylation levels and different proportions of OCR and CGI fragments.
To tease out the relationship between the methylation level and OCR and CGI fragment proportion among different fragment sizes, we bioinformatically masked the OCR and CGI fragments and replotted the CpG methylation level of each fragment size after masking (Fig. 4C). The OCR and CGI fragments had a CpG methylation level that was much lower than the CpG methylation profile with all fragments, although the general periodic pattern is present (Supplemental Fig 6D). After masking, while the periodic pattern persisted, the peak-trough difference decreased and the methylation percentage of all fragment sizes increased for all genotypes (Fig. 4C; Supplemental Fig. 6). For all genotypes, the fragment sizes that exhibited the greatest increase in methylation after masking these OCR and CGI fragments were those ≤80 bp and around the first trough around 270 bp (Supplemental Fig. 6A–C), corresponding to sizes that had higher proportions of OCR and CGI fragments. At 270 bp, the median methylation percentage rose from 55.3% to 65.8% in cfDNA from WT mice, 54.3%–65.2% in cfDNA from DNASE1-deficient mice, and 46.0%–63.9% in cfDNA from DNASE1L3-deficient mice. On the other hand, the methylation level of likely mononucleosome-associated fragments increased only minimally; for example, the 166-bp fragment median methylation percentage increased from 74.4% to 77.9% in WT, 75.4% to 79.3% in DNASE1-deficient cfDNA, and 71.3% to 77.1% in DNASE1L3-deficient cfDNA. These results illustrated again that the effect of the OCR and CGI fragments on cfDNA methylation was more evident for certain cfDNA sizes.
Comparing between the nuclease genotypes in Figure 4A, cfDNA from DNASE1L3-deficient mice was hypomethylated compared to that of WT and DNASE1-deficient mice in most fragment sizes up to ∼ 500 bp, which comprised 98%–99% of the total population of sequenced cfDNA. After masking the OCR and CGI fragments, the CpG methylation percentages for each fragment size largely overlapped with those of WT and DNASE1-deficient mice (Fig. 4C). Fragment sizes from around 80 bp to 160 bp still had a substantial difference in methylation percentage between cfDNA from DNASE1L3-deficient mice and cfDNA from WT and DNASE1-deficient mice after masking the OCR and CGI fragments. This could be due to the existence of other hypomethylated fragments not accounted for by our bioinformatic masking and/or the relative absence of hypermethylated fragments in these regions.
In contrast, the relative hypermethylation of cfDNA from DNASE1-deficient mice was less obvious and occurred only in certain size ranges, around the 166-bp and 360-bp methylation peaks (Fig. 4A). This relative hypermethylation did not appreciably change around the 166-bp peak after masking the OCR and CGI fragments (Fig. 4C). Thus, the relative hypermethylation seen in cfDNA from DNASE1-deficient mice was mostly in mono- and dinucleosomally sized cfDNA and was unlikely to be related to OCR and CGI fragments.
In summary, from this analysis, we have found that CpG methylation varies by fragment size and that certain fragment size ranges were enriched for OCR and CGI fragments. These OCR and CGI fragments were increased in DNASE1L3-deficient mice across all sizes but were substantially reduced in DNASE1-deficient mice only in the ultrashort, ≤80-bp size range. These results suggested that, while DNASE1 likely played a role in the enrichment of OCR and CGI fragments in the ≤80-bp size range, there might still be another process increasing the relative abundance and hypomethylation of OCR and CGI fragments in other sizes.
DNASE1L3 cuts methylated CpGs
While we had demonstrated that the hypomethylated OCRs and CGIs were a major contributor to the relative hypomethylation in cfDNA of DNASE1L3-deficient mice, the enrichment of OCRs and CGIs did not explain everything. Even after masking the OCR and CGI fragments, the relative hypomethylation of cfDNA from DNASE1L3-deficient mice compared with cfDNA from WT mice persisted (Welch t-test P = 0.006) (Fig. 3D), especially in fragment sizes 80 bp to 200 bp (Fig. 4C). Also, the major role of DNASE1 in enriching OCR and CGI fragments appeared to be in the ultrashort, ≤80-bp fragments, and we still had not clarified the role of DNASE1L3 in cfDNA methylation. We reasoned that the relative hypomethylation seen in the plasma of DNASE1L3-deficient mice could also result from a decreased contribution of methylated fragments and wondered if DNASE1L3 would cut methylated fragments.
We devised a method to interrogate whether or not DNASE1L3 could cut methylated CpGs. To do this, we first identified methylated and unmethylated CpGs. From a downloaded data set comprised of bisulfite sequencing of eight different mouse tissues (bone marrow, thymus, spleen, kidney, heart, liver, large intestines, small intestines) with two replicates each, we mined for CpGs that were methylated in 90% of all tissue and replicate reads and identified them as putatively methylated CpGs (545,720 CpGs in total). Similarly, we also mined for CpGs that were unmethylated in 80% of the reads in the data set and identified them as putatively unmethylated CpGs (7140 CpGs in total). Using CpGs unmethylated in 90% of reads for subsequent analysis was not possible due to the extremely low number of CpGs that fulfilled this condition (11 CpGs in total). With these putatively methylated and unmethylated CpGs identified from this downloaded data set, we confirmed that the actual methylation level of these CpGs in our plasma data set would be similar to its expected methylation level. For putatively methylated CpGs, these CpGs had a >90% methylation level in the plasma cfDNA of each sample, and for the putatively unmethylated CpGs, these CpGs had a <20% methylation level in our plasma cfDNA of each sample (Supplemental Fig. 7).
At these putatively methylated and unmethylated CpGs, we looked specifically at fragment ends as a marker of nuclease cutting. When aggregated together placing the putatively methylated Cs at position 0, there was an end density pattern over the surrounding ±1000 bp that was strongly periodic, reminiscent of the nucleosomal array found around CTCF regions (Fig. 5A; Fu et al. 2008; Kelly et al. 2012). These results suggested that these putatively methylated CpGs that we identified likely originated from DNA in a packed chromatin structure, which, only when the surrounding nucleosomes were well-phased, would give rise to such clear periodicity. Narrowing our focus to just the putatively methylated C, we found that there was an increase in normalized end density at the putatively methylated C in all plasma samples from WT and DNASE1-deficient mice (Fig. 5B). Thus, in the presence of DNASE1L3 in the cfDNA of WT and DNASE1-deficient mice, there were very specific cuts at the putatively methylated C. In contrast, in the plasma of DNASE1L3-deficient mice, the putatively methylated C was no longer preferentially cut compared to its surrounding −6 to +8 bp region (Fig. 5C). Therefore, this evidence suggested that DNASE1L3 was responsible for cleaving these putatively methylated Cs in these nucleosomal arrays and that, in its absence, the fragmentation pattern was no longer as specific, falling in a broader −6 to +8 bp region, which was likely a linker region between nucleosomes and likely cut by DNASE1. Furthermore, in the absence of DNASE1L3, the positions with the highest end density in this linker region, i.e., the new preferential cutting sites, were exactly 10 bp apart. This could explain the increase in prominence of the 10-bp periodicity in the cfDNA size profile of DNASE1L3-deficient mice.
Figure 5.

Normalized end densities over putatively methylated and unmethylated CpGs. (A–F) Putatively methylated CpGs and unmethylated CpGs were identified, and the plasma cfDNA fragment end density over these CpGs was normalized by the median end counts of the ±1000 bp region. A ±1000-bp window (A,D) and a ±20-bp window (B,C,E,F) is shown. The identified C is placed at position 0. There is substantial overlap in the normalized end density profiles among the genotypes within the ±1000 bp window (A,D). Comparisons between the normalized end density of all wild-type samples (green) and all DNASE1-deficient mice samples (blue) is shown, with substantial overlap between them (B,E). Comparisons between the normalized end density of all wild-type samples (green) and all DNASE1L3-deficient mice samples (red) is shown (C,F). In the presence of DNASE1L3, there is a distinct preference for fragments to end at methylated CpGs in the cfDNA of WT and DNASE1-deficient mice (B). In the absence of DNASE1L3, this preference for fragments to end at methylated CpGs is absent (C). There is no particular preference for fragments to end at unmethylated CpGs (E,F). The y-axis scale ranges from 0.5% to 2%.
On the other hand, the putatively unmethylated CpGs appeared to originate from very different genomic regions compared with the putatively methylated CpGs. The surrounding region of the putatively unmethylated CpGs demonstrated a generalized increase in normalized end density in the −400 to +400 bp regions around the putatively unmethylated CpGs (Fig. 5D). These larger regions were thus more accessible to fragmentation, a property which would suggest that these regions were likely to be OCRs. In cfDNA from WT and DNASE1-deficient mice, there was no particular preference for the putatively unmethylated C to be cut compared to its surrounding ±1000 bp region (Fig. 5E). In the plasma of DNASE1L3-deficient mice, the putatively unmethylated C was also not preferentially cut; instead, its flanking bases had a higher end density compared to cfDNA of WT mice (Fig. 5F). This increase in fragment ends in the region flanking the putatively unmethylated C in cfDNA of DNASE1L3-deficient mice echoed our previous findings in the OCRs and CGIs. Similarly, the decrease in end density in the region flanking the putatively unmethylated C in cfDNA of DNASE1-deficient mice (Fig. 5E) was suggestive again that DNASE1 played a major role in creating the fragment ends around unmethylated regions. Thus, from this analysis, we have uncovered that, in the context of CpGs, DNASE1L3 prefers to cut at methylated CpGs.
DNASE1L3-deficient human subjects
To investigate the implications of our findings in human cfDNA, we performed bisulfite sequencing of plasma samples from three DNASE1L3-deficient subjects (H2, H4, and V11) and one heterozygous parent (H1) (Chan et al. 2020). DNASE1L3-deficient patients have familial autosomal recessive forms of childhood systemic lupus erythematosus (SLE) and hypocomplementemic urticarial vasculitis syndrome (HUVS) (Al-Mayouf et al. 2011; Özçakar et al. 2013; Carbonella et al. 2017). Similar to DNASE1L3-deficient mice, the plasma cfDNA of DNASE1L3-deficient subjects was hypomethylated compared to both controls and the heterozygous parent (CpG methylation of DNASE1L3-deficient subjects H2: 69.66%, H4: 70.1%, and V11: 69.32%, vs. median of eight controls: 74.90%, and H1: 73.84%) (Fig. 6A). The plasma cfDNA methylation levels of all controls and subjects were also lower than that of buffy coat samples (Fig. 6A). This hypomethylation of plasma cfDNA from DNASE1L3-deficient patients was seen in both TSS and random regions and is thus also a genome-wide phenomenon (Fig. 6B; Supplemental Fig. 8A).
Figure 6.
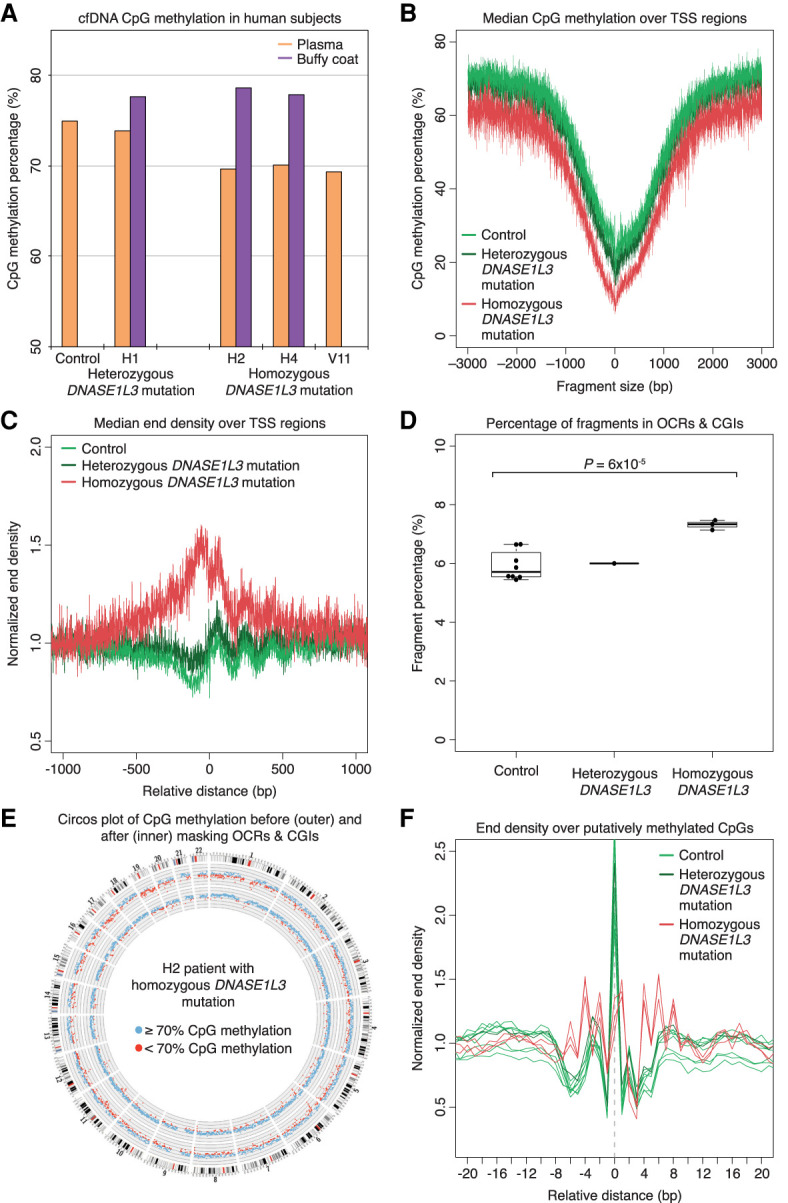
cfDNA from DNASE1L3-deficient patients mimics cfDNA from DNASE1L3-deficient mice. (A) CpG methylation percentage of the human plasma (orange) and buffy coat (purple) samples are shown. H2, H4, and V11 have the homozygous frameshift c.290_291delCA (p.Thr97Ilefs*2) DNASE1L3 mutation, and H1 is the heterozygous parent of H2 and H4. The median value of eight control samples is shown. The y-axis scale is from 50% to 85%. (B) The CpG methylation percentage of fragments from each sample was calculated over the aggregated TSS regions, and the median of each sample type is shown in a ±3000-bp window. cfDNA from DNASE1L3-deficient patients is relatively hypomethylated. The y-axis scale ranges from 0% to 80%. (C) The median normalized end density for each sample type is shown in a ±1000-bp window over the aggregated TSS region. cfDNA from DNASE1L3-deficient patients is more fragmented with more fragment ends in TSS regions. The y-axis scale ranges from 0.5% to 2%. (D) The proportion of fragments in OCR and CGI regions are shown. OCRs are defined as the regions ±500 bp around the center of TSS, H3K4me3, and H3K27ac regions. cfDNA from DNASE1L3-deficient subjects had a significantly increased proportion of OCR and CGI fragments. Welch's t-test was performed between control and DNASE1L3-deficient subjects. The y-axis scale ranges from 0% to 10%. (E) A representative Circos plots from a DNASE1L3-deficient patient showing genome-wide CpG methylation percentages before (outer ring) and after (inner ring) masking OCR and CGI fragments. Each dot represents the CpG methylation percentage in a 1-Mb bin of the mouse autosome and is colored in blue if ≥70% and in red if <70%. Masking OCR and CGI fragments diminishes the genome-wide hypomethylation in the cfDNA of DNASE1L3-deficient patients. (F) Normalized end density over putatively methylated CpGs is shown in a ±20-bp window. The identified C is placed at position 0. In control and heterozygous DNASE1L3 samples, there is a distinct preference to cut at the methylated CpG, which is lost in DNASE1L3-deficient patients. The y-axis scale ranges from 0% to 2.5%. cfDNA from control samples is in light green, the heterozygous DNASE1L3 parent is in dark green, and DNASE1L3-deficient subjects is in red.
Similarly, the plasma cfDNA of DNASE1L3-deficient patients had a shorter size profile that was more exaggerated in 0%-methylated fragments than in 100%-methylated fragments (Supplemental Fig. 8B,C). These changes corresponded to an increase in normalized end density in hypomethylated open chromatin TSS regions (Fig. 6C), which was in contrast to random regions (Supplemental Fig. 8D). These results suggested that there was increased fragmentation of DNA at hypomethylated regions in the cfDNA of DNASE1L3-deficient patients. These interpretations were substantiated by the significant increase in fragments from OCR and CGI regions in the plasma of DNASE1L3-deficient patients compared to that of controls (control median 5.71% [IQR 0.7%] vs. DNASE1L3-deficient median: 7.34% [IQR: 0.2%], Welch t-test P = 6 × 10⁻⁵) (Fig. 6D). When these OCR and CGI fragments were bioinformatically masked, the plasma CpG hypomethylation reverted to the level seen in controls (Fig. 6E; Supplemental Fig. 9). Overall, the increased cutting of OCR and CGI regions into short, hypomethylated fragments also accounted for the relative hypomethylation seen in the cfDNA of DNASE1L3-deficient subjects.
The cutting preference of DNASE1L3 was also demonstrated in human cfDNA. Control plasma cfDNA was found to end preferentially at putatively methylated CpGs (Fig. 6F). This preference for fragments to end at the putatively methylated CpGs appeared to be more pronounced in human cfDNA compared to mice cfDNA, with the normalized end density around 2.4 in humans compared to 1.5 in mice. This end preference was absent in the cfDNA of DNASE1L3-deficient subjects with a resulting end density profile showing peaks in the broader −6 to +8 bp region (Fig. 6F). Thus, we found that DNASE1L3-deficient patients had cfDNA that was largely similar to DNASE1L3-deficient mice, confirming this link between nuclease activity and cfDNA methylation in human plasma.
Discussion
In this work, we have discovered that different nuclease deficiencies affect the apparent methylation level and size profile of plasma cfDNA on a genome-wide level. We have found that the plasma cfDNA of DNASE1L3-deficient mice and humans is more hypomethylated than cfDNA from control samples and has a shorter size profile with an increase in short, ≤150-bp fragments and a decrease in 166-bp fragments. This is in contrast to the cfDNA of DNASE1-deficient mice, which is more hypermethylated than WT cfDNA and has a slightly longer size profile with a decrease in short, ≤150-bp fragments and an increase in 166-bp fragments. Since the methylation levels of the buffy coat genomic DNA are similar among the different genotypes, the differences in plasma cfDNA methylation are likely related to the nuclease activities during the DNA fragmentation process.
In our exploration of the cause of hypomethylation and hypermethylation in the plasma cfDNA of DNASE1L3-deficient and DNASE1-deficient mice, respectively, we found that cfDNA from DNASE1L3-deficient mice had more hypomethylated fragments originating from increased fragmentation of open chromatin regions and CpG islands across the whole genome. The reduction of these fragments in cfDNA of DNASE1-deficient mice revealed the culprit to be DNASE1. The absence of DNASE1 activity in DNASE1-deficient mice allowed us to deduce that DNASE1 increased the fragmentation of these OCRs and CGIs and gave rise to an increased proportion of short fragments, especially ultrashort, ≤80-bp fragments, in these regions (Fig. 7). This understanding of DNASE1 activity is consistent with the field and technology of using DNASE1 to probe DNase I hypersensitivity regions in DNase-seq (Boyle et al. 2008).
Figure 7.

Deduced activities of DNASE1 and DNASE1L3. DNASE1 (blue) prefers to cleave unmethylated and open chromatin DNA. By fragmenting these regions, DNASE1 increases the representation of these OCR and CGI regions in plasma, especially in fragments sizes ≤80 bp, resulting in the relative hypomethylation of cfDNA. These OCR and CGI regions are unequally represented among different cfDNA sizes. DNASE1L3 (red) is effective at cutting methylated fragments and increases the representation of methylated fragments in plasma cfDNA compared with DNASE1. DNASE1L3's cutting preference likely results in the prominence of the 166-bp fragment size. The combination of these preferences leads to the eventual cfDNA size profile and methylation profile observed for each fragment size.
Bioinformatically masking these OCR and CGI fragments demonstrated that these regions were a major contributor to the relative hypomethylation seen in the plasma cfDNA of DNASE1L3-deficient mice. Furthermore, we found that these OCR and CGI fragments were relatively enriched in plasma cfDNA, generally, and that this enrichment explained the relative hypomethylation of plasma cfDNA compared to its genomic DNA (Fig. 3). It appears that DNASE1 activity in hypomethylated OCRs and CGIs increased their fragmentation and allowed for the enrichment of these hypomethylated regions in plasma cfDNA. These results also explain the relative hypermethylation of plasma cfDNA from DNASE1-deficient mice. While accounting for only 3%–6% of the total sequenced cfDNA population in our samples, these OCR and CGI fragments had a substantial effect on the apparent methylation level of plasma cfDNA.
The cfDNA size profile actually changes most noticeably in the absence of DNASE1L3. Our analysis with the putatively methylated and unmethylated CpGs shed some light on the reason. We demonstrated that the absence of DNASE1L3 decreased cuts at methylated CpGs. This is supported by existing literature showing that DNASE1L3 can cleave chromatin with high efficiency to almost undetectable levels without proteolytic help (Napirei et al. 2009; Sisirak et al. 2016).
Since the genome is >97% chromatin with most of its CpGs methylated, most of the genome is susceptible to DNASE1L3 activity but less so to DNASE1. Thus, it is not surprising that the absence of DNASE1L3 would markedly affect the cfDNA size profile. One of the more noticeable changes of the cfDNA size profile in cfDNA from DNASE1L3-deficient mice is the diminished prominence of the 166-bp peak. We hypothesize that the 166-bp fragment size may be produced by the relatively strong local preference for cutting these methylated Cs by DNASE1L3 in the linker regions of chromatin. In the absence of DNASE1L3, two new fragment end preferences appear that are exactly 10 bp away from each other. This may reflect a preference of another enzyme, such as DNASE1, in the linker region. This may also account for the increased prominence of the 10-bp periodicity in the cfDNA of DNASE1L3-deficient mice.
In fact, this preference by DNASE1L3 for creating 166-bp fragments is apparent in cfDNA from DNASE1-deficient mice. In such mice, both 0%- and 100%-methylated cfDNA were fragmented to a very similar size profile with a very sharp 166-bp peak and exhibited limited shortening of unmethylated fragments. Thus, in the absence of DNASE1, DNASE1L3 appears to have limited preference to cut unmethylated fragments into smaller fragments. In fact, the end density over the putatively unmethylated CpGs decreased in the cfDNA of DNASE1-deficient mice. These results suggest that DNASE1L3, in the context of CpGs, prefers to cut methylated CpGs, which would increase the methylated portion of plasma cfDNA since methylated CpGs are more abundant than unmethylated CpGs in the genome (Fig. 7).
This work also reveals that cfDNA molecules of different sizes are associated with different methylation levels. cfDNA fragments with sizes that are widely presumed to be associated with mono-, di-, and trinucleosomes (around 170 bp, 360 bp, and 550 bp) are relatively hypermethylated, while fragments with intermediary sizes (around 270 bp and 460 bp) are relatively hypomethylated. Masking the OCR and CGI fragments demonstrated that the hypomethylation was disproportionally affected in fragments ≤80 bp and around the troughs for all three genotypes. These fragment sizes actually have a higher proportion of OCR and CGI fragments and may reflect more the activity of DNASE1. We have thus demonstrated that different genomic regions are not represented evenly in the different sizes of cfDNA.
Examining the differences in the methylation level of each cfDNA size between the genotypes reveals that DNASE1L3 plays a role as well. DNASE1L3, which can cut methylated CpGs, appeared to give rise to more 166-bp fragments that are methylated in the cfDNA of DNASE1-deficient mice. Mononucleosomally sized fragments in the cfDNA of DNASE1-deficient mice appear to be the most methylated, with the methylation level decreasing with each additional nucleosome, suggesting that DNASE1L3 contribution of methylated fragments is highest for mononucleosomes (Fig. 4). One interpretation of this is that the nucleosome-associated fragment sizes appear more methylated because of increased contribution of methylated fragments by the cutting preferences of DNASE1L3. Also, the remaining difference in methylation level in fragment sizes 80–200 bp between cfDNA of DNASE1L3-deficient mice and cfDNA of both WT and DNASE1-deficient mice after masking the OCR and CGI fragments suggests that a proportion of these fragment sizes may originate from DNASE1L3 cutting preferences. A potential reason why DNASE1L3 could play a role in these particular fragment sizes is that these fragment sizes could originate from intranucleosomal cutting of methylated DNA. There may be other nucleases that may play a role as well, and future studies with double knockout models would further refine the analysis. Future biochemical characterization of these nucleases, such as digestion experiments with DNASE1 and DNASE1L3, would validate these findings. However, our observations demonstrate that particular cfDNA sizes reflect a fragmentation process that is influenced to methylation.
In this paper, we have been able to deduce the actions and preferences of DNASE1 and DNASE1L3. We have shown not only that nucleases affect the apparent cfDNA methylation level but also how each nuclease affects it. We have also demonstrated that the cfDNA size profile, which is quintessentially the end product of the fragmentation process, reflects these differential nuclease activities on methylation. Thus, we have shed some light on these fundamental properties of cfDNA.
These findings have been replicated in cfDNA from human subjects with DNASE1L3 deficiency. Homozygous DNASE1L3-deficiency in humans results in familial autosomal recessive forms of childhood SLE and HUVS (Al-Mayouf et al. 2011; Özçakar et al. 2013; Carbonella et al. 2017). SLE is an autoimmune disease characterized by the development of anti-dsDNA antibodies. The loss of DNA self-tolerance with DNASE1L3 deletion is presumably related to the disrupted clearance of nucleosomes by DNASE1L3 (Napirei et al. 2000; Sisirak et al. 2016). Even in SLE patients that do not have monogenic causes of DNASE1L3-deficiency, we have previously found that they have an increased proportion of short, hypomethylated cfDNA similar to the profile seen in DNASE1L3-deficient patients (Chan et al. 2014). These patients were found to have reduced DNase activity in serum and presumably impaired clearance of nucleosomes (Bruschi et al. 2020). Thus, reduced circulating DNase activity may have a pathogenic role in SLE. Lastly, the result of the heterozygous DNASE1L3 sample largely falls in between those of control and homozygous DNASE1L3 samples, suggesting that DNASE1L3 gene dosage may produce a quantitative trait. The relationship between DNASE1L3 genotype and DNASE1L3 activity may be interesting to explore in the future.
These observations have a number of implications for the field of cfDNA. The fragmentation process of cfDNA contributes to the apparent methylation of cfDNA. This may be of relevance to the study of tissue-specific DNA since circulating tumor DNA and circulating fetal DNA are known to be hypomethylated. The nuclease activity in a person could affect the overall cfDNA methylation and result in a false positive testing. Since certain fragment sizes have different methylation levels reflecting different proportions of different genomic regions, it may be advantageous to focus diagnostic testing on certain fragment sizes because of this underlying biology. As cfDNA fragmentomics is an emerging source for cancer biomarkers, a deeper understanding of nuclease effect on cfDNA fragmentation is vital. We believe that a combination of size-based and nuclease-based analysis is a powerful approach for investigating cfDNA biology and may have diagnostic applications.
Methods
Murine models
Mice with a CRISPR-Cas9-targeted deletion of exon 5 in Dnase1l3 (mm9 Chr14: 8,809,531–8,810,216) on a C57BL/6NJ background were generated by The Jackson Laboratory. Mice carrying a targeted allele of Dnase1 [Dnase1tm1.1(KOMP)Vlcg] on a B6 background and WT control mice on a B6 background were obtained from the Knockout Mouse Project Repository of the University of California at Davis. All experimental procedures were approved by the Animal Experimentation Ethics committee of The Chinese University of Hong Kong (CUHK) and performed in compliance with “Guide for the Care and Use of Laboratory Animals” (8th edition, 2011) established by the National Institutes of Health. The mice were maintained in the Laboratory Animal Centre of CUHK. Male and female mice aged 14–20 wk were used for experiments. An analysis on the influence of sex and gender on the results was not done since their blood samples were pooled together.
Murine sample collection
Mice were sacrificed and exsanguinated by cardiac puncture. Whole blood was placed into EDTA-containing tubes (1.3 mL K3E microtubes, Sarstedt) and immediately separated by a double centrifugation protocol (1600g for 10 min at 4°C, then recentrifugation of the plasma at 16,000g for 10 min at 4°C) (Chiu et al. 2001). Plasma from three to four mice were collected into each pool, yielding 1.1–1.9 mL plasma per pool. In total, we created six pools of WT from plasma of 20 WT mice, six pools of Dnase1l3−/− from plasma of 20 Dnase1l3−/− mice, and two pools of Dnase1−/− from plasma of eight Dnase1−/− mice.
Human subjects
We recruited three subjects (H2, H4, and V11) with DNASE1L3 deficiency and one heterozygous parent (H1) from the Istituto Giannina Gaslinin (Italy) and The Hospital for Sick Children (SickKids, Canada) with written informed consent. The three DNASE1L3-deficient subjects (H2, H4, and V11) have a homozygous frameshift c.290_291delCA (p.Thr97Ilefs*2) mutation, and H1 is the heterozygous parent of H2 and H4. Clinical details of these patients were previously published (Chan et al. 2020). Plasma data of eight healthy individuals from a previously published data set were used as controls (Chan et al. 2013). Plasma was collected for all human subjects, but paired buffy coat was available only for H1, H2, and H4. The study was approved by the Joint Chinese University of Hong Kong-Hospital Authority New Territories East Cluster Clinical Research Ethics Committee, the ethics committee of the Istituto Giannina Gaslini (approval BIOL 6/5/04), and the SickKids Research Ethics Board.
DNA extraction and bisulfite DNA sequencing
Plasma DNA was extracted with the QIAamp Circulating Nucleic Acid Kit (Qiagen), and buffy coat DNA was extracted with the QIAamp DNA Blood Mini Kit (Qiagen), then sonicated to a median size of 350 bp (Covaris). Indexed DNA libraries were constructed using the TruSeq DNA Nano Library Prep Kit (Illumina) with bisulfite modification using the EpiTect Bisulfite Kit (Qiagen). The bisulfite-converted DNA libraries were enriched with 12 cycles of PCR and analyzed on Agilent 4200 TapeStation (Agilent Technologies) using the High Sensitivity D1000 ScreenTape System (Agilent Technologies) for quality control and gel-based size determination. Libraries were quantified by the Qubit dsDNA High-Sensitivity Assay Kit (Thermo Fisher Scientific) before sequencing, and 2 × 75-bp paired-end sequencing was performed on the HiSeq 4000 platform (Illumina) for the plasma libraries and on the NextSeq 500 platform (Illumina) for the buffy coat libraries.
Quality control, trimming, and alignment of bisulfite sequencing data
Sequences were assigned to their corresponding samples based on their six-base index sequence. The adapter sequences were removed and low quality bases with Phred score below 20 were trimmed from the paired-end bisulfite sequencing reads. Cleaned reads were aligned to the reference genome (mouse: NCBI MGSCv37/UCSC mm9; human: NCBI GRCh37/USCS hg19; non-repeat-masked) with a maximum of two mismatches. Paired-end reads sharing the same start and end genomic coordinates were deemed PCR duplicates and were discarded from downstream analysis. The methylation densities of all CpG sites across the genome were generated by Methy-Pipe (Jiang et al. 2010). Supplemental Tables 1 and 2 summarize the number of unique fragments, sequencing depth, and bisulfite conversion efficiency obtained for each sample after bisulfite conversion in the mouse and human data set, respectively. The bisulfite conversion efficiency of each sample was calculated from 1-CHH methylation percentage since cytosines in CHH contexts are expected to be unmethylated and fully converted to thymines (Leontiou et al. 2015). No significant differences were found in CHH bisulfite conversion efficiencies among different fragment sizes in the cfDNA of WT mice (significance testing by Mann–Whitney U test) (Supplemental Fig. 10). The deletions of the Dnase1 and Dnase1l3 genes in the mouse data were confirmed in the aligned data (Supplemental Fig. 11). We think that reanalyzing the human data using the GRCh38 (UCSC hg38) human reference genome would not significantly affect the results because the biggest difference between the two reference genomes was the sequence representation in centromeres (i.e., representing a type of repetitive region). Short sequencing reads in these regions would tend to have multiple alignments and thus would be discarded in our downstream analysis. Similarly, reanalyzing the mouse data using the GRCm38 (UCSC mm10) mouse reference genome would likely not affect the results significantly because only uniquely aligned reads were included for downstream analysis.
Calculation of end density and methylation level around different regions
RNA polymerase II (Pol II), H3K4me3, and H3K27ac regions were downloaded from the Human and Mouse ENCODE project (The ENCODE Project Consortium 2012; Shen et al. 2012). The transcriptional start sites of all genes and the CpG islands were downloaded from UCSC, and 10,000 random nonoverlapping regions of 10,000-bp length were randomly selected across the whole genome by BEDTools (v2.27.1) (Quinlan and Hall 2010). Using a visualization window size of ±1000 bp, the fragment end counts were normalized by the median end counts in the ±3000 bp region to obtain the normalized end density. The methylation level of these regions was calculated from the CpG sites in the corresponding regions. The respective sample medians were calculated and plotted.
cfDNA size of 0%- and 100%-methylated fragments
The genome coordinates of the aligned ends were used to deduce the size of the whole fragment of the sequenced cfDNA. To identify 0%- and 100%-methylated fragments, fragments with three or more CpG sites were used to calculate the methylation percentage. Those with zero out of at least three CpGs methylated were labeled as a 0%-methylated fragment, and those with all out of at least three CpGs methylated were labeled as 100%-methylated fragments. The counts of 0%- and 100%-methylated fragments are listed in Supplemental Table S3. To confirm that these counts would be sufficient for size analysis, we calculated the difference in cumulative frequency (delta S) between 0%- and 100%-methylated fragments at 80 bp in a simulation using different fragment counts. The simulation was repeated 50 times at each fragment size and the mean (bar), minimum (lower whisker), and maximum (upper whisker) value of delta S is shown in Supplemental Figure 12. Even at 0.5 M counts, the mean difference between 0%- and 100%-methylated fragments at 80 bp is not significantly different than if that analysis was done with 1.4 M counts. Beginning from 1.2 M counts, the max-min range is slightly narrower. The median size of each genotype in these fragment types was plotted.
OCR and CGI fragment analysis
The region ±500 bp around the center of TSS, PoI II, H3K4me3, and H3K27ac regions were merged with CGI regions. Fragments were considered within these regions if at least one base overlapped with these regions. The fragment percentage and the size profile of the fragments within these regions were calculated, and the methylation level and size profile were recalculated after masking these regions. For the Circos plot (Krzywinski et al. 2009), the reference genome was split into 1-Mb bins, and each dot in the Circos plot represents the methylation level of each bin deduced from all the CpG sites within the 1-Mb bin.
Analysis of putatively methylated and unmethylated CpGs
Whole-genome bisulfite sequencing (WGBS) data for eight mouse tissues with two biological replicates were downloaded from the ENCODE portal (Davis et al. 2018; https://www.encodeproject.org/) using the following identifiers: ENCFF874IPH, ENCFF249MKR, ENCFF916JME, ENCFF012ENO, ENCFF283GDL, ENCFF348XNA, ENCFF978EJO, ENCFF282MIR, ENCFF779LLA, ENCFF060ISR, ENCFF853NGK, ENCFF373MDU, ENCFF306KYH, ENCFF663AVX, ENCFF678IZX, ENCFF918TYN, ENCFF098RUM, ENCFF585VLM, ENCFF847MPY, ENCFF980YJZ, ENCFF073OSB, ENCFF804QBF, ENCFF192LZC, ENCFF442AJP, ENCFF541AEY, ENCFF753BBR, ENCFF798LHE, ENCFF082ZSO, ENCFF623FPU, ENCFF422TOH, ENCFF240XBY, ENCFF566GDN, ENCFF340YVI, ENCFF703DEV, ENCFF802SFU, ENCFF306ZPW. WGBS data for nine human tissues were obtained from the Roadmap Epigenomics Project (Roadmap Epigenomics Consortium et al. 2015; http://www.roadmapepigenomics.org/) using the following identifiers: GSM1010983, GSM1010981, GSM983648, GSM983649, GSM1010984, GSM983650, GSM916049, GSM983647, GSM983651, GSM1010987, GSM983645, GSM983646, GSM983652, GSM1120324, GSM1010978, GSM1058027, GSM1059433, GSM1120321. Alignment and methylation analysis of these data sets were performed by Bismark with the ENCODE WGBS single-end pipeline (Krueger and Andrews 2011).
Putatively unmethylated and methylated CpG sites were identified from these data sets with methylation level cutoffs at ≤20% and ≥90%, respectively. From the mouse data set, 545,720 putatively methylated CpGs, and 7140 putatively unmethylated CpGs were identified. From the human data set, 439,114 putatively methylated CpGs were identified.
For the end density analysis, the respective CpG sites were aggregated and the normalized end density within ±1000 bp and a ±20-bp window is shown. The normalized end density is the end count divided by the median end counts of the ±1000 bp region. Fragments with any of its bases covering either the C or G of the identified CpGs were used in the calculation of the CpG methylation at these putatively unmethylated or methylated CpG sites.
Statistical analysis
Analysis was performed by in-house bioinformatics programs, which were written in Perl and R languages (Supplemental Code; R Core Team 2018). Buffy coat versus plasma fractions and 0%- versus 100%-methylated fragments of the same sample were considered paired and evaluated using the paired t-test. All other comparisons were evaluated using the Welch's t-test. A P-value of <0.05 was considered statistically significant, and all probabilities were two-tailed.
Data access
All raw sequencing data generated in this study have been submitted to the European Genome-Phenome Archive (EGA; https://ega-archive.org/) under accession number EGAS00001004696 for the mouse samples and EGAS00001004897 for the human samples.
Supplementary Material
Acknowledgments
We would like to thank Lee Wing Shan, Jin Yongjie, and Dr. Shang Huimin for their technical assistance. This work was supported by the Research Grants Council of the Hong Kong SAR Government under the Theme-based Research Scheme (T12-403/15-N, T12-401/16-W), a collaborative research agreement from Grail, and the Vice Chancellor's One-Off Discretionary Fund of The Chinese University of Hong Kong (VCF2014021). Y.M.D.L. is supported by an endowed chair from the Li Ka Shing Foundation.
Author contributions: Y.M.D.L., R.W.K.C., K.C.A.C., and D.S.C.H. designed the study. D.S.C.H. and R.W.Y.C. performed the bench work. K.O.L. and D.K.L.W. performed the animal work. L.T.H. and S.V. provided the human samples. M.N. performed the bioinformatics analysis. Y.M.D.L., R.W.K.C., K.C.A.C., P.J., and D.S.C.H. analyzed the data. D.S.C.H., R.W.K.C., and Y.M.D.L. wrote the paper.
Footnotes
[Supplemental material is available for this article.]
Article published online before print. Article, supplemental material, and publication date are at https://www.genome.org/cgi/doi/10.1101/gr.275426.121.
Freely available online through the Genome Research Open Access option.
Competing interest statement
R.W.K.C., K.C.A.C., and Y.M.D.L. hold equities in DRA, Take2, and Grail, are consultants to Grail and receive research funding from Grail/Cirina. Y.M.D.L. is a scientific cofounder and a member of the scientific advisory board for Grail. Y.M.D.L., R.W.K.C., and K.C.A.C. are cofounders and board members of DRA Company Limited. P.J. holds equity in Grail and is a director of KingMed Future.
References
- Al-Mayouf SM, Sunker A, Abdwani R, Abrawi SA, Almurshedi F, Alhashmi N, Al Sonbul A, Sewairi W, Qari A, Abdallah E, et al. 2011. Loss-of-function variant in DNASE1L3 causes a familial form of systemic lupus erythematosus. Nat Genet 43: 1186–1188. 10.1038/ng.975 [DOI] [PubMed] [Google Scholar]
- Boyle AP, Davis S, Shulha HP, Meltzer P, Margulies EH, Weng Z, Furey TS, Crawford GE. 2008. High-resolution mapping and characterization of open chromatin across the genome. Cell 132: 311–322. 10.1016/j.cell.2007.12.014 [DOI] [PMC free article] [PubMed] [Google Scholar]
- Bruschi M, Bonanni A, Petretto A, Vaglio A, Pratesi F, Santucci L, Migliorini P, Bertelli R, Galetti M, Belletti S, et al. 2020. Neutrophil extracellular traps profiles in patients with incident systemic lupus erythematosus and lupus nephritis. J Rheumatol 47: 377–386. 10.3899/jrheum.181232 [DOI] [PMC free article] [PubMed] [Google Scholar]
- Carbonella A, Mancano G, Gremese E, Alkuraya FS, Patel N, Gurrieri F, Ferraccioli G. 2017. An autosomal recessive DNASE1L3-related autoimmune disease with unusual clinical presentation mimicking systemic lupus erythematosus. Lupus 26: 768–772. 10.1177/0961203316676382 [DOI] [PubMed] [Google Scholar]
- Chabon JJ, Hamilton EG, Kurtz DM, Esfahani MS, Moding EJ, Stehr H, Schroers-Martin J, Nabet BY, Chen B, Chaudhuri AA, et al. 2020. Integrating genomic features for non-invasive early lung cancer detection. Nature 580: 245–251. 10.1038/s41586-020-2140-0 [DOI] [PMC free article] [PubMed] [Google Scholar]
- Chan KCA, Jiang P, Chan CWM, Sun K, Wong J, Hui EP, Chan SL, Chan WC, Hui DSC, Ng SSM, et al. 2013. Noninvasive detection of cancer-associated genome-wide hypomethylation and copy number aberrations by plasma DNA bisulfite sequencing. Proc Natl Acad Sci 110: 18761–18768. 10.1073/pnas.1313995110 [DOI] [PMC free article] [PubMed] [Google Scholar]
- Chan RWY, Jiang P, Peng X, Tam L-S, Liao GJW, Li EKM, Wong PCH, Sun H, Chan KCA, Chiu RWK, et al. 2014. Plasma DNA aberrations in systemic lupus erythematosus revealed by genomic and methylomic sequencing. Proc Natl Acad Sci 111: E5302–E5311. 10.1073/pnas.1421126111 [DOI] [PMC free article] [PubMed] [Google Scholar]
- Chan KCA, Woo JKS, King A, Zee BCY, Lam WKJ, Chan SL, Chu SWI, Mak C, Tse IOL, Leung SYM, et al. 2017. Analysis of plasma Epstein-Barr virus DNA to screen for nasopharyngeal cancer. N Engl J Med 377: 513–522. 10.1056/NEJMoa1701717 [DOI] [PubMed] [Google Scholar]
- Chan RWY, Serpas L, Ni M, Volpi S, Hiraki LT, Tam L, Rashidfarrokhi A, Wong PCH, Tam LHP, Wang Y, et al. 2020. Plasma DNA profile associated with DNASE1L3 gene mutations: clinical observations, relationships to nuclease substrate preference, and in vivo correction. Am J Hum Genet 107: 882–894. 10.1016/j.ajhg.2020.09.006 [DOI] [PMC free article] [PubMed] [Google Scholar]
- Chandrananda D, Thorne NP, Bahlo M. 2015. High-resolution characterization of sequence signatures due to non-random cleavage of cell-free DNA. BMC Med Genomics 8: 29. 10.1186/s12920-015-0107-z [DOI] [PMC free article] [PubMed] [Google Scholar]
- Cheng THT, Lui KO, Peng XL, Cheng SH, Jiang P, Chan KCCA, Chiu RWKK, Lo YMMD. 2018. DNase1 does not appear to play a major role in the fragmentation of plasma DNA in a knockout mouse model. Clin Chem 64: 406–408. 10.1373/clinchem.2017.280446 [DOI] [PubMed] [Google Scholar]
- Chiu RWK, Poon LLM, Lau TK, Leung TN, Wong EMC, Lo YMD. 2001. Effects of blood-processing protocols on fetal and total DNA quantification in maternal plasma. Clin Chem 47: 1607–1613. 10.1093/clinchem/47.9.1607 [DOI] [PubMed] [Google Scholar]
- Chiu RWK, Chan KCA, Gao Y, Lau VYM, Zheng W, Leung TY, Foo CHF, Xie B, Tsui NBY, Lun FMF, et al. 2008. Noninvasive prenatal diagnosis of fetal chromosomal aneuploidy by massively parallel genomic sequencing of DNA in maternal plasma. Proc Natl Acad Sci 105: 20458–20463. 10.1073/pnas.0810641105 [DOI] [PMC free article] [PubMed] [Google Scholar]
- Corcoran RB, Chabner BA. 2018. Application of cell-free DNA analysis to cancer treatment. N Engl J Med 379: 1754–1765. 10.1056/NEJMra1706174 [DOI] [PubMed] [Google Scholar]
- Davis CA, Hitz BC, Sloan CA, Chan ET, Davidson JM, Gabdank I, Hilton JA, Jain K, Baymuradov UK, Narayanan AK, et al. 2018. The Encyclopedia of DNA Elements (ENCODE): data portal update. Nucleic Acids Res 46: D794–D801. 10.1093/nar/gkx1081 [DOI] [PMC free article] [PubMed] [Google Scholar]
- The ENCODE Project Consortium. 2012. An integrated encyclopedia of DNA elements in the human genome. Nature 489: 57–74. 10.1038/nature11247 [DOI] [PMC free article] [PubMed] [Google Scholar]
- Fu Y, Sinha M, Peterson CL, Weng Z. 2008. The insulator binding protein CTCF positions 20 nucleosomes around its binding sites across the human genome. PLoS Genet 4: e1000138. 10.1371/journal.pgen.1000138 [DOI] [PMC free article] [PubMed] [Google Scholar]
- Guo S, Diep D, Plongthongkum N, Fung HL, Zhang K, Zhang K. 2017. Identification of methylation haplotype blocks aids in deconvolution of heterogeneous tissue samples and tumor tissue-of-origin mapping from plasma DNA. Nat Genet 49: 635–642. 10.1038/ng.3805 [DOI] [PMC free article] [PubMed] [Google Scholar]
- Han DSC, Ni M, Chan RWY, Chan VWH, Lui KO, Chiu RWK, Lo YMD. 2020. The biology of cell-free DNA fragmentation and the roles of DNASE1, DNASE1L3, and DFFB. Am J Hum Genet 106: 202–214. 10.1016/j.ajhg.2020.01.008 [DOI] [PMC free article] [PubMed] [Google Scholar]
- Ivanov M, Baranova A, Butler T, Spellman P, Mileyko V. 2015. Non-random fragmentation patterns in circulating cell-free DNA reflect epigenetic regulation. BMC Genomics 16: S1. 10.1186/1471-2164-16-S13-S1 [DOI] [PMC free article] [PubMed] [Google Scholar]
- Jiang P, Sun X, Chen EZ, Sun K, Chiu RWK, Lo YMD, Sun H. 2010. Methy-Pipe: an integrated bioinformatics data analysis pipeline for whole genome methylome analysis. PLoS One 9: e100360. 10.1371/journal.pone.0100360 [DOI] [PMC free article] [PubMed] [Google Scholar]
- Jiang P, Sun K, Peng W, Cheng SH, Ni M, Yeung PC, Heung MMS, Xie T, Shang H, Zhou Z, et al. 2020. Plasma DNA end-motif profiling as a fragmentomic marker in cancer, pregnancy, and transplantation. Cancer Discov 10: 664–673. 10.1158/2159-8290.CD-19-0622 [DOI] [PubMed] [Google Scholar]
- Kang S, Li Q, Chen Q, Zhou Y, Park S, Lee G, Grimes B, Krysan K, Yu M, Wang W, et al. 2017. CancerLocator: non-invasive cancer diagnosis and tissue-of-origin prediction using methylation profiles of cell-free DNA. Genome Biol 18: 53. 10.1186/s13059-017-1191-5 [DOI] [PMC free article] [PubMed] [Google Scholar]
- Kelly TK, Liu Y, Lay FD, Liang G, Berman BP, Jones PA. 2012. Genome-wide mapping of nucleosome positioning and DNA methylation within individual DNA molecules. Genome Res 22: 2497–2506. 10.1101/gr.143008.112 [DOI] [PMC free article] [PubMed] [Google Scholar]
- Krueger F, Andrews SR. 2011. Bismark: a flexible aligner and methylation caller for Bisulfite-Seq applications. Bioinformatics 27: 1571–1572. 10.1093/bioinformatics/btr167 [DOI] [PMC free article] [PubMed] [Google Scholar]
- Krzywinski M, Schein J, Birol I, Connors J, Gascoyne R, Horsman D, Jones SJ, Marra MA. 2009. Circos: an information aesthetic for comparative genomics. Genome Res 19: 1639–1645. 10.1101/gr.092759.109 [DOI] [PMC free article] [PubMed] [Google Scholar]
- Leontiou CA, Hadjidaniel MD, Mina P, Antoniou P, Ioannides M, Patsalis PC. 2015. Bisulfite conversion of DNA: performance comparison of different kits and methylation quantitation of epigenetic biomarkers that have the potential to be used in non-invasive prenatal testing. PLoS One 10: e0135058. 10.1371/journal.pone.0135058 [DOI] [PMC free article] [PubMed] [Google Scholar]
- Liu L, Toung JM, Jassowicz AF, Vijayaraghavan R, Kang H, Zhang R, Kruglyak KM, Huang HJ, Hinoue T, Shen H, et al. 2018. Targeted methylation sequencing of plasma cell-free DNA for cancer detection and classification. Ann Oncol 29: 1445–1453. 10.1093/annonc/mdy119 [DOI] [PMC free article] [PubMed] [Google Scholar]
- Lo YMD, Han DSC, Jiang P, Chiu RWK. 2021. Epigenetics, fragmentomics, and topology of cell-free DNA in liquid biopsies. Science 372: eaaw3616. 10.1126/science.aaw3616 [DOI] [PubMed] [Google Scholar]
- Lun FMF, Chiu RWK, Sun K, Leung TY, Jiang P, Chan KCA, Sun H, Lo YMD. 2013. Noninvasive prenatal methylomic analysis by genomewide bisulfite sequencing of maternal plasma DNA. Clin Chem 59: 1583–1594. 10.1373/clinchem.2013.212274 [DOI] [PubMed] [Google Scholar]
- Moss J, Magenheim J, Neiman D, Zemmour H, Loyfer N, Korach A, Samet Y, Maoz M, Druid H, Arner P, et al. 2018. Comprehensive human cell-type methylation atlas reveals origins of circulating cell-free DNA in health and disease. Nat Commun 9: 5068. 10.1038/s41467-018-07466-6 [DOI] [PMC free article] [PubMed] [Google Scholar]
- Mouliere F, Chandrananda D, Piskorz AM, Moore EK, Morris J, Barlebo Ahlborn L, Mair R, Goranova T, Marass F, Heider K, et al. 2018. Enhanced detection of circulating tumor DNA by fragment size analysis. Sci Transl Med 10: eaat4921. 10.1126/scitranslmed.aat4921 [DOI] [PMC free article] [PubMed] [Google Scholar]
- Napirei M, Karsunky H, Zevnik B, Stephan H, Mannherz HG, Möröy T. 2000. Features of systemic lupus erythematosus in Dnase1-deficient mice. Nat Genet 25: 177–181. 10.1038/76032 [DOI] [PubMed] [Google Scholar]
- Napirei M, Ludwig S, Mezrhab J, Klöckl T, Mannherz HG. 2009. Murine serum nucleases – contrasting effects of plasmin and heparin on the activities of DNase1 and DNase1-like 3 (DNase1l3). FEBS J 276: 1059–1073. 10.1111/j.1742-4658.2008.06849.x [DOI] [PubMed] [Google Scholar]
- Özçakar ZB, Foster J 2nd, Diaz-Horta O, Kasapcopur O, Fan YS, Yalçınkaya F, Tekin M. 2013. DNASE1L3 mutations in hypocomplementemic urticarial vasculitis syndrome. Arthritis Rheum 65: 2183–2189. 10.1002/art.38010 [DOI] [PubMed] [Google Scholar]
- Quinlan AR, Hall IM. 2010. BEDTools: a flexible suite of utilities for comparing genomic features. Bioinformatics 26: 841–842. 10.1093/bioinformatics/btq033 [DOI] [PMC free article] [PubMed] [Google Scholar]
- R Core Team. 2018. R: a language and environment for statistical computing. R Foundation for Statistical Computing, Vienna. https://www.R-project.org/. [Google Scholar]
- Roadmap Epigenomics Consortium, Kundaje A, Meuleman W, Ernst J, Bilenky M, Yen A, Heravi-Moussavi A, Kheradpour P, Zhang Z, Wang J, et al. 2015. Integrative analysis of 111 reference human epigenomes. Nature 518: 317–330. 10.1038/nature14248 [DOI] [PMC free article] [PubMed] [Google Scholar]
- Serpas L, Chan RWY, Jiang P, Ni M, Sun K, Rashidfarrokhi A, Soni C, Sisirak V, Lee W-S, Cheng SH, et al. 2019. Dnase1l3 deletion causes aberrations in length and end-motif frequencies in plasma DNA. Proc Natl Acad Sci 116: 641–649. 10.1073/pnas.1815031116 [DOI] [PMC free article] [PubMed] [Google Scholar]
- Shen Y, Yue F, McCleary DF, Ye Z, Edsall L, Kuan S, Wagner U, Dixon J, Lee L, Lobanenkov VV, et al. 2012. A map of the cis-regulatory sequences in the mouse genome. Nature 488: 116–120. 10.1038/nature11243 [DOI] [PMC free article] [PubMed] [Google Scholar]
- Sisirak V, Sally B, D'Agati V, Martinez-Ortiz W, Özçakar ZB, David J, Rashidfarrokhi A, Yeste A, Panea C, Chida AS, et al. 2016. Digestion of chromatin in apoptotic cell microparticles prevents autoimmunity. Cell 166: 88–101. 10.1016/j.cell.2016.05.034 [DOI] [PMC free article] [PubMed] [Google Scholar]
- Snyder MW, Kircher M, Hill AJ, Daza RM, Shendure J. 2016. Cell-free DNA comprises an in vivo nucleosome footprint that informs its tissues-of-origin. Cell 164: 57–68. 10.1016/j.cell.2015.11.050 [DOI] [PMC free article] [PubMed] [Google Scholar]
- Sun K, Jiang P, Chan KCA, Wong J, Cheng YKY, Liang RHS, Chan W, Ma ESK, Chan SL, Cheng SH, et al. 2015. Plasma DNA tissue mapping by genome-wide methylation sequencing for noninvasive prenatal, cancer, and transplantation assessments. Proc Natl Acad Sci 112: E5503–E5512. 10.1073/pnas.1508736112 [DOI] [PMC free article] [PubMed] [Google Scholar]
- Sun K, Jiang P, Cheng SH, Cheng THT, Wong J, Wong VWS, Ng SSM, Ma BBY, Leung TY, Chan SL, et al. 2019. Orientation-aware plasma cell-free DNA fragmentation analysis in open chromatin regions informs tissue of origin. Genome Res 29: 418–427. 10.1101/gr.242719.118 [DOI] [PMC free article] [PubMed] [Google Scholar]
- Wan JCM, Massie C, Garcia-Corbacho J, Mouliere F, Brenton JD, Caldas C, Pacey S, Baird R, Rosenfeld N. 2017. Liquid biopsies come of age: towards implementation of circulating tumour DNA. Nat Rev Cancer 17: 223–238. 10.1038/nrc.2017.7 [DOI] [PubMed] [Google Scholar]
Associated Data
This section collects any data citations, data availability statements, or supplementary materials included in this article.