Abstract
Success of the accountable care organization model may require stronger financial incentives, potentially by including downside financial risk in contracts. Using the National Survey of ACOs, we explored changes in ACO structure and contracts over time. Though the number of ACO contracts and proportion with multiple contracts has grown, the proportion of ACOs bearing downside risk increased only modestly.
Accountable care organizations (ACOs) have emerged as one of the most broadly implemented value-based payment models by both public and private payers. With incentives to improve the quality of care and reduce health care spending, the ACO model has grown to include 1,011 ACOs in 2018, covering an estimated 32.7 million lives and representing 1,477 different public and commercial payment arrangements.(1) While the Centers for Medicare and Medicaid Services (CMS) has introduced new ACO programs, debates continue around the impact of the ACO model, including the contribution of downside risk, where ACOs that fail to meet their financial targets share responsibility with payers for losses.(2)
We used data from the National Survey of Accountable Care Organizations, administered four times from 2012 – 2018 to analyze the evolution of ACOs. Twenty eight percent of ACOs formed in 2012 initially had a contract with downside risk (Exhibit 1). The proportion of ACOs taking on downside risk at the time they formed has varied over time, in part based on Medicare program initiation (e.g. Pioneer and Next Generation ACO programs could only be joined in 2012 and 2016 respectively). In 2018, 33% of ACOs report having at least one contract with downside risk. Though the increase in the proportion of ACOs with a downside risk contract is modest, the number of ACOs has grown roughly fivefold since 2012 (1), potentially indicating that the number of ACO downside risk contracts has also grown substantially.
Exhibit 1. Percentage of ACOs with Risk-bearing Payment Contracts.
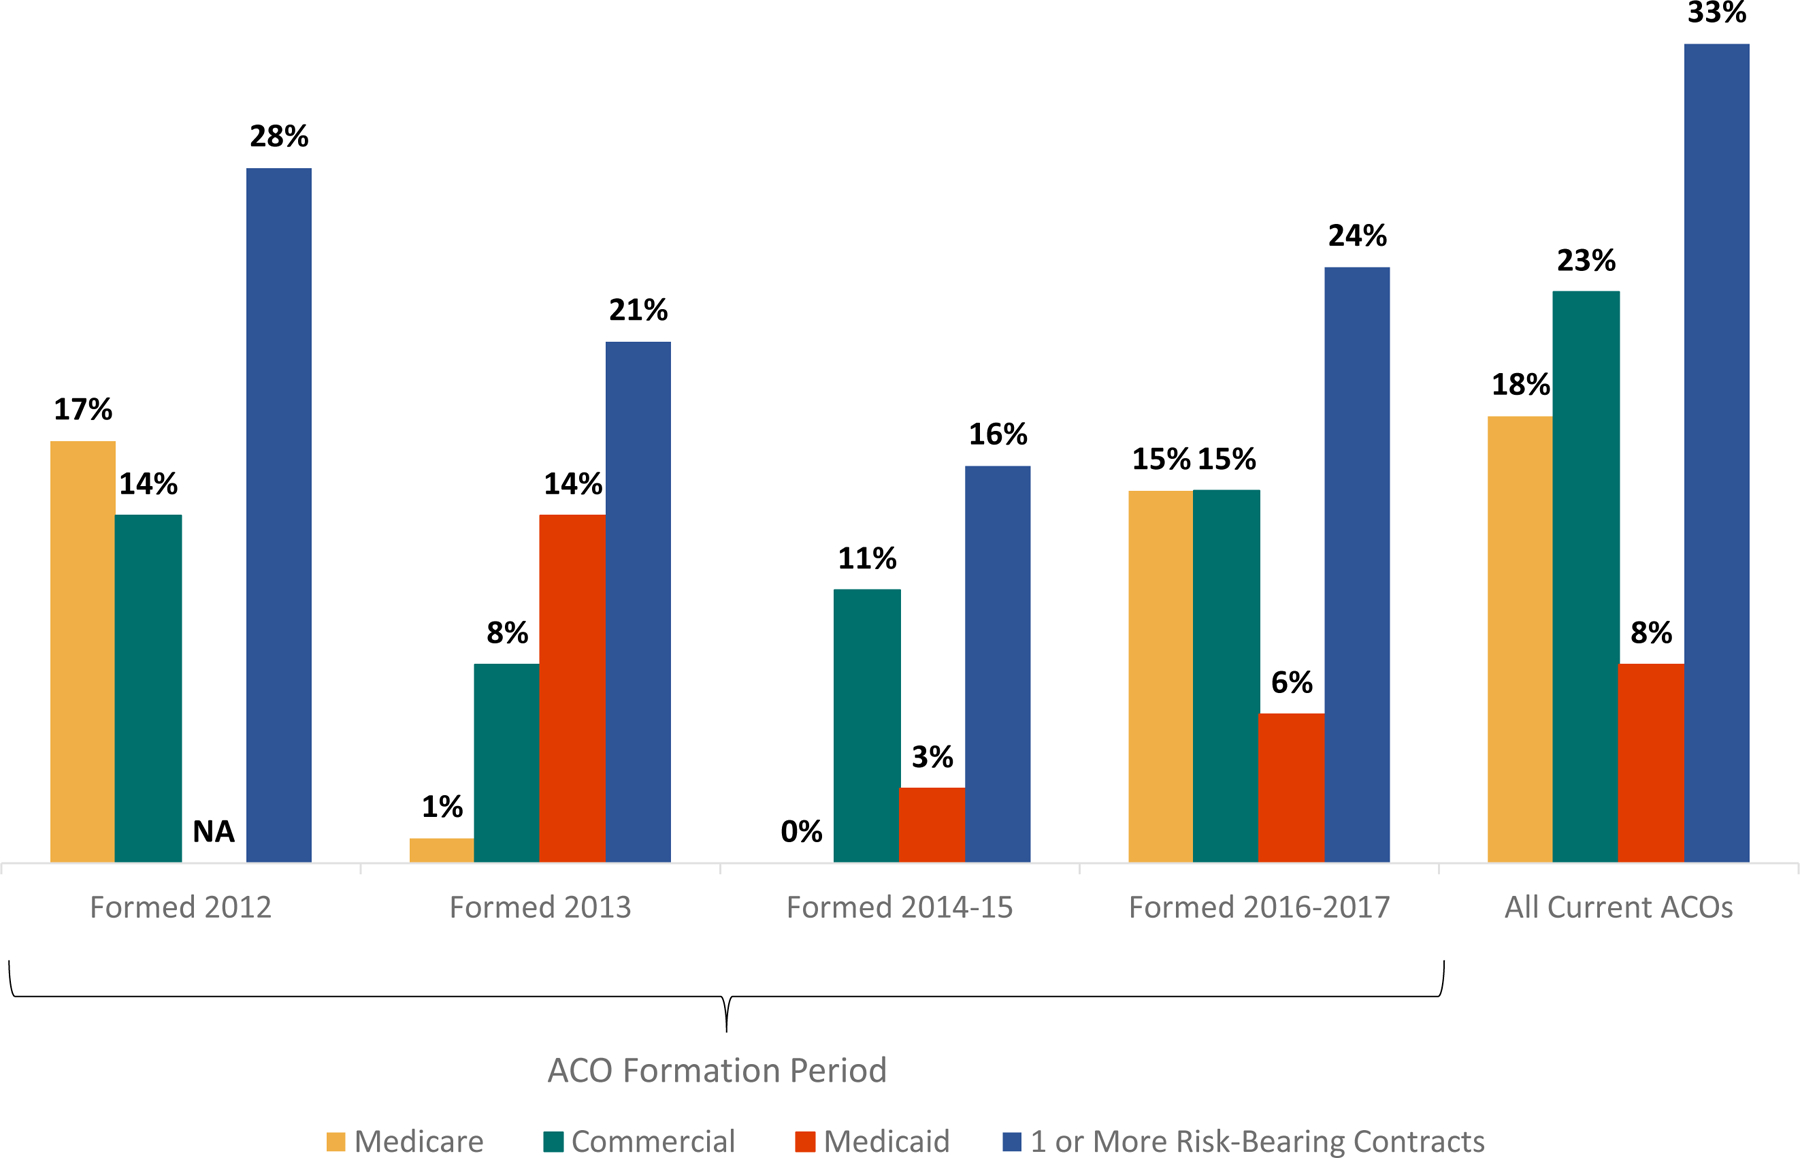
Source/Notes: SOURCE Authors’ analysis of data from National Survey of Accountable Care Organizations (Waves 1–4, October 2012–February 2018).
NOTES: Responses reflect status at time of ACO formation. Additional information on the dates of ACO formation and survey fielding periods is in the Appendix (see Note 3 in the text). Medicaid contract type was not asked about in the 2012 survey. Medicaid contract type includes both managed Medicaid and traditional Medicaid contracts.
Study Data and Methods
To improve our understanding of the rapidly growing number of ACOs, we fielded the National Survey of ACOs to all known ACOs in 2012. We fielded Waves 2 and 3 to newly formed ACOs in 2013 and 2014–15, respectively. In 2017–18 (which we term the 2018 survey), we fielded a fourth wave to all existing ACOs to examine how the structure, contracts, and capabilities of ACOs have changed between early participants and recent adopters of the ACO model.
Our 2018 survey sample includes an estimated 862 ACOs with available contact data as of July 2017. Fifty-five percent of the sample returned a survey, and we analyzed 419 complete surveys (adjusted response rate 48%). Six ACOs did not provide complete information on risk-bearing status, resulting in 413 valid responses (see the online Appendix for further details on survey implementation).(3) For Waves 1–3 of the survey, adjusted response rates were 70%, 59%, and 61% respectively. Additional information on earlier waves of the survey has been previously published.(4, 5)
We identified our sample through multiple sources including CMS data, internet data collection, and information from Leavitt Partners. Respondents typically have leadership roles in the ACO, such as ACO executive director, CEO, medical director, or chief operating officer.
Limitations
There is no official source of commercial ACO contract data; ACOs without Medicare contracts are difficult to identify and contact because of this lack of information. Our results may underrepresent ACOs with solely commercial contracts. As a result, the survey response rates differ by payer, with Medicare ACOs at a significantly higher response rate than non-Medicare ACOs; however, non-response analysis indicated no significant difference by presence of a contract with downside risk. While we are able to determine the presence of downside risk, we do not know the extent of this risk (many ACO contracts either have provisions limiting downside risk, or the ACO contract(s) only include a portion of the health system/organization’s clinicians).
Study Results
While the proportion of ACOs taking on downside risk has remained relatively stable over time (28 percent in 2012 compared to 33 percent in 2018, Exhibit 1), ACOs taking on downside risk differ in structure and contractual relationships from non-risk bearing ACOs.
Leadership, Services and Participating Physicians
We examine the structure of ACOs from several perspectives: the nature of their leadership and ownership, services offered, and size of the ACO. Among all ACOs responding to the 2018 survey, those bearing downside risk differ in their leadership structure; they are less likely to be physician-led than ACOs without downside risk (43% vs. 57%), and more likely to be jointly led by a hospital and physicians, hospital-led, or led through some other arrangement (including coalitions and regional, county, or state organizations) (Exhibit 2).
Exhibit 2. ACO Leadership Characteristics by Financial Risk Acceptance, 2017–18.
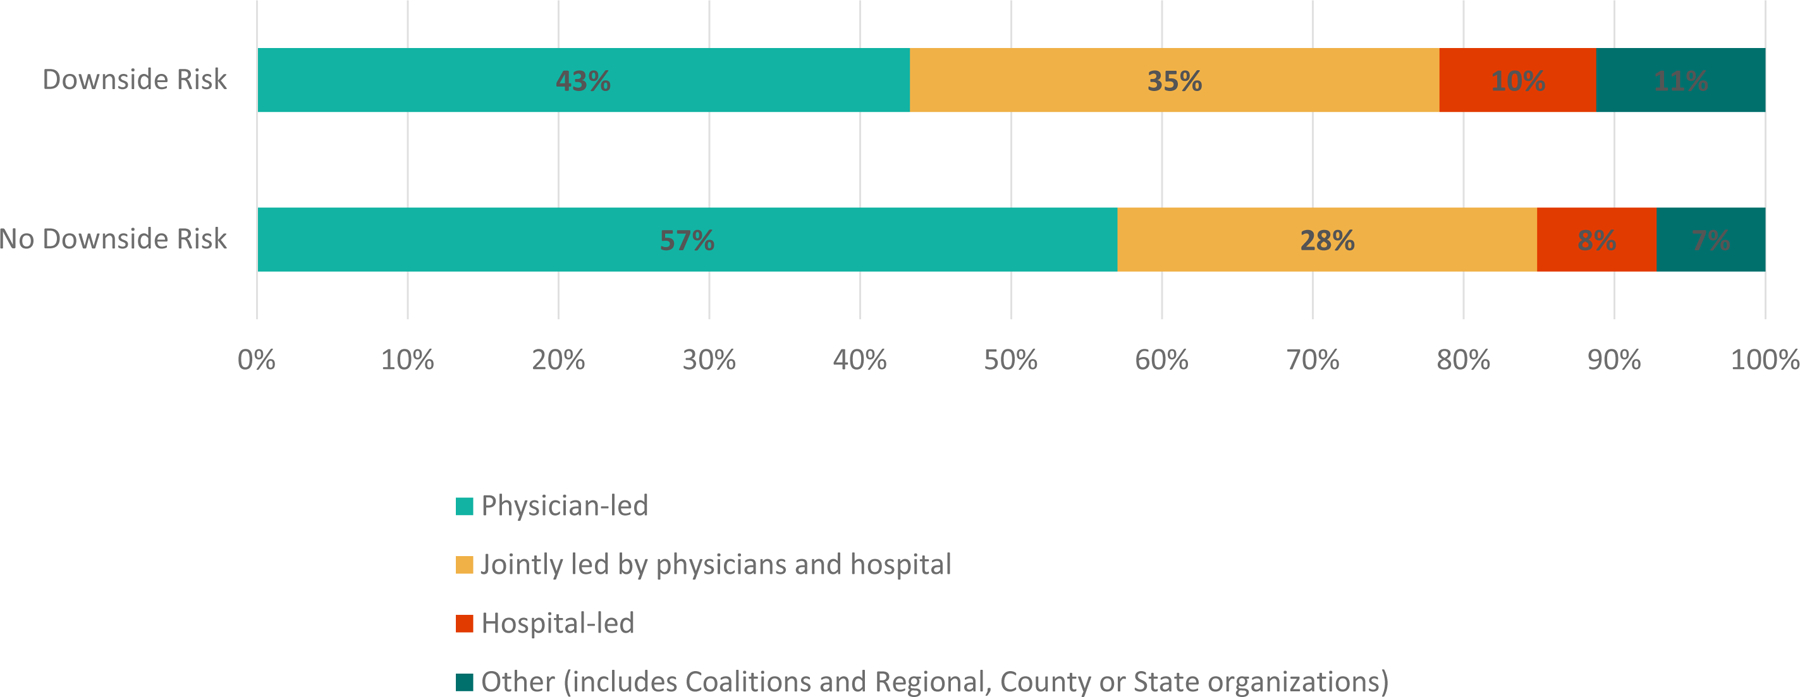
Source/Notes: SOURCE Authors’ analysis of data from National Survey of Accountable Care Organizations (Wave 4, fielded 2017–18).
NOTES: “Downside risk” indicates presence of an ACO contract where ACOs that fail to meet their financial targets share responsibility for losses with payers. “No downside risk” does not include this responsibility for losses if financial targets are not met.[INSERT]
ACOs with downside risk in 2018 are less likely to be physician-owned than ACOs without downside risk (30% vs. 39%) (Appendix Exhibit A1).(3) While similar in proportion of ownership by hospitals, downside risk ACOs are more likely to be owned by other entities, including public ownership, non-profit ownership, or another privately owned for-profit entity.
ACOs with downside risk are more likely to be an integrated delivery system (58%) than ACOs without downside risk (42%, Exhibit 3). Downside risk ACOs are also more likely to include a hospital and have a greater number of hospitals.
Exhibit 3:
Participating ACO Facilities, Services, Physicians and Patients by Financial Risk Acceptance, 2017–18
| Downside Risk | |||
|---|---|---|---|
| Yes (N=135) |
No (N=278) |
All (N=413a) |
|
| Participating Providers | |||
| Integrated Delivery System | 58% | 42% | 47% |
| Hospital (any) | 76% | 54% | 61% |
| Number of hospitals if any (mean) | 6.4 | 4.3 | 5.1 |
| Includes Critical Access Hospital | 30% | 20% | 23% |
| Includes Public Hosp | 13% | 11% | 12% |
| Federally Qualified Health Center | 24% | 27% | 26% |
| Nursing Facility | 38% | 15% | 22% |
| Behavioral health provider group b | 39% | 18% | 25% |
| ACO Provides or Contracts for the Following Services | |||
| Inpatient Rehabilitation | 59% | 39% | 46% |
| Routine Specialty Care | 77% | 59% | 65% |
| Palliative/hospice care | 65% | 42% | 50% |
| Home health/visiting nurse | 68% | 44% | 52% |
| Skilled Nursing Facility | 67% | 39% | 48% |
| Participating Physicians & Patients | |||
| Total Participating Physicians (mean) | 1210 | 441 | 698 |
| Primary Care Physician (mean) | 400 | 192 | 260 |
| Specialist (mean) | 805 | 257 | 440 |
| 50–100% of Primary Care Patients Covered by ACO Contract (%) | 34% | 24% | 27% |
Source/Notes: SOURCE Authors’ analysis of data from National Survey of Accountable Care Organizations (Wave 4, fielded 2017–18).
NOTES
Six ACOs did not provide complete information on risk-bearing status.
Wave 4 respondents are considered to have a behavioral health provider group if they indicate that they had a behavioral health provider group OR addiction treatment facility OR community mental health center.
ACOs taking on downside risk are more likely than other ACOs to directly provide or contract to deliver inpatient rehabilitation, routine specialty care, palliative/hospice care, home health/visiting nurse, and skilled nursing facility care.
Downside risk ACOs are larger than ACOs without downside risk in terms of number of participating physicians (mean: 1,210 vs. 441). Additionally, ACOs with downside risk are slightly more likely to report 50–100% of their primary care patients are covered by an ACO contract.
ACO Contracts and Prior Experience with Payment Reform
Overall, there has been a substantial increase in the number and variety of contracts held by ACOs. Over time, the proportion of ACOs with contracts from multiple (two or more) payers (such as Medicare, commercial, or Medicaid) increased from 42% for ACOs formed in 2012 to 57% for ACOs formed in 2016–17 (Exhibit 4). Among all ACOs responding to the 2018 survey, 63% have an ACO contract with multiple payers.
Exhibit 4. ACO Contract Types Over Time.
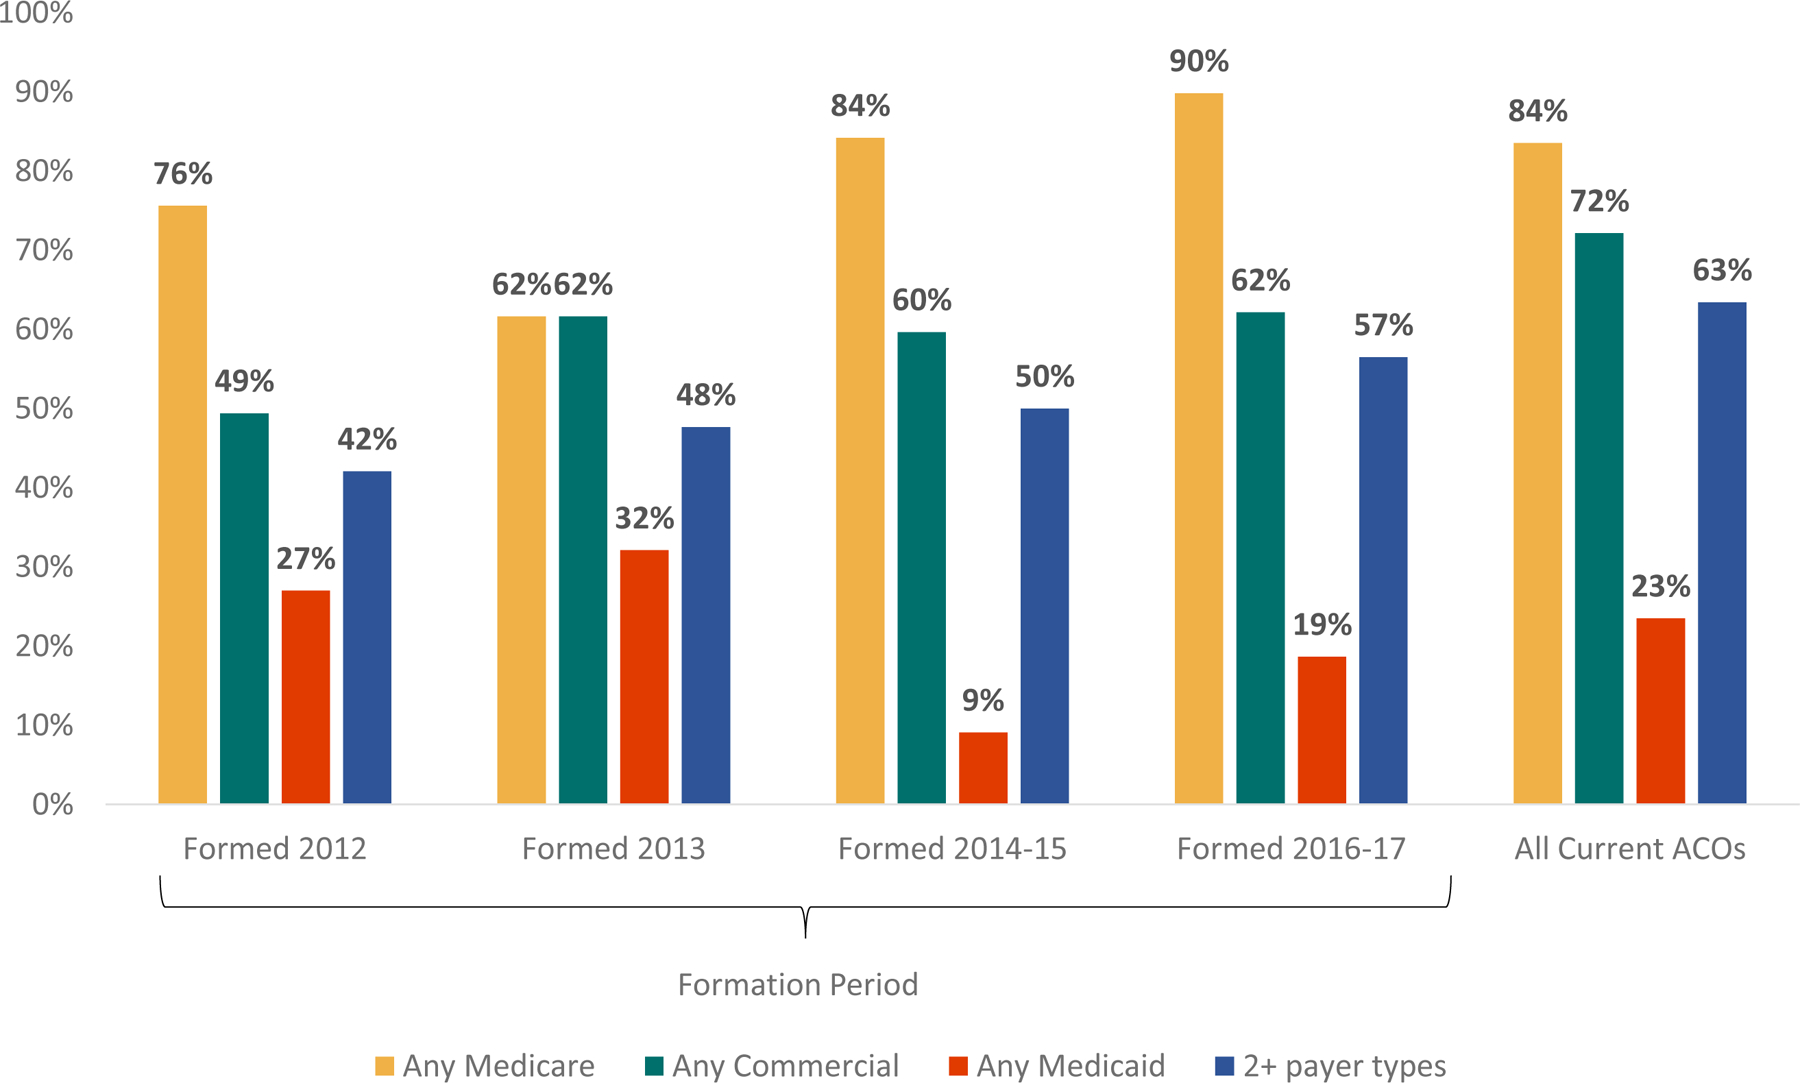
Source/Notes: SOURCE Authors’ analysis of data from National Survey of ACOs (Waves 1–4). NOTES Responses reflect status at time of ACO formation. Additional information on the dates of ACO formation and survey fielding periods is in the online Appendix (see Note 3 in the text). Questions about Medicaid contracts were not asked in the 2012 survey. Medicaid contract type includes both managed Medicaid and traditional Medicaid contracts.
In 2018, 84% of ACOs have Medicare contracts, 72% have commercial contracts, and 23% have Medicaid contracts. Among the potential combinations of these contractual arrangements, the most common was to have both a commercial and a Medicare contract (42% for both risk bearing and non-risk bearing ACOs, Exhibit 5). However, ACOs with downside risk contracts were less likely to have only a Medicare contract, and more likely to have contracts with all three types of payers. Of ACOs with a downside risk contract, 81% have multiple contracts, compared to 55% of ACOs without downside risk).
Exhibit 5. ACO Contract Types by Financial Risk Acceptance, 2017–18.
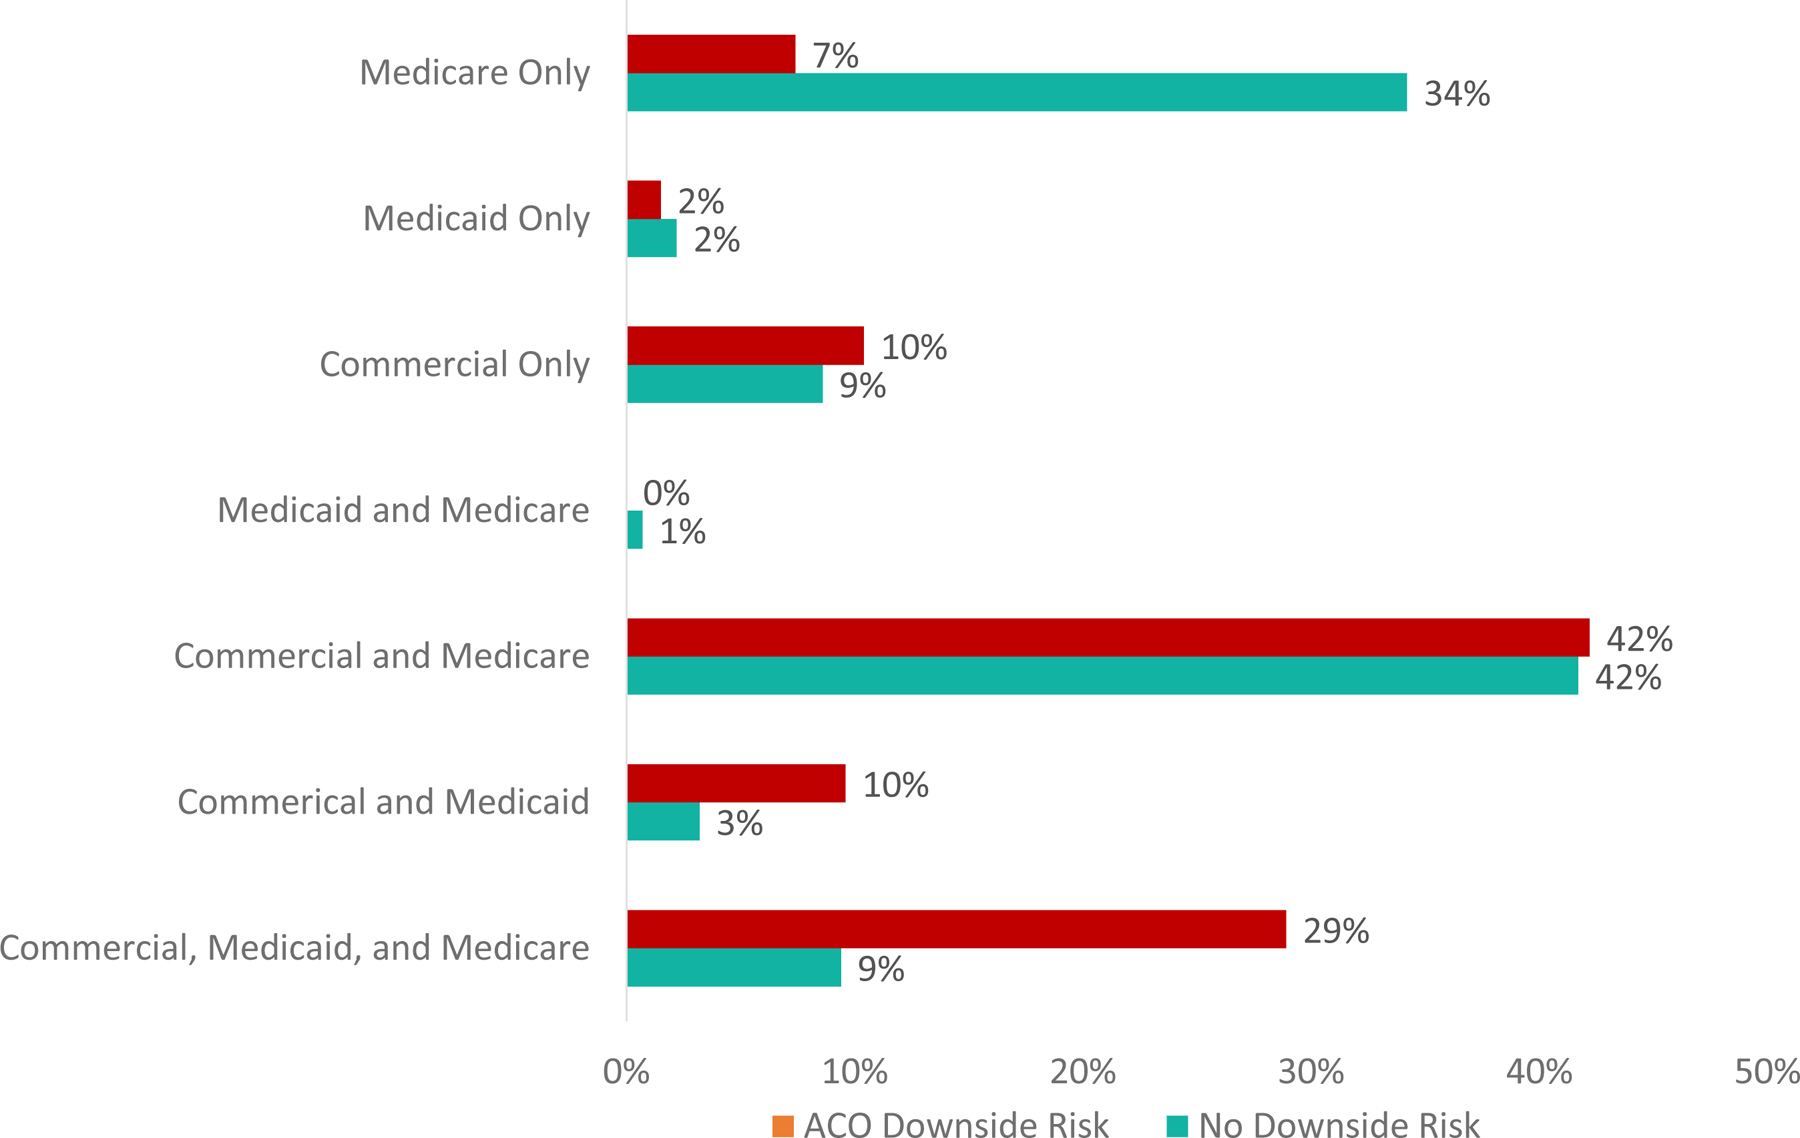
Source/Notes: SOURCE Authors’ analysis of data from National Survey of Accountable Care Organizations (Wave 4, fielded 2017–18).
NOTES aMedicaid contract type includes both managed Medicaid and traditional Medicaid contracts.
ACOs and their participating providers have varied levels of experience with other types of payment reform. ACOs with downside risk contracts in 2018 are more likely to have participating providers with experience in bundled or episode-based payments, Medicare Advantage, capitated commercial plans, and other risk-bearing contracts (Exhibit 6).
Exhibit 6. ACO and Participating Providers’ Previous Experience with Payment Reform by 2018 ACO Downside Risk.
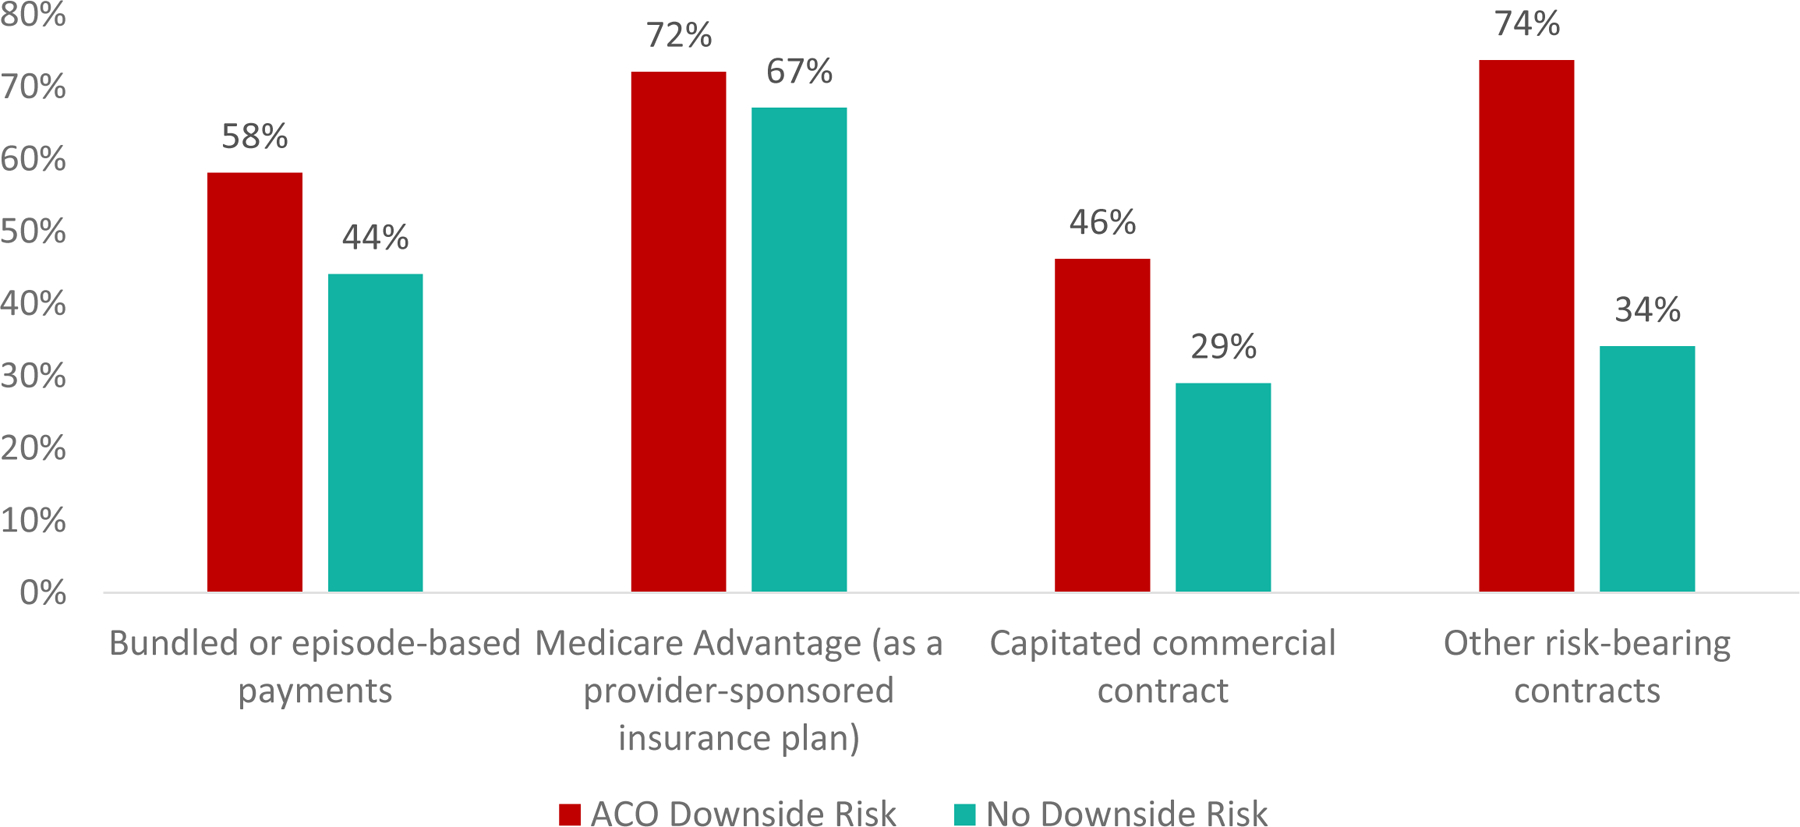
Source/Notes: SOURCE Authors’ analysis of data from National Survey of ACOs (Wave 4). NOTES *Survey question text: Has your ACO or any of its participating providers previously joined any of the following payment reform efforts? (Participating providers are those to whom patients are attributed in the ACO.)
Discussion
As the ACO model matures, many policymakers believe it imperative to strengthen the incentives to improve performance, which can occur by increasing the breadth and the depth of the financial incentives they face. The breadth of contract incentives (whether and how payment contracts align incentives across payers) and the depth of incentives (use of downside risk, whether or not there are caps on risk) both potentially influence organizational decision making and therefore quality and spending outcomes.(6) As of 2018, the proportion of ACOs with multiple types of contracts has grown, but only one-third of ACOs have an ACO payment contract with downside risk. Compared to ACOs without downside risk, ACOs with downside risk are bigger, more likely to be vertically and horizontally integrated, and are more likely to be exposed to other types of payment reform and have more ACO contracts across payer types (Medicare, Medicaid, commercial).
There is general agreement within the research community that the incentives in the Medicare Shared Savings Program Track 1 (which encompasses 82% of Medicare ACOs in 2018) (7) are relatively weak.(8) Track 1 is an upside-only risk contract which rewards cost and quality improvement but does not penalize poor performance. Such upside-only risk contracts may not provide adequate incentive for ACOs to invest in care transformation efforts and could encourage underperforming ACOs to remain in ACO programs without generating savings (in order to take advantage of additional regulatory flexibilities afforded to ACOs).(8) Conversely, a transition to downside risk could either encourage rapid care innovation, or force ACOs to reevaluate their participation if pushed to bear downside risk before they feel prepared.(9)
Medicare administrators have pushed for increased risk in ACO contracts on the basis that ACOs with downside risk have achieved greater savings than those without downside risk.(10) Supporting analyses, however, do not account for differences between the organizations participating in shared downside risk contracts versus upside-only contracts.(10) Our results show that those bearing downside risk in ACO contracts also have more past experience in other forms of risk-bearing contracts. Prior work indicates that ACO participants with risk-bearing experience are more likely to share savings with the Medicare program.(11) Therefore, the assumption that inducing more ACOs to bear downside risk will result in increased savings should be questioned based on what we know to date. Through the development of the “Pathways to Success” program, CMS has indicated that it plans to more quickly require Medicare ACOs to shift from upside-only to downside risk arrangements. (12) After implementation of the Pathways to Success program, most Medicare ACOs chose to remain in the program; however, smaller physician-led ACOs dropped out at a higher rate than large physician-led or hospital-led ACOs.(13) While there may be value in decreasing the period of time for which ACOs have upside-only contracts,(14) there is also a need to balance participation and readiness to take on downside risk; many of the ACOs without downside risk only have a contract with Medicare and are “dipping their toe” in the ACO waters.(15)
Analogously, we observe a subset of ACOs that have moved more quickly to the use of risk-based contracting by initiating other types of value-based contracts (e.g. episode payments) and ACO contracts across payers. The organizations prepared to make this transition are larger and more diverse, likely aligning with the “high” revenue track within the “Pathways to Success” program.
Conclusion
Participation in other alternative payment models and the increasing number of ACO payment contracts per ACO speak to an increase in the breadth of value-based financial incentives.(6) However, there has been relative stagnation in the proportion of ACOs with deeper financial incentives – only a third of 2018 ACOs chose contracts with downside risk. Understanding the importance of downside risk in increasing the impact of the ACO model, the hesitancy of ACOs, and the levers possible to strengthen both the breadth and depth of incentives while maintaining participation in the voluntary program are key to moving the ACO model forward.
Supplementary Material
References
- 1.Muhlestein D, Saunders R, Richards R, McClellan M. Health Affairs Blog [Internet]2018 August 14, 2018.
- 2.Chernew ME, Barbey C, McWilliams JM. Health Affairs Blog [Internet]2017 June 19, 2017.
- 3.To access the Appendix, click on the Details tab of the article online.
- 4.Albright BB, Lewis VA, Ross JS, Colla CH. Preventive Care Quality of Medicare Accountable Care Organizations: Associations of Organizational Characteristics With Performance. Medical care. 2016;54(3):326–35. [DOI] [PMC free article] [PubMed] [Google Scholar]
- 5.Colla CH, Lewis VA, Shortell SM, Fisher ES. First national survey of ACOs finds that physicians are playing strong leadership and ownership roles. Health affairs (Project Hope). 2014;33(6):964–71. [DOI] [PubMed] [Google Scholar]
- 6.Lewis VA, Fisher ES, Colla CH. Explaining Sluggish Savings under Accountable Care. New England Journal of Medicine. 2017;377(19):1809–11. [DOI] [PMC free article] [PubMed] [Google Scholar]
- 7.Centers for Medicare and Medicaid Services. Medicare Shared Savings Program Fast Facts 2018 [Available from: https://www.cms.gov/Medicare/Medicare-Fee-for-Service-Payment/sharedsavingsprogram/Downloads/SSP-2018-Fast-Facts.pdf.
- 8.Douven R, McGuire TG, McWilliams JM. Avoiding unintended incentives in ACO payment models. Health affairs (Project Hope). 2015;34(1):143–9. [DOI] [PubMed] [Google Scholar]
- 9.McWilliams JM, Chernew ME, Landon BE. Comment to Proposed Rule CMS-1701-P: Medicare Program; Medicare Shared Savings Program; Accountable Care Organizations—Pathways to Success 2018. [Available from: https://hmrlab.hcp.med.harvard.edu/files/hmrtest2/files/september_18_2018_comment_letter_re_cms-1701-p_medicare_program_mssp.pdf.
- 10.Verma S Health Affairs Blog [Internet]2018 August 9, 2018.
- 11.Ouayogode MH, Colla CH, Lewis VA. Determinants of success in Shared Savings Programs: An analysis of ACO and market characteristics. Healthcare (Amsterdam, Netherlands). 2016. [DOI] [PMC free article] [PubMed]
- 12.Medicare Program; Medicare Shared Savings Program; Accountable Care Organziations–Pathways to Success and Extreme and Uncontrollable Circumstances Policies for Performance Year for 2017, 42 CFR Part 425 (2018). [PubMed]
- 13.Bleser W, Saunders R, Muhlestein D, Olson A, Richards R, Taylor DH, et al. Following Medicare’s ACO Program Overhaul, Most ACOs Stay – But Physician-Led ACOs Leave At A Higher Rate: Health Affairs Blog; 2019.
- 14.Kocot SL, White R. Health Affairs Blog [Internet]2018 July 17, 2018.
- 15.Muhlestein D, McClellan M. Health Affairs Blog [Internet]2016 April 21, 2016.
Associated Data
This section collects any data citations, data availability statements, or supplementary materials included in this article.


