

Abstract
Multiplexed tissue tomography enables comprehensive spatial analysis of markers within a whole tissue or thick tissue section. Clearing agents are often used to make tissue transparent and facilitate deep tissue imaging. Many methods of clearing and tissue tomography are currently used in a variety of tissue types. Here we detail a workflow known as Transparent Tissue Tomography (T3), which builds upon previous methods and can be applied to difficult to clear tissues such as tumors.
Keywords: Tomography, Microscopy, Tissue Clearing, Multiplex Imaging, Immunofluorescence, Antibody
1. INTRODUCTION
Three-dimensional imaging or tomography is desirable in many tissue samples. Samples with structures that have complex geometry, such as tumor microvasculature, have cellular markers with distribution patterns that will vary with depth. Unfortunately, there are limits in the depth that laser light excitation and fluorescence emission propagate in tissue. Absorption and scattering of light do not allow for deep tissue imaging without some prior treatment to the tissue to make it less opaque. For this reason, tissue tomography has remained difficult or unfeasible for many biological imaging applications.
Tissue clearing is the replacement of the aqueous medium within cells with a solution that better matches the refractive index of the tissue. Cleared tissue with a surrounding medium of a similar refractive index has higher transparency and less refraction and reflection of light at the surface [1]. Over the past century, several innovative methods have been tested for clearing different types of tissues. Easy to clear tissues, such as brain and heart, are the most common tissue types, while tissues with abundant extracellular matrix, such as tumors, have proven to be difficult [1]. In 2013, Chung et al. pioneered a method involving lipid extraction (CLARITY), which provides exceptionally detailed tomographic data of neural connections within intact or non-sectioned brains [2]. This approach however requires about a week for sample preparation and relies upon special embedding and clearing materials (Table 1) as well as electrophoresis equipment. Conventionally, the two main approaches to clearing are with a solvent or an aqueous medium (Table 1), each of which presents potential drawbacks. Using a solvent means that the tissue needs to be dehydrated first. Unfortunately, tissue shrinkage [3,4] and possibly fluorescence quenching will occur through this process. Clearing with aqueous medium is thought to be much slower and make imaging difficult, but several advances have been made recently.
Table 1:
Currently used methods for tissue tomography
| METHOD | TISSUE TESTED | MATERIALS NEEDED | MULTIPLEX CAPABILITY | IMAGING TESTED | IMMUNE MARKERS | DURATION | REFS |
|---|---|---|---|---|---|---|---|
| CLARITY | Brainm,h; Breast tumorm,h; Breasth; Prostateh | Hydrogel solution with acrylamide and PFA; SDS | Yes | Confocal Open-top light-sheet | CD3 | ≥8 days | 2, 8–11 |
| 3DISCO | Mammary glandm; LNm; Spleenm; Lung tumorm | PFA; Clearing solutions with THF, DCM and DBE | Yes | Wide-field fluorescence Confocal Two-photon | MHCII; D11c; CX3CR1 | Few hours (small tissues) or ≥1 day (large tissues) | 3 |
| iDISCO / DIPCO | Bladder cancerm; FFPE tumor samplesh | Methanol; Clearing solutions with THF, (DCM), and DBE | Not tested | LSFM | LYVE-1 | >10days | 4,12, 13 |
| C e 3D | LNm; Musclem; Bonem | PFA; Clearing solution of N-methylacetamide with Histodenz™, Triton X-100 and 1-thioglycerol | Yes | Confocal Two-photon | B220; CD3; CD4; CD8; CD11c; CD25; CD44; CD169; LYVE-1 | ≥7 days | 14,15 |
| CUBIC | Various tumorsm; Whole body metastasesm | PFA; Clearing solutions with N-butyldiethanol-amine, Triton X-100, nicotinamide, and antipyrine | Not tested | Confocal; LSFM | Not tested | >3 days | 16 |
| Lung tumorm | PFA; Clearing solutions with quadrol, urea and sucrose | Confocal | Not tested | 3 days | 17,18 | ||
| Various organsh; LNh | Confocal; LSFM | Not tested | >3 days | 18,19 | |||
| SeeDB | Embryom; Brainm; Breast tumorm; Head and neck core needle biopsyh | PFA; Clearing solutions with fructose | Yes | Confocal Two-photon | CD3; CD4; CD8; CD45 | 3 days | 5–7, 20,21 |
| FUnGI | Breast tumorm,h | PFA; Clearing solution with fructose, urea and glycerol | Yes | Confocal Multiphoton | Not tested | 3 days | 22 |
| Scale derivative | Glioblastomam | PFA; Clearing solution with urea and Triton X-100 | Yes | Confocal Two-photon SRS | Not tested | >4 days | 23,24 |
Abbreviations: m (mouse); h (human); DBE (dibenzyl ether); DCM (dichloromethane); FFPE (formalin-fixed paraffin-embedded); LN (lymph node); LSFM (light sheet fluorescence microscopy); PFA (paraformaldehyde); SDS (sodium dodecyl sulphate); SRS (stimulated Raman scattering microscopy); THF (tetrahydrofuran)
Ke et al. developed an aqueous clearing agent known as SeeDB (Table 1), a high concentration solution of fructose (80% weight/volume) with 0.5% α-thioglycerol [5]. It is based on older applications of sucrose solutions to imaging brain slices. Importantly, SeeDB has a refractive index that closely matches that of lipids and it does not cause fluorescence quenching or tissue shrinkage. SeeDB is therefore a clearing method with some key advantages over other aqueous media.
Transparent Tissue Tomography (T3) is a newly developed workflow for multiplexed three-dimensional tissue analysis and relies on clearing with aqueous medium [6]. Prior to imaging, stained tissue sections are made optically transparent after incubation in an ascending gradient of D-fructose solutions containing α-thioglycerol [5]. This method is relatively fast (a few hours) as compared to other methods and avoids fluorescence quenching and the use of organic solvents [3,4].
Animal models [6] and human tissues [7] have been tested by T3. The workflow (Figures 1 and 2) starts with intact fresh tissues and yields a three-dimensional multiplex image dataset that can be quantitatively analyzed (Figure 3). Standard lab equipment and supplies are used and the entire procedure can be carried out in 2 days or less. It is also non-destructive, permitting further downstream analysis of the same tissue. At the start of the workflow, fresh tissue is lightly fixed. A lighter fixation treatment allows for antigen preservation while obviating the need to perform harsh antigen retrieval procedures, which are often required for tissues fixed using heavier fixation treatments. Conventional immunofluorescence (IF) exploits secondary antibodies conjugated to fluorescent dyes to amplify the detection of primary antibody-antigen interactions. However, finding secondary antibodies that do not have cross-reactivity with other primary antibodies being used or with endogenous IgG limits the number of multiplex combinations. This issue is avoided in the T3 workflow by only using primary antibodies and tailoring the combination of a specific fluorescent dye with each antibody. If tissue sectioning is necessary, a vibratome can be used to collect macrosections (i.e., sections on the order of several hundred micrometers thick). After three-dimensional imaging of each macrosection, the whole tissue can be reconstructed with good fidelity due to collection of thicker tissue sections rather than thin serial sections which are more likely to become distorted.
Figure 1. T3 workflow with macrosectioning.
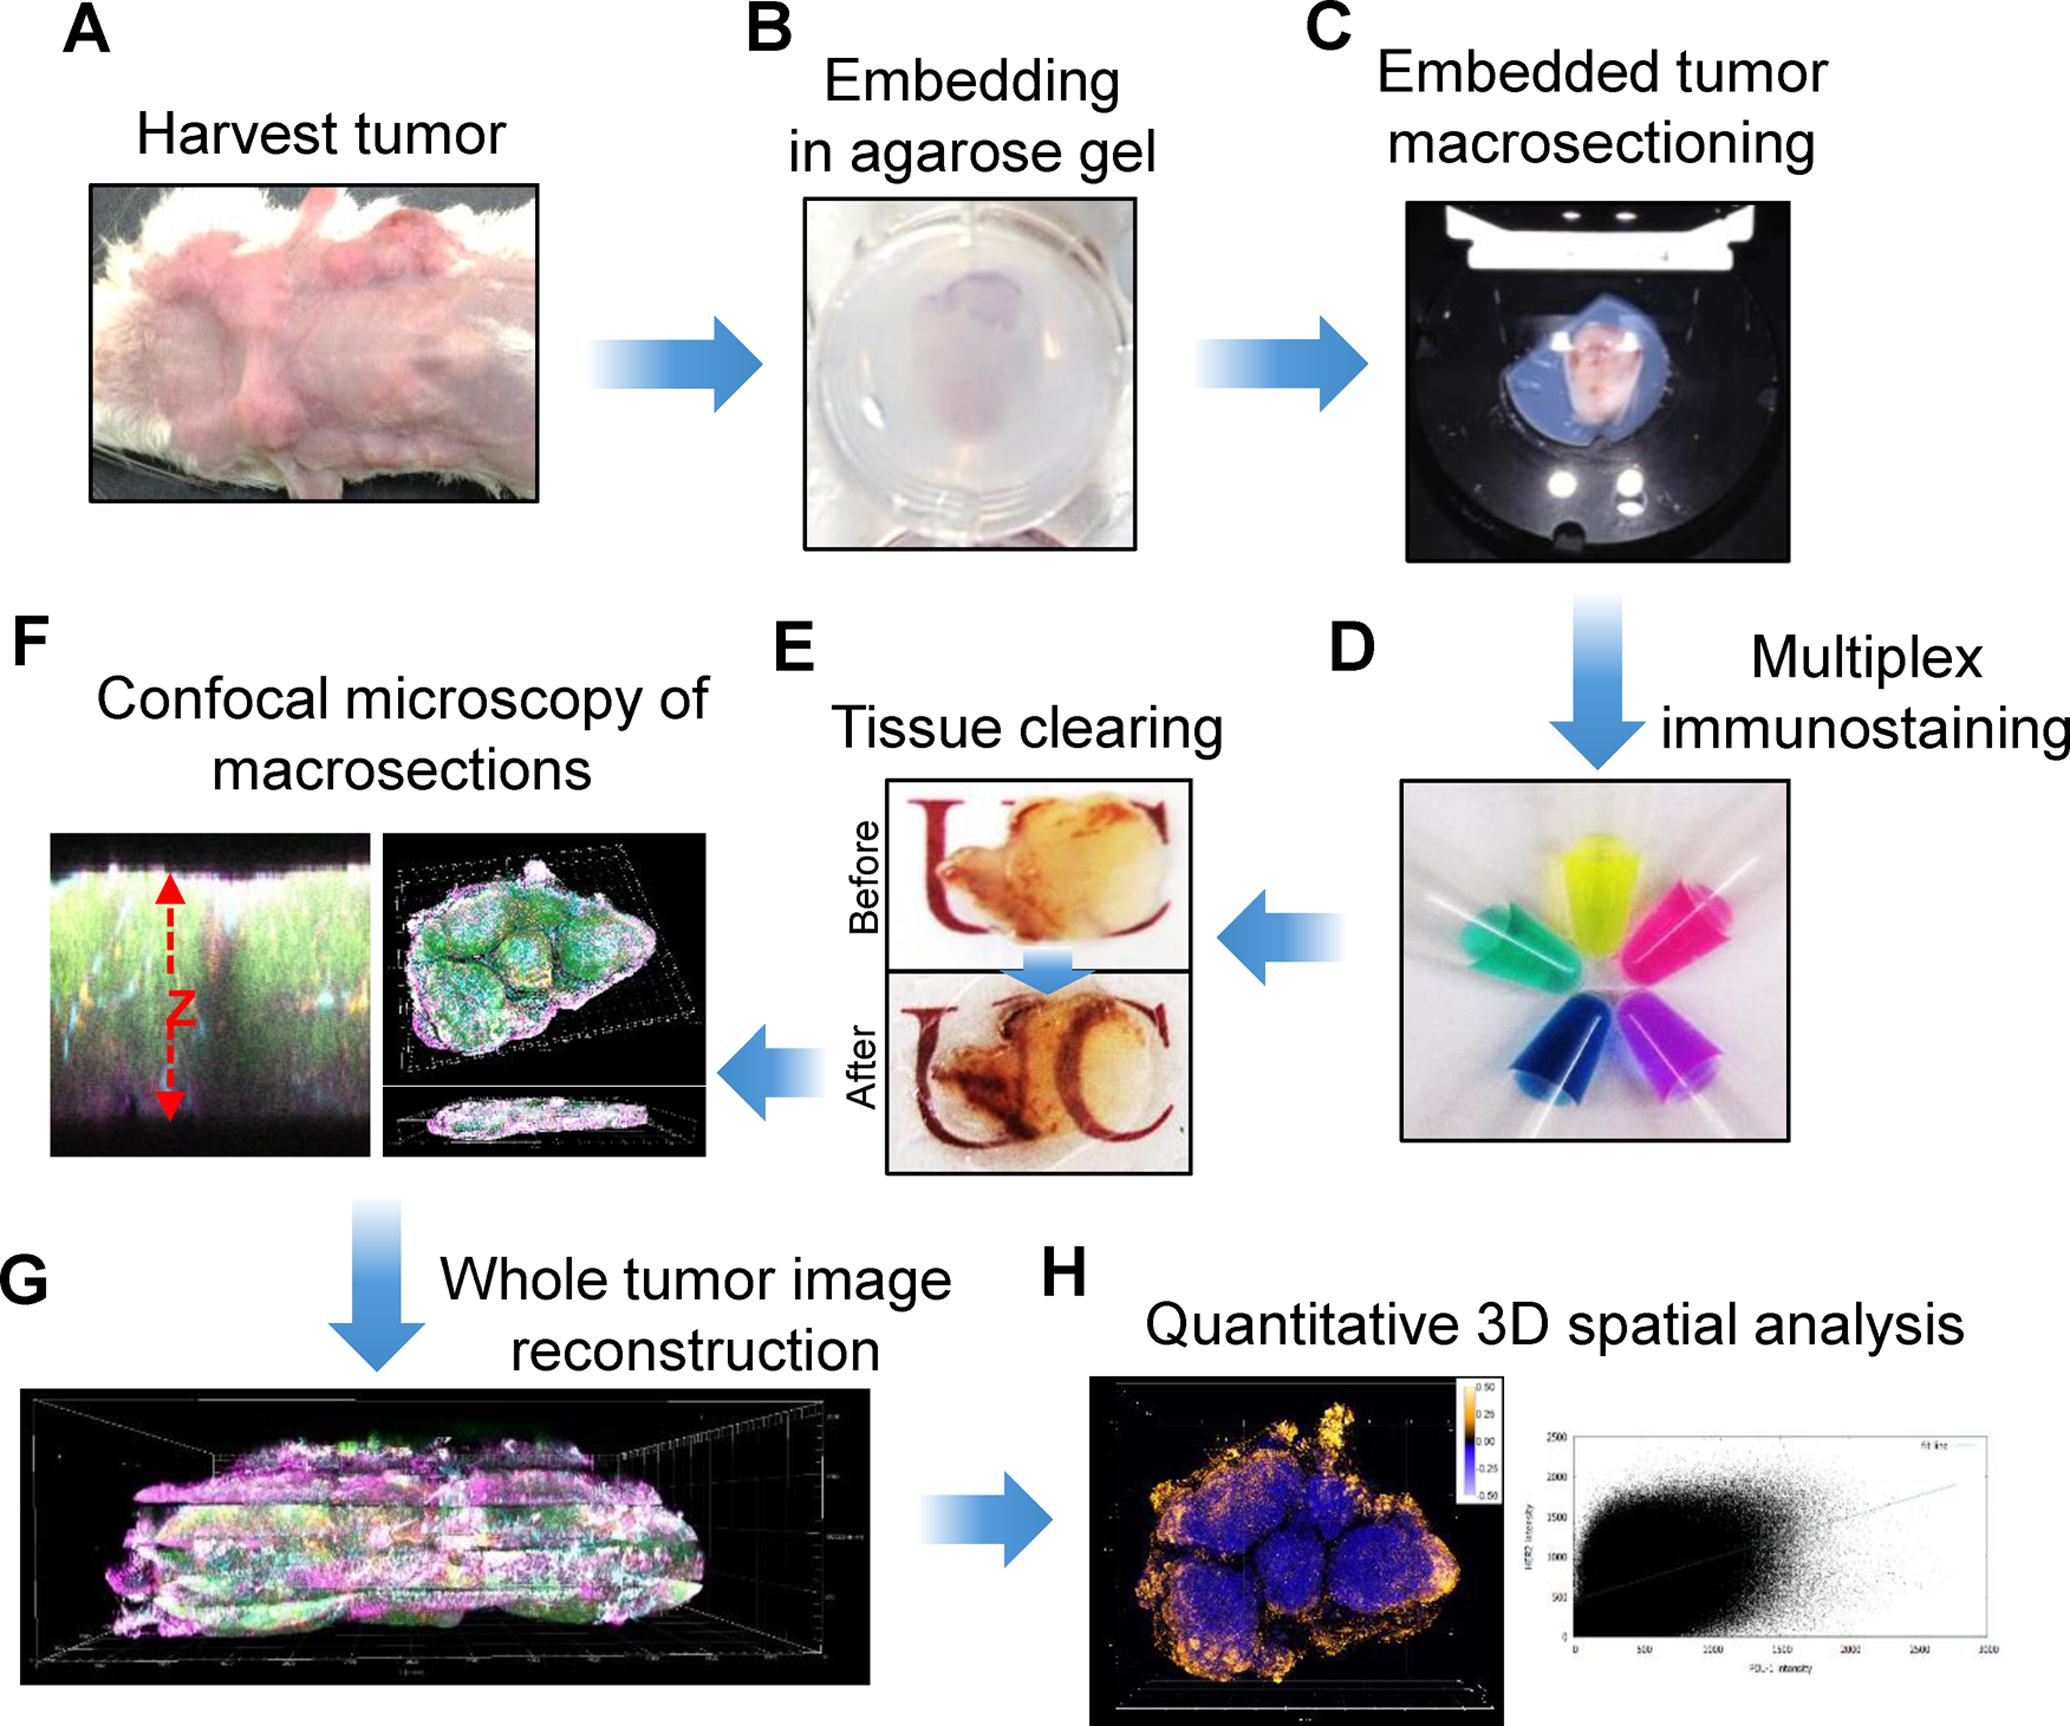
A) Harvesting whole tumors followed by light tissue fixation; B) Tissue embedding in 2% agarose gel; C) Collecting thick tissue sections (macrosections) from a vibrating microtome; D) Staining with a cocktail of fluorescent primary antibodies; E) Optical clearing of the macrosections using D-fructose solutions; F) Three-dimensional confocal imaging of multiple fluorophores; G) Image reconstruction of whole tumors by concatenating image data; H) 3D analysis of markers throughout whole tumor.
Reproduced from Lee et al., 2017 with permission from Nature (reference [6])
Figure 2. T3 workflow without macrosectioning.

A) Collection of a tissue cylinder (core) followed by light fixation. B) Placement of core in a pre-cast agarose well. C) Staining with a cocktail of fluorescent primary antibodies followed by washing and fixation. D) Optical clearing using D-fructose. E) Confocal imaging of both sides of the core. F) Fusion of half-cylinder images and reconstruction of the whole core; G) 3D spatial analysis of multiple markers. H) Removal of D-fructose and tissue fixation; I) 2D chromogenic immunohistochemistry (IHC) of each marker; J) Correlation between 2D and 3D image data.
Reproduced from Lee et al., 2018 with permission from Nature (reference [7])
Figure 3. 3D mapping of multiple markers in the microenvironment of a mouse tumor.

Top left: 3D rendering of a reconstructed mouse tumor revealing Her2+ cancer cells, CD45+ immune cells, proliferating cells (Ki-67), CD31+ endothelial cells, and PD-L1+ cells. Top left inset shows the appearance of the tumor mass after excision. Top right inset shows a representative 2D image with Her2+ cells. Top right: Lateral view of the reconstructed tumor shows the depth of the whole tumor. Bottom: 3D (left) and 2D (right) individual channel images for each of the five markers.
Adapted from Lee et al., 2017 with permission from Nature (reference [6])
Here we present a generalized workflow for T3. From the point of tissue collection to imaging, we highlight the key steps and considerations in performing fixation, embedding, sectioning, clearing, staining, and image reconstruction. Citations to key references are also provided for further information on materials, methods, and image analysis resources.
2. MATERIALS
2.1. Tissue Collection
2.1.1. Whole Tumor Excision
Asphyxiation Chamber
Fine tip forceps, curved or straight depending on user preference
Fine tip scissors
Storage container, such as a 12-well plate or conical tube of appropriate size
2.1.2. Core Needle Biopsy Collection
Isoflurane
Anesthesia chamber
Automated core needle biopsy device
12-well plate
P-1000 pipette and pipette tips
RPMI media
2.2. Fixation
16% paraformaldehyde (PFA)
12-well plate
Fine tip forceps
1X PBS (pH 7.4)
2.3. Tissue Embedding
2.3.1. Agarose Gel Embedding for Whole Tumors
Agarose gel solution: 2% agarose dissolved in distilled water
12-well plate
Fine tip forceps
Microwave or hot plate
Immersible thermometer (0 – 100°C)
2.3.2. Agarose Cassette Preparation for a Core Needle Biopsy
Agarose gel solution: 2% agarose dissolved in distilled water
2 cm diameter glass bottom dish
Glass scintillation vial cap
Ice bucket with ice
2 cm long needle of a gauge matched to the core biopsy needle used (see Note 1)
Single edged razor blade
Fine tip forceps
Ring tip forceps
Microwave or hot plate
Immersible thermometer (0 – 100°C)
2.4. Macrosectioning
Double edged stainless steel razorblades
12-well plate
Fine tip forceps
Agarose gel plug containing tumor sample
Super glue
Vibrating microtome
1X PBS (pH 7.4)
Ice
RPMI media
2.5. Antibody-Dye Conjugation
Primary antibodies of interest (see Note 2)
Fluorescent dyes for conjugation (see Note 3)
N,N-Dimethylformamide (DMF)
1X PBS (pH 8.0)
Dialysis cassettes (10,000 molecular weight cut-off)
1 mL syringes
18G needles
1 L plastic buckets
1X PBS (pH 7.4)
Aluminum foil
Shaker
Magnetic stir plates and stir bars
2.6. Antibody Staining
Staining buffer (kept on ice): RPMI media with 1% BSA (does not need to be IgG-free) and 0.3% (for mouse) or 0.1% (for human) Triton X-100
Fluorescent dye-conjugated monoclonal antibodies (stored at 4°C, in the dark)
P-1000 and P-100 pipettes and pipette tips
12-well plate
Fine tip forceps
Parafilm
Aluminum foil
Shaker
2.7. Optical Clearing
16% PFA
1X PBS (pH 7.4)
Phosphate buffer solution: Add 800 mL of distilled water to suitable container. Add 20.209 g Na2HPO4•7H2O and 3.394 g NaH2PO4•H2O and adjust pH to 7.8 Add distilled water until volume is 1 L. Store at room temperature
Clearing solutions: Add 8.0 g D-Fructose to appropriate container. Fill with phosphate buffer solution until volume is 40 mL (20% D-Fructose, w/v). Vortex solution well. For macrosection samples, repeat with 20.0 g and 32.0 g D-fructose for 50% and 80% (w/v) solutions, respectively. For core biopsy samples, repeat with 20.0 g and 40.0 g D-fructose for 50% and 100% (w/v) solutions, respectively. After D-fructose is dissolved, add 0.5% α-thioglycerol to each solution. These solutions need to be made at least one day before performing tissue clearing. Shake overnight at room temperature to completely dissolve.
Fine forceps
Glass scintillation vials with caps
Shaker
2.8. Imaging
Confocal microscope (see Note 4)
Microscope cover glasses (24 × 50 mm; #1 or #1.5 thickness, dependent on microscope objective)
Tweezers
3. METHODS
3.1. Antibody-Dye Conjugation
Solubilize amine-reactive fluorescent dye in N,N-dimethylformamide, according to manufacturer instructions.
Dilute the primary antibody in 1X PBS (pH 8.0) and add excess fluorescent dye for conjugation reaction. Calculate the volumes required according to manufacturer instructions. As a guideline, a 30:1 dye:antibody molar ratio is typically acceptable.
Allow the antibody and dye conjugation reaction to proceed overnight at 4°C with gentle agitation.
Carefully inject the fluorescent dye-conjugated antibody mixture into a dialysis cassette. Place the cassette into a 1 L bucket containing 1X PBS (pH 7.4) and protected from light with aluminum foil (see Note 5).
Allow dialysis to proceed on a magnetic stir plate overnight at 4°C.
Change the dialysis buffer twice, once on each of the following two days.
After 3 days, unreacted dye will have been removed into the buffer solution.
Remove the fluorescent dye-conjugated antibody mixture from the cassette.
Perform degree of labeling (DOL) quantitation (see Note 6).
If conjugate DOL is in acceptable range (3 – 7 fluorophores per IgG), store protected from light at 4°C.
3.2. Tissue Collection
3.2.1. Whole Tumor Excision
Sacrifice animal in anesthesia chamber using a humane method such as a CO2 asphyxiation.
Using fine tip scissors, make a small incision near the tumor site. Insert closed scissor into incision and open to begin clearing the area around the tumor.
Using scissors and forceps, carefully remove connective tissue from around tumor area to free tumor from the animal body. Remove any residual fur and skin (see Note 7).
Using forceps, transfer tumor tissue to appropriate storage container, such as a 12-well plate, and cover with PBS.
3.2.2. Core Needle Biopsy Collection
Anesthetize animals using 2% vaporized isoflurane.
Using an automated core needle biopsy device, collect a sample through the middle of the tumor, avoiding necrotic areas.
Collect core needle biopsy sample in 12-well plate by gently pipetting RPMI media over sample in specimen notch until it is released from the device.
3.2.3. Fixation
Dilute 16% PFA to 2% PFA in 1X PBS (pH 7.4).
Transfer sample to an empty well of 12-well plate and cover with 2% PFA. Fix at room temperature for 5 minutes.
Wash tumor in PBS at room temperature 3 times, for 10 minutes each.
3.3. Tissue Embedding
3.3.1. Agarose Gel Embedding and Macrosectioning for Whole Tumors
Make agarose gel solution and microwave for 1 minute or until agarose has completely dissolved.
Let molten agarose cool to 37°C (see Note 8).
Pour molten agarose into well of 12-well plate, and using forceps transfer the tumor to the well containing agarose.
Cover well plate and let agarose completely harden.
After agarose has hardened, remove gel plug containing tumor using fine tip forceps (see Note 9).
Super glue bottom of gel plug to vibrating microtome removable stage.
Cut 400 μm thick macrosections of tumor tissue. Collect in a chilled PBS bath on the vibrating microtome, and then transfer to a 12-well plate containing RPMI media.
3.3.2. Agarose Cassette Preparation for a Core Needle Biopsy
Pour about 700 μL of molten 2% agarose solution into a 2 cm glass bottom dish.
Place an appropriately sized needle into dish. Make sure needle is completely submerged in agarose.
Cover agarose and needle with the top of the glass scintillation vial cap. Place on ice until agarose has completely cooled.
Remove cap and use fine tip forceps to remove any agarose that came out from under the cap.
Using the edge of a razor blade, gently remove agarose cassette from glass bottom dish. Using fine tip forceps, remove the needle from the agarose by pulling it up through the cassette so that it forms a well. Do not push the needle through the cassette, forming a tunnel.
Using ring forceps, gently transfer the core needle biopsy sample to the well of the agarose cassette. Open and then close the cassette by gently bending it to capture the tumor sample in the well.
3.4. Antibody Staining
Add fluorescent dye-conjugated antibodies to staining buffer at user-determine optimal titrations (see Note 10).
Add 250 μL of staining buffer to each tumor macrosection in a 12-well plate, or enough to cover.
Seal plate with parafilm and cover with aluminum foil.
Gently shake for at least 18 hours at 4°C (see Note 11).
3.5. Optical Clearing
On a shaker, wash macrosections in cold PBS 3 to 5 times for 10 minutes each.
Dilute 16% PFA to 2% PFA in 1X PBS (pH 7.4).
Fix the macrosections in 2% PFA at room temperature for 10 minutes.
Pour 10 mL of 20% D-fructose clearing solution into a glass scintillation vial. Carefully transfer the tumor macrosections to the vial.
Gently shake at room temperature in the dark for at least 20 minutes.
Repeat steps 4 and 5 with 50% D-fructose clearing solution.
Pour 10 mL of 100% D-fructose (core needle biopsy samples) or 80% D-fructose (macrosections) clearing solution into a glass scintillation vial. Add tumor macrosections to the vial.
Gently shake at room temperature in the dark until tumor is optically cleared, at least 1 hour.
If desired, verify tissue clearing using a spectrophotometer (see Note 12).
3.6. Imaging
Using tweezers, remove optically cleared tissue from 100% D-fructose clearing solution and place on a microscope cover glass.
Gently place a second microscope cover glass on top of the tissue, taking care to avoid creating bubbles.
Transport tissue sections to a confocal microscope.
Image tissue sections on a confocal microscope. Antibody-dye conjugates that have not been validated should be tested for specificity and staining depth. Use a high-resolution objective (40X) to visualize the sample at the single-cell level and confirm targets were stained as expected. Acquire digital images as desired.
For most microscopes, up to 5 fluorescent dye channels may be used (488, 550, 594, 633, and 680 nm). However, each microscope is different and the T3 antibody panel used should be tailored to the microscope that is available.
To evaluate the depth of staining, use the Z stage functionality of the microscope to scan vertically through the tissue until no more staining is observed. Using the image software, digitally mark this position as the lower edge of the tissue. Next, scan up through the tissue until no more staining is observed. Digitally mark this position as the upper edge of the tissue. Additionally, some microscopes are equipped with “xzy” cross sectional imaging functionality. This can be utilized to view the staining depth in a very easy manner. Top-bottom staining depth should be close to the actual tissue thickness in micrometers.
Imaging of whole tissues should be carried out with a 10X objective, while specific regions of interest should be imaged using a higher magnification objective.
4. Notes
For selection of needles for core biopsy and preparation of the core agarose cassette, the gauge of the needle used for making the cassette is dependent on the gauge of the core needle biopsy device. The gauge of the needle used for preparing the cassette should thus be equal to the gauge of the biopsy device needle. Further, the length of the cassette needle should be equal to the diameter of the glass bottom dish used for cassette preparation.
Primary antibodies and fluorescent dye combinations must be chosen carefully. For primary antibodies, it is recommended to use strictly monoclonal antibodies for enhanced target specificity and tissue penetration. When purchasing monoclonal antibodies, clones are preferable that have been cited in multiple publications for immunofluorescence assays. If there is not a commercial antibody that meets these criteria, it is then recommended to obtain several different clones and test each on tissue known to be antigen-positive, in order to select an optimal antibody for use. Optimal antibody titration should be user-determined, although if available, manufacturer recommended titration can be used as a starting point.
A wide variety of commercial fluorescent dyes (e.g. Alexa Fluor or DyLight) may be used for antibody conjugation. Various conjugation chemistries may be used, but our group has mostly utilized amine-reactive NHS dyes. Dyes should be selected which have excitation and emission spectra that are compatible with the optical capabilities of the confocal microscope that will be used for imaging. Alternatively, commercially available conjugated fluorescent antibodies may be acceptable (and a time saver) if they are available as monoclonals, have the desired fluorescent dye, and are determined by the user to perform well for T3.
There are many different models of confocal microscopes available. Microscopes equipped with a white line laser offer the greatest flexibility in fluorescent dye excitation. If a white line laser is not available, separate lasers that can excite all fluorescent dyes to be used in the T3 experiment is necessary. Microscopes should have adjustable XY functionality to capture the entire XY area of tissue, as well as a galvometric Z stage to image the depth of the tissue. For imaging Z stacks, a 7 μm step size is sufficient to capture all cells. Regarding microscope objectives, the working distance of the objective in use must be greater than the thickness of the tissue being imaged. Otherwise, the objective will not be able to image the entire Z-depth of the tissue. While this is not an issue for most standard high-quality objectives between 10X and 40X magnification, which often have working distances sufficient for most macrosections, high-magnification objectives (60X to 100X) often have reduced working distances and may not be suitable.
Be careful not to puncture the side of the dialysis cassette membrane when inserting the needle into the cassette. Different antibodies conjugated to the same fluorescent dye may be dialyzed in the same PBS bath container, but never dialyze antibodies conjugated to different dyes in the same container to avoid cross reactions.
Test the fluorescent dye degree of labelling (DOL) to make sure antibody conjugation was successful. Most dye manufacturers should include a short protocol for testing DOL in the respective manual. Many protocols for DOL are available online as well. For T3 experiments, DOL should be in the range of 3 – 7 fluorophores per IgG molecule. However, some antigens that are more ubiquitous in the tissue may stain sufficiently using a conjugate with DOL < 3. Upon conjugation, each new batch of antibody-dye conjugate should be tested for performance.
When excising tumors, be as careful as possible to remove any skin or fur from the tumor itself. Skin and fur will cause autofluorescence when imaging, which will obfuscate the imaging of target biomarkers. If the skin on top of the tumor cannot be released, carefully cut it away using scissors, while maintaining the structural integrity of the tumor tissue as much as possible.
It is recommended to apply molten agarose to samples at a temperature of 37°C. If the agarose solution is warmer than 37°C, there is potential to damage the tissue when embedding. Similarly, overheated agarose solution will allow tumor tissue to sink directly to bottom of 12-well plate. Agarose gel solution that has been slightly cooled, but not yet hardened, will be more viscous and will let the tumor settle in the middle of the well, which will make macrosectioning easier. It is highly recommended to use low-melt agarose, which remains liquid at 37°C for several hours, to alleviate these issues. To maintain agarose at 37°C, a water bath or dry heat block set to this temperature can be used.
Remove gel plug by sliding open forceps down the side of the well containing gel plug, then gently twist and pull up, which should release the plug from the well. Some agarose gel may come removed from the plug, but as long as the majority of the plug stays intact, the tissue will be fine. Once the plug is removed, it may be handled with gloved hands.
Staining buffer should be made in 10 mL aliquots. For each macrosection, at least 250 μL of staining buffer with conjugated antibodies is needed, however larger volumes may be used. For most antibodies, a 1:20 dilution in staining buffer should be used. Some antigens require less fluorescent dye-conjugated antibody; this should be optimized for each antigen.
A staining time of at least 18 hours is recommended to ensure sufficient penetration of all antibodies into the tissue and thus enables convenient “overnight” staining, which may be desirable to the researcher. If staining depth is found to be limited after 18 hours of staining, consider adjusting the following: increasing the incubation time, the antibody concentration in the staining buffer, and/or the concentration of Triton X-100 up to 0.5%. Sodium dodecyl sulphate (SDS; 0.01 to 0.1%) may also enhance antibody permeability. As well, a near-infrared wavelength dye could be conjugated to the antibody to enhance visualization at greater depth.
To evaluate tissue clearing efficacy, it is recommended to verify the percent transmittance of samples across ultraviolet, visible, and near-infrared wavelengths using a spectrophotometer, such as the Agilent 8453 (see Supplementary Information of reference [6]). If transmittance is low, tumor necrosis may be an issue. Tumor tissue that is necrotic will not clear, and will remain opaque after incubating in 100% D-fructose clearing solution.
5. References
- 1.Azaripour A, Lagerweij T, Scharfbillig C, Jadczak AE, Willershausen B, Van Noorden CJF (2016) A survey of clearing techniques for 3D imaging of tissues with special reference to connective tissue. Prog Histochem Cytochem 51:9–23. doi: 10.1016/J.PROGHI.2016.04.001 [DOI] [PubMed] [Google Scholar]
- 2.Chung K, Wallace J, Kim S-Y, Kalyanasundaram S, Andalman AS, Davidson TJ, Mirzabekov JJ, Zalocusky KA, Mattis J, Denisin AK, Pak S, Bernstein H, Ramakrishnan C, Grosenick L, Gradinaru V, Deisseroth K (2013) Structural and molecular interrogation of intact biological systems. Nature 497:332–337. doi: 10.1038/nature12107 [DOI] [PMC free article] [PubMed] [Google Scholar]
- 3.Ertürk A, Becker K, Jährling N, Mauch CP, Hojer CD, Egen JG, Hellal F, Bradke F, Sheng M, Dodt H-U (2012) Three-dimensional imaging of solvent-cleared organs using 3DISCO. Nat Protoc 7:1983–1995. doi: 10.1038/nprot.2012.119 [DOI] [PubMed] [Google Scholar]
- 4.Renier N, Wu Z, Simon DJ, Yang J, Ariel P, Tessier-Lavigne M (2014) iDISCO: A Simple, Rapid Method to Immunolabel Large Tissue Samples for Volume Imaging. Cell 159:896–910. doi: 10.1016/J.CELL.2014.10.010 [DOI] [PubMed] [Google Scholar]
- 5.Ke M-T, Fujimoto S, Imai T (2013) SeeDB: a simple and morphology-preserving optical clearing agent for neuronal circuit reconstruction. Nat Neurosci 16:1154–1161. doi: 10.1038/nn.3447 [DOI] [PubMed] [Google Scholar]
- 6.Lee SS-Y, Bindokas VP, Kron SJ (2017) Multiplex three-dimensional optical mapping of tumor immune microenvironment. Sci Rep 7:17031. doi: 10.1038/s41598-017-16987-x [DOI] [PMC free article] [PubMed] [Google Scholar]
- 7.Lee SS-Y, Bindokas VP, Lingen MW, Kron SJ (2018) Nondestructive, multiplex three-dimensional mapping of immune infiltrates in core needle biopsy. Lab Investig 1. doi: 10.1038/s41374-018-0156-y [DOI] [PMC free article] [PubMed] [Google Scholar]
- 8.Chen Y, Shen Q, White SL, Gokmen-Polar Y, Badve S, Goodman LJ (2019) Three-dimensional imaging and quantitative analysis in CLARITY processed breast cancer tissues. Sci Rep 9:5624. doi: 10.1038/s41598-019-41957-w [DOI] [PMC free article] [PubMed] [Google Scholar]
- 9.Sindhwani S, Syed AM, Wilhelm S, Glancy DR, Chen YY, Dobosz M, Chan WCW (2016) Three-Dimensional Optical Mapping of Nanoparticle Distribution in Intact Tissues. ACS Nano 10:5468–5478. doi: 10.1021/acsnano.6b01879 [DOI] [PubMed] [Google Scholar]
- 10.Ono Y, Nakase I, Matsumoto A, Kojima C (2019) Rapid optical tissue clearing using poly(acrylamide-co-styrenesulfonate) hydrogels for three-dimensional imaging. J Biomed Mater Res Part B Appl Biomater. doi: 10.1002/jbm.b.34322 [DOI] [PubMed] [Google Scholar]
- 11.Glaser AK, Reder NP, Chen Y, McCarty EF, Yin C, Wei L, Wang Y, True LD, Liu JTC (2017) Light-sheet microscopy for slide-free non-destructive pathology of large clinical specimens. Nat Biomed Eng 1:0084. doi: 10.1038/s41551-017-0084 [DOI] [PMC free article] [PubMed] [Google Scholar]
- 12.Tanaka N, Kanatani S, Tomer R, Sahlgren C, Kronqvist P, Kaczynska D, Louhivuori L, Kis L, Lindh C, Mitura P, Stepulak A, Corvigno S, Hartman J, Micke P, Mezheyeuski A, Strell C, Carlson JW, Fernández Moro C, Dahlstrand H, Östman A, Matsumoto K, Wiklund P, Oya M, Miyakawa A, Deisseroth K, Uhlén P (2017) Whole-tissue biopsy phenotyping of three-dimensional tumours reveals patterns of cancer heterogeneity. Nat Biomed Eng 1:796–806. doi: 10.1038/s41551-017-0139-0 [DOI] [PubMed] [Google Scholar]
- 13.Tanaka N, Kaczynska D, Kanatani S, Sahlgren C, Mitura P, Stepulak A, Miyakawa A, Wiklund P, Uhlén P (2018) Mapping of the three-dimensional lymphatic microvasculature in bladder tumours using light-sheet microscopy. Br J Cancer 118:995–999. doi: 10.1038/s41416-018-0016-y [DOI] [PMC free article] [PubMed] [Google Scholar]
- 14.Li W, Germain RN, Gerner MY (2017) Multiplex, quantitative cellular analysis in large tissue volumes with clearing-enhanced 3D microscopy (C e 3D). Proc Natl Acad Sci U S A 114:E7321–7330. doi: 10.1073/pnas.1708981114 [DOI] [PMC free article] [PubMed] [Google Scholar]
- 15.Li W, Germain RN, Gerner MY (2019) High-dimensional cell-level analysis of tissues with Ce3D multiplex volume imaging. Nat Protoc 1. doi: 10.1038/s41596-019-0156-4 [DOI] [PMC free article] [PubMed] [Google Scholar]
- 16.Kubota SI, Takahashi K, Nishida J, Morishita Y, Ehata S, Tainaka K, Miyazono K, Ueda HR (2017) Whole-Body Profiling of Cancer Metastasis with Single-Cell Resolution. Cell Rep 20:236–250. doi: 10.1016/J.CELREP.2017.06.010 [DOI] [PubMed] [Google Scholar]
- 17.Cuccarese MF, Dubach JM, Pfirschke C, Engblom C, Garris C, Miller MA, Pittet MJ, Weissleder R (2017) Heterogeneity of macrophage infiltration and therapeutic response in lung carcinoma revealed by 3D organ imaging. Nat Commun 8:14293. doi: 10.1038/ncomms14293 [DOI] [PMC free article] [PubMed] [Google Scholar]
- 18.Susaki EA, Tainaka K, Perrin D, Yukinaga H, Kuno A, Ueda HR (2015) Advanced CUBIC protocols for whole-brain and whole-body clearing and imaging. Nat Protoc 10:1709–1727. doi: 10.1038/nprot.2015.085 [DOI] [PubMed] [Google Scholar]
- 19.Nojima S, Susaki EA, Yoshida K, Takemoto H, Tsujimura N, Iijima S, Takachi K, Nakahara Y, Tahara S, Ohshima K, Kurashige M, Hori Y, Wada N, Ikeda J, Kumanogoh A, Morii E, Ueda HR (2017) CUBIC pathology: three-dimensional imaging for pathological diagnosis. Sci Rep 7:9269. doi: 10.1038/s41598-017-09117-0 [DOI] [PMC free article] [PubMed] [Google Scholar]
- 20.Lloyd-Lewis B, Davis FM, Harris OB, Hitchcock JR, Lourenco FC, Pasche M, Watson CJ (2016) Imaging the mammary gland and mammary tumours in 3D: optical tissue clearing and immunofluorescence methods. Breast Cancer Res 18:127. doi: 10.1186/s13058-016-0754-9 [DOI] [PMC free article] [PubMed] [Google Scholar]
- 21.Lee SS-Y, Bindokas VP, Kron SJ (2018) Multiplex Three-Dimensional Mapping of Macromolecular Drug Distribution in the Tumor Microenvironment. Mol Cancer Ther 18:213–226. doi: 10.1158/1535-7163.MCT-18-0554 [DOI] [PMC free article] [PubMed] [Google Scholar]
- 22.Rios AC, Capaldo BD, Vaillant F, Pal B, van Ineveld R, Dawson CA, Chen Y, Nolan E, Fu NY, Jackling FC, Devi S, Clouston D, Whitehead L, Smyth GK, Mueller SN, Lindeman GJ, Visvader JE (2019) Intraclonal Plasticity in Mammary Tumors Revealed through Large-Scale Single-Cell Resolution 3D Imaging. Cancer Cell 35:618–632.e6. doi: 10.1016/J.CCELL.2019.02.010 [DOI] [PubMed] [Google Scholar]
- 23.Hama H, Kurokawa H, Kawano H, Ando R, Shimogori T, Noda H, Fukami K, Sakaue-Sawano A, Miyawaki A (2011) Scale: a chemical approach for fluorescence imaging and reconstruction of transparent mouse brain. Nat Neurosci 14:1481–1488. doi: 10.1038/nn.2928 [DOI] [PubMed] [Google Scholar]
- 24.Wei M, Shi L, Shen Y, Zhao Z, Guzman A, Kaufman LJ, Wei L, Min W (2019) Volumetric chemical imaging by clearing-enhanced stimulated Raman scattering microscopy. Proc Natl Acad Sci U S A 116:6608–6617. doi: 10.1073/pnas.1813044116 [DOI] [PMC free article] [PubMed] [Google Scholar]