

Abstract
Population structure influences genealogical patterns, however, data pertaining to how populations are structured are often unavailable or not directly observable. Inference of population structure is highly important in molecular epidemiology where pathogen phylogenetics is increasingly used to infer transmission patterns and detect outbreaks. Discrepancies between observed and idealized genealogies, such as those generated by the coalescent process, can be quantified, and where significant differences occur, may reveal the action of natural selection, host population structure, or other demographic and epidemiological heterogeneities. We have developed a fast non-parametric statistical test for detection of cryptic population structure in time-scaled phylogenetic trees. The test is based on contrasting estimated phylogenies with the theoretically expected phylodynamic ordering of common ancestors in two clades within a coalescent framework. These statistical tests have also motivated the development of algorithms which can be used to quickly screen a phylogenetic tree for clades which are likely to share a distinct demographic or epidemiological history. Epidemiological applications include identification of outbreaks in vulnerable host populations or rapid expansion of genotypes with a fitness advantage. To demonstrate the utility of these methods for outbreak detection, we applied the new methods to large phylogenies reconstructed from thousands of HIV-1 partial pol sequences. This revealed the presence of clades which had grown rapidly in the recent past and was significantly concentrated in young men, suggesting recent and rapid transmission in that group. Furthermore, to demonstrate the utility of these methods for the study of antimicrobial resistance, we applied the new methods to a large phylogeny reconstructed from whole genome Neisseria gonorrhoeae sequences. We find that population structure detected using these methods closely overlaps with the appearance and expansion of mutations conferring antimicrobial resistance. [Antimicrobial resistance; coalescent; HIV; population structure.]
Quantifying the role of population structure in shaping genetic diversity is a longstanding problem in population genetics. When information about how lineages are sampled is available, primarily geographic location, a variety of statistics are available for describing the magnitude and role of population structure (Hartl et al. 1997). In pathogen phylogenetics, such geographic “meta-data” has been instrumental in enabling the inference of transmission rates over space (Dudas et al. 2017), host species (Lam et al. 2015), and even individual hosts (De Maio et al. 2018). Population structure shapes genetic diversity but can the existence of structure be inferred directly from genetic data in the absence of structural covariates associated with each lineage, such as if the geographic location or host species of a lineage is unknown?
The problem of detecting and quantifying such “cryptic” population structure has become a pressing issue in several areas of microbial phylogenetics. For example, in bacterial population genomics studies, a wide diversity of methods have been recently developed to classify taxonomic units based on distributions of genetic relatedness (Mostowy et al. 2017; Beugin et al. 2018; Tonkin-Hill et al. 2019; Tonkin-Hill et al. 2018). In a different domain, pathogen sequence data have been used for epidemiological surveillance, and “clustering” patterns of closely related sequences have been used to aid outbreak investigations and prioritize public health interventions (Eyre et al. 2012; Dennis et al. 2014; Miller et al. 2014; Ledda et al. 2017). In both population genomics studies and outbreak investigations, a common thread is the absence of variables about sampled lineages that can be correlated with phylogenetic patterns. For example, in outbreak investigations, host risk behavior and transmission patterns are not usually observed and must be inferred. It is not known a priori which clades are more or less likely to expand in the future, although there is active research addressing this problem, such as to predict the emergence of strains of influenza A virus (Klingen et al. 2018) or to forecast the effect of antibiotic usage policies on the prevalence of resistant variants (Whittles et al. 2017).
In time-scaled phylogenies, the effects of population structure often appear as a difference in the distribution of branch lengths in clades circulating in different populations (Dearlove and Frost 2015). Figure 1 shows a simulated genealogy from a structured coalescent process (Notohara 1990). In two clades, the effective population size grows exponentially, and in the remaining clade, the effective size remains constant. Consequently, the number of lineages through time show noticeably different patterns of relatedness. For the clades with growing size, most coalescent events occur in the distant past when the size was small.
Figure 1.

A genealogy simulated from a structured coalescent process with two demes, one of which has constant effective population size (clade highlighted in blue), and the other having effective population size growing exponentially (clades highlighted in red and yellow). Migration of lineages occurs at a small constant rate in one direction from the constant size deme to the growing deme. The corresponding plots at the right show a caricature of the effective population size and number of lineages through time in each clade.
Supposing that the deme from which lineages were sampled was not observed, it is clear from visual inspection of Figure 1 which lineages were sampled from a growing population. Nevertheless, there is a paucity of objective methods readily available to automate the process of identifying temporally distinct clades. This process cannot be done manually when the differences in distributions are less obvious, and needs to be based on a theoretically grounded statistical test. Furthermore, in Figure 1, the red and yellow clades are distantly related. Their most recent common ancestor (MRCA) is at the root of the tree, but they have a very similar distribution of coalescent times suggesting that they were generated by similar demographic or epidemiological processes. For example, this can happen in infectious disease epidemics, when lineages independently colonise the same host population with greater susceptibility or higher risk behavior (Dearlove et al. 2017). It is therefore also desirable to have an automated method for identifying polyphyletic taxonomic groups defined by shared inferred population histories as opposed to genetic or phenotypic traits.
Here, we develop a statistical test for detecting if clades within a time-scaled genealogy have evidence for unobserved population structure. Our approach is to develop a statistic based on an unstructured coalescent process. This allows us to test a null hypothesis that two clades are both generated by the same coalescent process. In this case, the coalescent model provides a theoretical prediction of the order of the coalescent times between the two clades in the absence of population structure. On the basis of this statistical test, we also develop algorithms for systematically exploring possible partitions of a genealogy into distinct sets representing evolution within latent populations with different demographic or epidemic histories. Notably, these algorithms not only allow us to detect outlying clades with very different genealogical patterns but also to find and classify distantly related clades which likely have similar demographic or epidemic histories.
Materials and Methods
As a starting point for our methodology, we assume a time-scaled phylogeny has been estimated from genetic data, for example, using one of the recently developed fast methods (To et al. 2016; Volz and Frost 2017; Didelot et al. 2018; Sagulenko et al. 2018; Tamura et al. 2018; Miura et al. 2020). Alternatively, summary trees obtained from full Bayesian approaches as implemented in BEAST (Bouckaert et al. 2014; Suchard et al. 2018) or RevBayes (Höhna et al. 2016) can be used, although these typically incorporate population genetic models which presume a particular form of population structure or a lack of population structure. Some precise terminology and notation is required related to the structure of these time-scaled trees since the basis of our approach concerns comparisons between different subsets of the tree.
Notation
The tree has  terminal nodes (nodes with no
descendants), is rooted, and is bifurcating (there are
terminal nodes (nodes with no
descendants), is rooted, and is bifurcating (there are  internal
nodes each with exactly two descendants). Being rooted implies there is one node with no
ancestor. Mathematically, we describe this tree as a node-labeled directed acyclic graph:
internal
nodes each with exactly two descendants). Being rooted implies there is one node with no
ancestor. Mathematically, we describe this tree as a node-labeled directed acyclic graph:
 |
where  is a set of
 nodes,
  is the set of
  edges or “lineages”, and
 defines the time of each node. With reference to an edge
  we say that
 is the “direct ancestor” and
 is the “direct descendant” and we require
 . Nodes are further
classified into two sets: “tips” (terminal nodes) denoted
. Nodes are further
classified into two sets: “tips” (terminal nodes) denoted  with
no descendants and internal nodes denoted
with
no descendants and internal nodes denoted  with exactly two
direct descendants. The trees may be heterochronous, meaning that tips of the tree can
represent samples taken at different time points.
with exactly two
direct descendants. The trees may be heterochronous, meaning that tips of the tree can
represent samples taken at different time points.
For a node  we define the clade
 to be the set of nodes descending from
 , that is, the node
 and all
  such that there is a directed path of edges from
  to
to
 . We say that nodes
 in
in  are “descended from”
 . We will also have occasion to define
clades “top down” in terms of a subset of tips in the tree. For this, we define the most
recent common ancestor
. We will also have occasion to define
clades “top down” in terms of a subset of tips in the tree. For this, we define the most
recent common ancestor  of a set
 to be the most
recent node
to be the most
recent node  such that
  , that is, all other nodes
 with
with  have
have
 . Then we let the
top-down clade
. Then we let the
top-down clade  be defined as
 |
Note that  includes the tips
 as well as some nodes ancestral to
MRCA(
as well as some nodes ancestral to
MRCA( ).
).
In general  since
since
 does not necessarily include all tips
descending from
does not necessarily include all tips
descending from  . We will also need to refer
to the nodes corresponding to coalescent events among lineages of the set
. We will also need to refer
to the nodes corresponding to coalescent events among lineages of the set
 only, excluding those between lineages of
 and lineages of the complement of
 ,
,
 |
Figure 2a illustrates a tree and the sets
 and
and  .
.
Figure 2.

Coalescent trees for illustrating taxonomic relationships and notation used
throughout the text. In panel a, the shape and color of nodes correspond to variables
 and
and
 in relation to
the set of tips
in relation to
the set of tips  . All circles
regardless of color correspond to
. All circles
regardless of color correspond to  .
All filled shapes (red or black, square, or circle) correspond to
.
All filled shapes (red or black, square, or circle) correspond to
 . Note that this includes nodes
ancestral to the MRCA of
. Note that this includes nodes
ancestral to the MRCA of  . All red filled circles correspond
to
. All red filled circles correspond
to  . Two coalescent events occur
among nodes in
. Two coalescent events occur
among nodes in  at times
 and
and  .
Panels b–d show a coalescent tree and examples of potential taxonomic relationships
between two clades. Prior knowledge of taxonomic relationships between
.
Panels b–d show a coalescent tree and examples of potential taxonomic relationships
between two clades. Prior knowledge of taxonomic relationships between
 and
and  influences the probability that the next coalescent event will be observed in clade
 .
.
Since each node has a time, we can define the set of “extant” lineages
 at a particular time
 to be the set of nodes occurring after
time
to be the set of nodes occurring after
time  with a direct ancestor before time
 ,
,
 |
We might also refer to the number of extant lineages at time  ,
,
 , and if considering
the number of extant lineages within a particular clade ancestral to (and including)
, and if considering
the number of extant lineages within a particular clade ancestral to (and including)
 we write
 |
Non-Parametric Test For a Given Pair of Clades
With the above notation, the rank-sum statistic can now be defined which will form the basis for subsequent statistical tests and can be used to compare any pair of clades in the tree.
Let  and
and  represent disjoint sets
of tips as represented in Figure 2b–d. Having sorted
the nodes according to time and assigned a corresponding rank to each internal node, this
statistic computes the sum of ranks in a given clade in comparison to a different clade:
represent disjoint sets
of tips as represented in Figure 2b–d. Having sorted
the nodes according to time and assigned a corresponding rank to each internal node, this
statistic computes the sum of ranks in a given clade in comparison to a different clade:
 |
(1) |
where  is an element of
 which is the
sequence of internal nodes in
which is the
sequence of internal nodes in  sorted by time (present to
past). And,
sorted by time (present to
past). And,  is an indicator
that takes the value
is an indicator
that takes the value  if
if  and is zero
otherwise. Note that
and is zero
otherwise. Note that  is asymmetric in
 and
and  . Also note that
 makes use of
 and
and  , not
, not
 and
and  , because
we are interested in the relative ordering of coalescent events among lineages of
, because
we are interested in the relative ordering of coalescent events among lineages of
 and
and  . Although the statistic
is defined for all sets disjoint sets
. Although the statistic
is defined for all sets disjoint sets  and
and
 the examples we consider below apply to
the case that the intersection of
the examples we consider below apply to
the case that the intersection of  and
and  is empty.
Only the ordering of the events matter, the absolute times are immaterial to the test.
is empty.
Only the ordering of the events matter, the absolute times are immaterial to the test.
Under a neutral coalescent process, the distribution of coalescent times in two clades
ancestral to  and
and  will depend
on the number of extant lineages through time in both clades and on the effective
population size
will depend
on the number of extant lineages through time in both clades and on the effective
population size  (Wakeley 2009). However, the distribution of the relative ordering of coalescent
times only depends on the sizes of the clades. This distribution can be computed rapidly
by Monte-Carlo simulation as shown below, provided that we know the probability that the
next coalescent will be in
(Wakeley 2009). However, the distribution of the relative ordering of coalescent
times only depends on the sizes of the clades. This distribution can be computed rapidly
by Monte-Carlo simulation as shown below, provided that we know the probability that the
next coalescent will be in  or
or  as a function of the
number of lineages ancestral to
as a function of the
number of lineages ancestral to  and
and  , given by
 and
and  . We
here provide new theoretical results on the distribution of the relative ordering of
coalescence times under the null hypothesis that both
. We
here provide new theoretical results on the distribution of the relative ordering of
coalescence times under the null hypothesis that both  and
and
 are clades within a single tree
generated by a neutral unstructured coalescent process. In the following, we consider
three different scenarios.
are clades within a single tree
generated by a neutral unstructured coalescent process. In the following, we consider
three different scenarios.
Event  . Suppose that a clade
 has an MRCA before any tip of
 shares a common ancestor with the clade
of another set of tips
shares a common ancestor with the clade
of another set of tips  , disjoint to
  . After
lineages in
. After
lineages in  have found a common ancestor, the MRCA
of
have found a common ancestor, the MRCA
of  may or may not coalesce with lineages in
 before
  has found a
common ancestor. Figure 2b and c illustrates trees
that satisfy this condition. Note that in Figure 2b,
a lineage in
has found a
common ancestor. Figure 2b and c illustrates trees
that satisfy this condition. Note that in Figure 2b,
a lineage in  coalesces with the MRCA of
 before lineages in
 find an MRCA and in Figure 2c, both
  and
and  have a
common ancestor before they find a common ancestor with one another.
have a
common ancestor before they find a common ancestor with one another.
Observing a taxonomic pattern such as shown in Figure
2b and c is a random event in a stochastic unstructured coalescent process, and
we denote this event by  (suppressing
 and
and  for convenience). Wiuf and Donnelly (1999) showed that the probability of
observing
for convenience). Wiuf and Donnelly (1999) showed that the probability of
observing  , given the state of the tree at a
particular time
, given the state of the tree at a
particular time  , only depends on the number of lineages
 and
and  ,
,
 |
(2) |
The numbers of extant lineages in  (or its complement) following each
coalescent event conditional on
(or its complement) following each
coalescent event conditional on  is a Markov chain. The transition
probabilities of this chain are exactly those needed to simulate the null distribution of
the test statistic
is a Markov chain. The transition
probabilities of this chain are exactly those needed to simulate the null distribution of
the test statistic  . The probability that the next
coalescent event is among lineages in the clade
. The probability that the next
coalescent event is among lineages in the clade  given
given
 (starting at a particular time
 ) was found by Wiuf and Donnelly (1999):
 |
(3) |
where the ancestral number of lineages of  and
and
 at time
  are
respectively
are
respectively  and
and  .
.
Event  . We further derive analogous
probabilities under slightly different conditions. Suppose we have disjoint sets of tips,
. We further derive analogous
probabilities under slightly different conditions. Suppose we have disjoint sets of tips,
 and
and  . Let all lineages in
 share a common ancestor before any share
a common ancestor with
share a common ancestor before any share
a common ancestor with  and vice versa, all
lineages in
and vice versa, all
lineages in  share a common ancestor before any
share a common ancestor with tips in
share a common ancestor before any
share a common ancestor with tips in  . Figure
2c illustrates a tree and two clades that satisfy this condition, which we denote
by
. Figure
2c illustrates a tree and two clades that satisfy this condition, which we denote
by  . As before, the number of ancestors in
 and
and  will form
a Markov chain, conditional on
will form
a Markov chain, conditional on  .
.
The probability that the next coalescent event is among lineages in the clade
 given
given  at a
particular time
at a
particular time  and the current ancestral number of
lineages of
and the current ancestral number of
lineages of  ,
,  , and
, and
 ,
,  , can be given
as:
, can be given
as:
 |
(4) |
To see this, note that without conditioning on  , the probability that
the next coalescent is among ancestral nodes in
, the probability that
the next coalescent is among ancestral nodes in  is
is
 |
This is simply the ratio of the coalescent rate in  , which is
 , to the rate in
 , which is
 . The effective
population size is homogenous through the tree by hypothesis of the statistical test, and
it cancels out in this ratio. The probability that the coalescent event would be between
the clades ancestral to
. The effective
population size is homogenous through the tree by hypothesis of the statistical test, and
it cancels out in this ratio. The probability that the coalescent event would be between
the clades ancestral to  and
and  would be
 |
Event  has probability
 , which must fulfill the
recursion
, which must fulfill the
recursion
 |
(5) |
where  . If there is exactly one
lineage in both
. If there is exactly one
lineage in both  and
and  , then
 . If there is one lineage
remaining in
. If there is one lineage
remaining in  and
and  in
in
 , then
  is
the probability that the next
is
the probability that the next  coalescent events only occur between
lineages in
coalescent events only occur between
lineages in  and do not include the single lineage
ancestral to
and do not include the single lineage
ancestral to  . The probability of the next coalescent
event being in
. The probability of the next coalescent
event being in  is the probability of not selecting
the
is the probability of not selecting
the  lineage when sampling two extant
lineages without replacement:
lineage when sampling two extant
lineages without replacement:
 |
(6) |
Similarly,  .
This recursion can be solved explicitly to give
.
This recursion can be solved explicitly to give
 |
(7) |
Now the transition probability (Equation 4) can be defined in terms of the rate of coalescence in
 and
and  and the
probability of
and the
probability of  being satisfied following the
coalescent event:
being satisfied following the
coalescent event:
 |
(8) |
Event  . Finally, we consider an event that
is the union of events
. Finally, we consider an event that
is the union of events  and
and  . We denote
 to be the event that all
 have an MRCA before sharing a common
ancestor with lineages of
have an MRCA before sharing a common
ancestor with lineages of  and/or all lineages in
 have an MRCA before sharing an ancestor
with lineages of
have an MRCA before sharing an ancestor
with lineages of  . All trees in Figure 2b–d satisfy this condition.
The probability of the event  can be defined in terms of
 and
and  given
previously:
given
previously:
 |
(9) |
with  and
and  being
sample sizes at a particular time
being
sample sizes at a particular time  , as before. The function
 satisfies the same recursion as above
(Equation 5) with slightly different
boundary conditions:
satisfies the same recursion as above
(Equation 5) with slightly different
boundary conditions:
 |
Transition probabilities can be derived as above by substituting
 for
for  in
Equation 8. The probability that the
next coalescent event is among lineages in
in
Equation 8. The probability that the
next coalescent event is among lineages in  conditional on
 is
is
 |
(10) |
where
 |
(11) |
Algorithms for Detecting Population Structure
The null distribution of the test statistic  can be computed
by Monte-Carlo simulation using Equations 3, 4, or 10 depending on the taxonomic
constraints to be conditioned on. This can be computed given any pair of disjoint clades
can be computed
by Monte-Carlo simulation using Equations 3, 4, or 10 depending on the taxonomic
constraints to be conditioned on. This can be computed given any pair of disjoint clades
 and
and  . Algorithm 1 in the
supplementary material available on Dryad at http://dx.doi.org/10.5061/dryad.w6m905qkx provides the simulation procedure
for computing the two-sided P-values of an empirical measurement
. Algorithm 1 in the
supplementary material available on Dryad at http://dx.doi.org/10.5061/dryad.w6m905qkx provides the simulation procedure
for computing the two-sided P-values of an empirical measurement
 , and we denote these
P-values
, and we denote these
P-values  . The algorithm works by
simulating many replicates of the rank-sum statistic conditional on the sets
. The algorithm works by
simulating many replicates of the rank-sum statistic conditional on the sets
 ,
,  , and the taxonomic
relationship between these clades. Furthermore, the order of sampling events and
coalescent events is part of the data within a time-scaled phylogeny. Thus, the simulation
procedure does not simulate coalescent trees per se, but rather the
number of lineages through time
, and the taxonomic
relationship between these clades. Furthermore, the order of sampling events and
coalescent events is part of the data within a time-scaled phylogeny. Thus, the simulation
procedure does not simulate coalescent trees per se, but rather the
number of lineages through time  and
and  by
proceeding from the most recent sample back to the MRCA of clades
by
proceeding from the most recent sample back to the MRCA of clades
 and
and  . Upon visiting a node
in the ordered sequence of coalescent events, the algorithm selects at random a clade
. Upon visiting a node
in the ordered sequence of coalescent events, the algorithm selects at random a clade
 or
or  for this event using
the transition probabilities from Equations 3, 4, or 10. Upon visiting a coalescent event,
for this event using
the transition probabilities from Equations 3, 4, or 10. Upon visiting a coalescent event,
 or
or  is
incremented using the observed clade membership of the sample at that time. The end result
of this simulation procedure is a large set of replicate rank-sum statistics which serves
as a null distribution for comparison with the value computed from the time-scaled
phylogeny.
is
incremented using the observed clade membership of the sample at that time. The end result
of this simulation procedure is a large set of replicate rank-sum statistics which serves
as a null distribution for comparison with the value computed from the time-scaled
phylogeny.
While in principle this test allows comparison of any pair of disjoint clades, the number
of possible comparisons is vast, and deriving a useful summary of taxonomic structure
requires additional heuristic algorithms. These algorithms are designed to stratify clades
into self-similar sets and to do so in a computationally efficient manner. Algorithm 2 in
the supplementary material available on Dryad identifies “cladistic outliers”, which are
clades that have a coalescent pattern that is different from the remainder of the tree. It
performs a single pre-order traversal of the tree and greedily adds clades to the
partition with the most outlying values of the test statistic. At each node
 visited in pre-order traversal,
Supplementary Algorithm 2 available on Dryad examines all descendants
visited in pre-order traversal,
Supplementary Algorithm 2 available on Dryad examines all descendants
 in
in  and compares
 with to
  . If no outliers are
found, the algorithm will desist from searching
. If no outliers are
found, the algorithm will desist from searching  and the set of tips
 will be added to the
partition. If at least one outlier is found in
will be added to the
partition. If at least one outlier is found in  , a search will begin
on the biggest outlier (smallest P-value computed using Supplementary
Algorithm 1 available on Dryad). The final result of this algorithm is a partition of
, a search will begin
on the biggest outlier (smallest P-value computed using Supplementary
Algorithm 1 available on Dryad). The final result of this algorithm is a partition of
 non-overlapping clades
 .
.
In practice, it is often desirable to not compare very small clades against one another or much larger clades, so additional parameters are available to desist the pre-order traversal upon reaching a clade with few descendants. It is also often of practical interest to only compare clades that overlap in time to a significant extent, so yet another parameter is available to desist from comparing a pair of clades if few lineages in the pair ever coexist at any time.
Additional algorithms are required to detect polyphyletic relationships as depicted in Figure 1 which arise if, for example, distantly related lineages colonise the same area and have similar population dynamics or if near-identical fitness-enhancing mutations occur independently on different lineages. Figure 1 depicts two distantly related clades (yellow and red) with similar population dynamics, and it is desirable to classify these as a single deme based on shared population dynamic history. Supplementary Algorithm 2 available on Dryad will partition tips of the tree into distinct clades with monophyletic or paraphyletic relationships, however, an approach based on pre-order traversal of the tree cannot on its own arrive at a polyphyletic partition of the tree. Therefore, we can implement a final hierarchical clustering step in order to group similar clades as follows:
For each distinct pair of clades
 and
and
 in partition
 , compute
  .
.Convert the P-value into a measure of distance between all clades:
 , where
 is the inverse Gaussian
cumulative distribution function (quantile function). Set
is the inverse Gaussian
cumulative distribution function (quantile function). Set  for all
  .
.Perform a conventional hierarchical clustering using a threshold distance
 for confidence
level
for confidence
level  . Various clustering algorithms
can be used at this point, and our software has implemented the “complete linkage”
algorithm (Everitt et al. 2001).
. Various clustering algorithms
can be used at this point, and our software has implemented the “complete linkage”
algorithm (Everitt et al. 2001).
Supplementary Algorithms 1 and 2 available on Dryad as well as the final hierarchical clustering step are implemented as an open source R package called treestructure available at https://github.com/emvolz-phylodynamics/treestructure. The R package supports parallelization and includes facilities for tree visualization using the ggtree package (Yu et al. 2017). The package provides convenience functions to output cluster and partition assignment for downstream statistical analysis in R.
Simulation Studies
To evaluate the potential for treestructure to detect outbreaks, we applied the new method to phylogenies estimated from newly simulated data using a structured coalescent model as well as previously published simulation data based on a discrete-event branching process (McCloskey and Poon 2017). We also simulated trees and sequence data under a Kingman coalescent process to examine the distribution of the test statistic under the null hypothesis and to assess how statistical power of the test depends on sample size and the differences between clades.
The structured coalescent simulation was based on a model with two demes: a large deme
with constant effective population size and a smaller deme which grows exponentially up to
the time of sampling. Migration occurs at a constant rate in both directions between the
growing and constant-size demes, and equal proportions of these two demes are sampled.
Coalescent simulations were implemented using the phydynR package
http://github.com/emvolz-phylodynamics/phydynR. All genealogies simulated
from this model were comprised of 1000 tips with 200 of these sampled from the growing
deme. Each of 100 simulations were based on different parameters such that there was a
spectrum of difficulty identifying population structure from the trees. The sample
proportion was chosen uniformly between 5% and 75% and, the growth rate in the growing
deme was chosen uniformly between 5% and 100% per year. Bidirectional migration between
demes was fixed at 5% per year. While most tips were sampled at a single time point, 50
tips from the constant-size deme were distributed uniformly through time in order to
facilitate molecular clock dating. Multiple sequence alignments were simulated based on
trees using seq-gen (Rambaut and Grass 1997). Each
sequence comprised 1000 nucleotides from a HKY model with a substitution rate of
 per site per year, which is a
typical value for RNA viruses. A neighbor joining tree was estimated from each alignment
and dated phylogenies estimated using the treedater R package (Volz and Frost 2017) with a strict molecular clock. The
treestructure algorithm was applied to each phylogeny using the default
per site per year, which is a
typical value for RNA viruses. A neighbor joining tree was estimated from each alignment
and dated phylogenies estimated using the treedater R package (Volz and Frost 2017) with a strict molecular clock. The
treestructure algorithm was applied to each phylogeny using the default
 threshold.
In order to test the specificity of our method, we also simulated 1000 trees under an unstructured Kingman coalescent process using the rcoal function in the ape R package version 5.2. These trees each had 50 tips and an effective population size of 0.025. Sequence data and neighbor joining trees were generated as described above. The estimate.dates command (Jones and Poon 2016) in the ape R package version 5.2 was used to estimate time-scaled trees. The treestructure algorithm was applied to both the coalescent trees and to the trees estimated based on the simulated sequences. The test statistic was tabulated for each clade size from 5 to 45 leading to approximately 10,000 observations of the test statistic in total, and about 250 observations for each clade size.
A further set of Kingman coalescent simulations was carried out to assess the statistical
power of our method. We simulated paired coalescent trees of different sizes and with
different effective population sizes, and each pair of coalescent trees was then joined at
a common root. Branch lengths at the root node were adjusted to ensure the trees were
ultrametric. One tree in each pair was small with 10, 20, or 40 tips, whereas the other
had 200 tips. The treestructure algorithm was used to compute the
normalized test statistic at the MRCA of the minority clade. The effective population size
in the minority clade was varied to provide differing levels of contrast. Note that even
if the effective population size is the same in the majority and minority clades, the
topology of the combined tree may differ substantially from the Kingman model, so that the
minority clade may be detected by the treestructure algorithm. To
effectively “hide” the structure caused by the construction of the combined trees, we can
set the effective population size of the minority clade to be  where
where
 is the number of tips in the minority
tree,
is the number of tips in the minority
tree,  is the number of tips in the majority
tree, and
is the number of tips in the majority
tree, and  is the effective size of the majority
tree. By doing so, the initial coalescent rate in both trees will be as expected under the
Kingman model for the combined tree. This can be deduced by equating the transition
probability in Equation 4 with the
probability that the next coalescent will be in the minority clade, which is the ratio of
the coalescent rate in the minority tree over the sum of coalescent rates in both the
minority and majority trees.
is the effective size of the majority
tree. By doing so, the initial coalescent rate in both trees will be as expected under the
Kingman model for the combined tree. This can be deduced by equating the transition
probability in Equation 4 with the
probability that the next coalescent will be in the minority clade, which is the ratio of
the coalescent rate in the minority tree over the sum of coalescent rates in both the
minority and majority trees.
Simulation of 100 genealogies from a discrete-event birth–death process has been
previously described (Vaughan and Drummond 2013;
McCloskey and Poon 2017). These simulations were
based on a process with heterogeneous classes of individuals with different birth rates.
With some probability, lineages migrate to a class with higher birth rates. This could
represent a generic outbreak scenario such as a set of individuals with higher risk
behavior or other exposures. In a separate set of simulations, the outbreak population
differs from the main population along multiple dimensions: the birth rate and the
sampling rate are both increased by a common factor ( ). 100 genealogies
were simulated under both scenarios and the treestructure algorithm was
applied to each. To create more challenging conditions for the method and to evaluate the
sensitivity of the method to sample coverage, we also applied the method to genealogies
based on subsampled lineages with a frequency of 25%. Complete descriptions of parameters
and simulation methods can be found in McCloskey and Poon
(2017).
). 100 genealogies
were simulated under both scenarios and the treestructure algorithm was
applied to each. To create more challenging conditions for the method and to evaluate the
sensitivity of the method to sample coverage, we also applied the method to genealogies
based on subsampled lineages with a frequency of 25%. Complete descriptions of parameters
and simulation methods can be found in McCloskey and Poon
(2017).
The performance of treestructure was evaluated using the normalized mutual information (NMI) statistic and adjusted Rand index (ARI) computed using the aricode R package (Vinh et al. 2010). Both statistics quantify the strength of association between the estimated and actual structure of the tree, with larger values corresponding to higher quality reconstructions.
Results
Simulation Studies
The treestructure algorithm achieves relatively high fidelity of
classifications in comparison to other methods in the structured coalescent simulations
which included 20% of samples from a rapidly growing outbreak. Figure 3 compares the values of NMI and ARI for three methods of
structure analysis. In these statistics, the partition of the tree computed by each method
is compared to the true membership of each sampled lineage in outbreak or in the
constant-size reservoir population. Across 100 simulations, treestructure
has mean ARI of 41% (inter-quartile range [IQR] 20–57%). The FastBAPS method (Tonkin-Hill et al. 2019) has mean ARI of 2.3% (IQR
1.2–3.3%) and the CLMP method (McCloskey and Poon
2017) has mean ARI 5.2% (IQR  1% to 7.5%). The NMI
statistic gives similar differences between the methods to ARI (Fig. 3).
1% to 7.5%). The NMI
statistic gives similar differences between the methods to ARI (Fig. 3).
Figure 3.

The normalized mutual information (NMI) and adjusted Rand index (ARI) as a function of classifications from several tree partitioning algorithms and membership of lineages in outbreaks or a constant-size reservoir. Each point corresponds to a structured coalescent simulation where 20% of tips are sampled from an exponentially growing outbreak.
The lower performance of CLMP and FastBAPS in these comparisons is largely a consequence of false positive partitioning of samples from the reservoir population, but CLMP and FastBAPS usually correctly identify a clade that closely corresponds to the outbreak. In contrast, the treestructure method seldom sub-divides clades from the reservoir. Figure 4 compares the entropy of partition assignments only within lineages sampled from the outbreak. This shows that all methods are assigning outbreak lineages to a small number of partitions and no method is clearly superior by this metric. The CLMP method has the lowest entropy (mean 0.40) but also several large outliers. treestructure has higher entropy (mean 0.57) but few outliers. FastBAPS has even higher entropy (mean 0.68) with a long tail of high values (Fig. 4).
Figure 4.
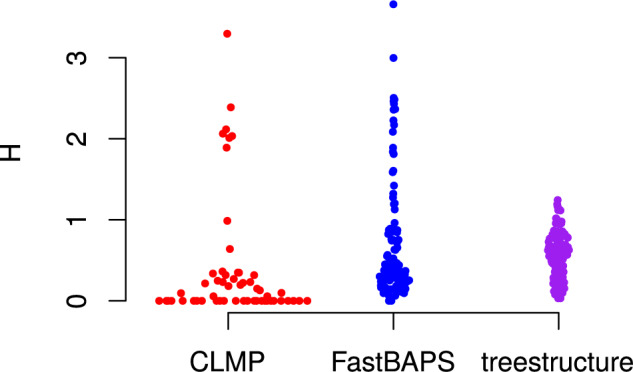
Entropy ( ) of classification from several
tree partitioning algorithms applied to the structured coalescent simulations but only
counting lineages sampled from the exponentially growing outbreak.
) of classification from several
tree partitioning algorithms applied to the structured coalescent simulations but only
counting lineages sampled from the exponentially growing outbreak.
The performance of all methods depended on the sample density and growth rate of the outbreak. Fast growing outbreaks are easier to detect by all methods but the role of sample density is more ambiguous. The Pearson correlation of ARI with growth rate is 53%, 71%, and 27%, for treestructure, FastBAPS, and CLMP, respectively. Not all methods are equally sensitive to these parameters however and FastBAPS is especially sensitive to growth and sample density. The growth rate and sample density collectively explain 41%, 60%, and 28% of variance of ARI in treestructure, FastBAPS, and CLMP, respectively.
We also performed analyses with Phydelity, a recently proposed method for transmission cluster identification (Han et al. 2019). This tended to generate a very large number of clusters, both within and outside of the outbreak demes, reflecting a different emphasis of this method on finding closely related clusters rather than addressing differences in macro-level population structure. Thus, results with Phydelity and other clustering methods were not easily comparable to treestructure.
Figure 5 shows performance of treestructure on previously published tree simulations (McCloskey and Poon 2017). These simulations differ from the structured coalescent simulations presented above because both the reservoir and outbreak demes are growing exponentially at different rates. The birth rate in the outbreak deme is 5-fold the birth rate in the reservoir, but in one set of simulations, both the birth rate and sampling rate in the outbreak was also increased 5-fold. In these simulations, the performance of treestructure (mean ARI 53%) is slightly lower than the CLMP method (McCloskey and Poon 2017) (mean ARI 72%) when only the birth rate differs in the outbreak deme. However, treestructure maintains good performance when death and sampling rates also differ. In that case, treestructure has mean ARI 42% and CLMP has mean ARI 0%. The results are similar when using NMI instead of ARI (Supplementary Fig. S1 available on Dryad). The difficulty of detecting outbreaks with different sampling patterns was previously highlighted as a challenge for CLMP (McCloskey and Poon 2017).
Figure 5.

The adjusted Rand index for 100 previously published simulations (McCloskey and Poon 2017). This describes accuracy of classification of tips into outbreaks using the treestructure method and CLMP. Results on the left were based on simulations where both transmission and sampling rates varied in the outbreak cluster, whereas simulations on the right only allowed transmission rates to vary.
Simulations of unstructured Kingman coalescent trees shows that the distribution of the standardized test statistic is approximately normal (Supplementary Fig. S2 available on Dryad). The quality of the normal approximation depends on the extent of phylogenetic error. In estimated phylogenies based on simulated sequence data, there is substantial skew in the test statistic which is most pronounced for larger clades that have a more distant MRCA (Supplementary Fig. S3 available on Dryad). The extent of error due to phylogeny estimation will depend on many variables as well as on the choice of methodology when estimating time-scaled trees; in this case, effective population size and substitution rates were chosen to yield a data set with comparable diversity to a real HIV sequence data set, and there is considerable error in the estimated date of the time of most recent common ancestor and tree topology which was estimated using the neighbor joining method. In the absence of phylogenetic error, the false positive rate based on a 95% confidence threshold was 5.1%. With phylogenetic error, the false positive rate increased to 12.2%.
Analysis of trees simulated with predefined structure showed that statistical power increases as expected with sampling density and effective population size contrast between the two clades. Supplementary Figure S4 available on Dryad shows the normalized test statistic for various sample sizes and contrasts of effective population size in two clades descended from the root of a tree. The statistic significantly deviates from zero with increasing sample sizes and with increasing differences in effective population sizes. For example, using a 95% confidence level, we find a significant difference between clades in 85% of simulations sampling 40 tips from the minority clade and with a 2-fold difference in the rescaled effective population sizes. This decreases to 40% of simulations if sampling only 10 tips, but increases to 100% if there is a 5-fold difference in the scaled effective population sizes.
Clonal Expansion of Drug-Resistant Neisseria gonorrhoeae
We examined the role of evolution of antimicrobial resistance in shaping the phylogenetic
structure of Neisseria gonorrhoeae using 1102 previously described whole
genome sequences (Grad et al. 2016). These isolates
were collected from multiple sites in the United States between 2000 and 2013 and featured
clonal expansion of lineages resistant to different classes of antibiotics. We estimated a
maximum likelihood tree using PhyML (Guindon et al. 2010) and corrected for the distorting effect of recombination
using ClonalFrameML (Didelot and Wilson
2015). We estimated a rooted time-scaled phylogeny using
treedater (Volz and Frost 2017).
A relaxed clock model was inferred, with a mean rate of  substitutions per site
per year. BactDating (Didelot et al.
2018) was also applied for the same purpose and found to give very similar
estimates for the clock rate and dating of clades.
substitutions per site
per year. BactDating (Didelot et al.
2018) was also applied for the same purpose and found to give very similar
estimates for the clock rate and dating of clades.
We focus on the origin and expansion of two clades which independently developed
resistance to cefixime (CFX) by acquiring the mosaic penA XXXIV allele
(Grad et al. 2016). Note, however, that the level
of susceptibility to CFX varies, particularly in the largest of these two clades. In one
lineage within this clade, the mosaic penA XXXIV allele was replaced by
recombination with an allele associated with susceptibility. Other isolates within this
clade gained mutations that further modified the extent of resistance. The largest of the
two clades emerged on a genomic background that was already resistant to ciprofloxacin
(CIP), so that it has reduced susceptibility to both CIP and CFX. The smallest of the two
clades is resistant to CFX but not CIP. To further analyze the relationship between CFX
resistance and N. gonorrhoeae population structure, we focused our
analysis on a tree with just 576 tips, representing the genomes from these two CFX
resistant clades as well as genomes from the two clades that are most closely related to
the two CFX resistant clades. The output of treestructure is shown in
Figure 6, using unique colors to highlight each of
the 11 clusters that were identified with  . The clusters
reported by treestructure are highly correlated with CFX resistance.
Among all distinct pairs of sampled isolates, 84% share the same resistance profile and
cluster membership.
. The clusters
reported by treestructure are highly correlated with CFX resistance.
Among all distinct pairs of sampled isolates, 84% share the same resistance profile and
cluster membership.
Figure 6.
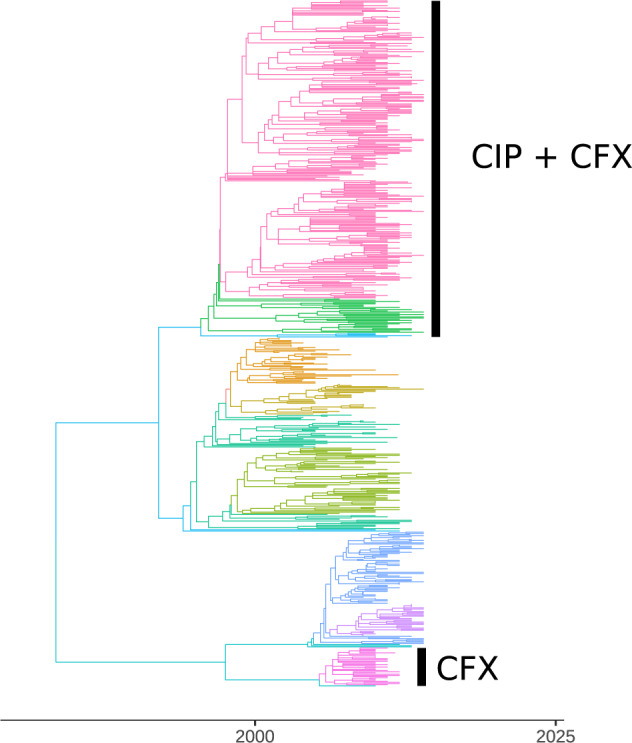
A time-scaled phylogeny based on 576 whole genomes of Neisseria gonorrhoeae, comprising two clades with reduced susceptibility to cefixime (CFX) and their two sister clades. The top clade also has resistance to ciprofloxacin (CIP). Different colors on the tree represent the partition detected using the treestructure algorithm.
We compared treestructure with a different method for detecting community structure, FastBAPS (Tonkin-Hill et al. 2019), since BAPS models are often applied to bacterial pathogens. We applied FastBAPS using the same time-scaled phylogeny described previously and using a trimmed sequence alignment consisting of 38,830 polymorphic sites and removing sites with many gaps. This produced a similar partition of the tree (Supplementary Fig. S5 available on Dryad) with a few differences. The FastBAPS clusters overlap exactly with the clade featuring dual resistance (CIP and CFX), whereas treestructure classified a small number of deep-splitting lineages into a different cluster. Note, however, that this behavior is not necessarily problematic and may represent a progressive increase in fitness following the acquisition of resistance through the evolution of compensatory mutations (Didelot et al. 2016). Indeed, we found a significant difference in the resistance profile of the two treestructure clusters within the clade resistant to both CIP and CFX: the smallest cluster had a greater frequency of high resistance to CIP compared to the largest cluster (100% and 81%, respectively).
FastBAPS did not identify the smaller clade with resistance to CFX and not CIP and instead grouped that clade with its sensitive sister clade. In general, treestructure found many more clusters within the two sister clades and FastBAPS tended to group these together. We also applied the much more computationally intensive RhierBAPS method (Tonkin-Hill et al. 2018), and obtained almost identical results to FastBAPS. Overall, BAPS methods appear to give more weight than treestructure to long internal branches when identifying clusters.
Epidemiological Transmission Patterns of HIV-1
We reanalyzed a time-scaled phylogeny reconstructed from 2068 partial
pol HIV-1 subtype B sequences collected from Tennessee between 2001 and
2015 (Dennis et al. 2018). Each lineage within this
phylogeny corresponds to a single HIV patient sampled at a single time point, and various
clinical and demographic covariate data concerning these patients can be associated with
each lineage. In the original study, these sequence data were used to show high rates of
transmission among young (age  years old) men who have sex with
men (MSM) (Dennis et al. 2018). Clustering by
threshold genetic distance is often used in HIV epidemiology (Dennis et al. 2014) and indicated that young white MSM had the highest
odds of clustering.
years old) men who have sex with
men (MSM) (Dennis et al. 2018). Clustering by
threshold genetic distance is often used in HIV epidemiology (Dennis et al. 2014) and indicated that young white MSM had the highest
odds of clustering.
We applied the treestructure algorithm with default settings to the time-scaled tree which yielded ten partitions with sizes ranging from 58 to 398. The tree and partitions are shown in Figure 7 where partitions are labeled according to the median year of birth among patients in each partition. Many of these partitions were polyphyletic, suggesting possible multiple importations of lineages to specific risk groups. We then compared the estimated partition of the tree with patient covariates. A particular partition stands out along multiple dimensions: it is the smallest (size 58), polyphyletic, arose in the recent past and is characterized by very young MSM. The median year of birth in this partition is 1987, in stark contrast to the rest of the sample with year of birth in the 1970s. Clades within this young partition are also nested paraphyletically under other relatively young partitions (Fig. 7).
Figure 7.
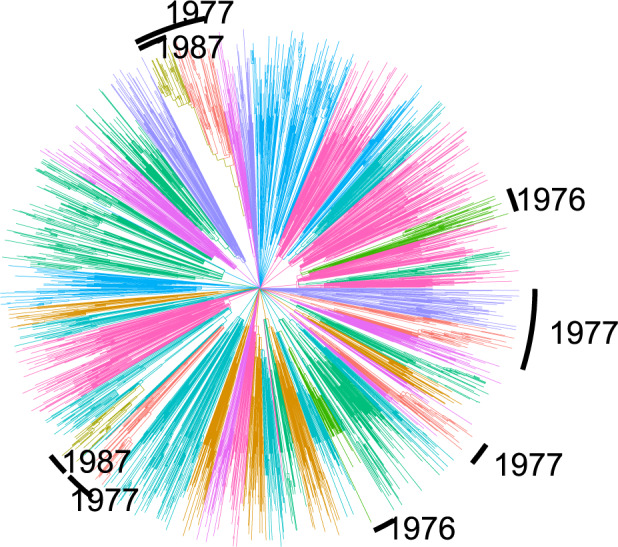
A time-scaled phylogeny estimated from HIV-1 pol sequences in Tennessee (Dennis et al. 2018). The colors correspond to the 10 partitions identified using the treestructure algorithm. Several partitions are annotated with the median year of birth of HIV patients from whom sequences were sampled. Unannotated partitions had years of birth 1969–1972.
We did not find a significant association between the tree partition and residential
postal codes (Tukey analysis of variance,  ). This is in
agreement with the original study which found minimal impact of geography on genetic
clustering in this sample; however, this is largely a consequence of the highly
concentrated nature of the sample around Nashville. The ethnicity of patients (black,
white, and other) was strongly associated with the estimated partition. Black MSM were
strongly concentrated in the 1987 partition in particular (83% in contrast to 26–38% in
all other partitions). The odds ratio of black ethnicity given membership in the 1987
partition was 9.7 (95% confidence interval 5.2–19.8).
). This is in
agreement with the original study which found minimal impact of geography on genetic
clustering in this sample; however, this is largely a consequence of the highly
concentrated nature of the sample around Nashville. The ethnicity of patients (black,
white, and other) was strongly associated with the estimated partition. Black MSM were
strongly concentrated in the 1987 partition in particular (83% in contrast to 26–38% in
all other partitions). The odds ratio of black ethnicity given membership in the 1987
partition was 9.7 (95% confidence interval 5.2–19.8).
Finally, we performed a phylodynamic analysis to investigate if the partition structure
supported the previously published findings that young MSM were transmitting at a higher
rate (Dennis et al. 2018). To estimate the temporal
variations in the effective population size, we used the nonparametric
skygrowth R package (Volz and Didelot
2018). We estimated  for each partition individually
using a range of precision parameters which control the smoothness
(
for each partition individually
using a range of precision parameters which control the smoothness
( ) of the estimated trajectories since
we lack a priori information about volatility of these trajectories.
Figure 8 shows
) of the estimated trajectories since
we lack a priori information about volatility of these trajectories.
Figure 8 shows  for each partition
with
for each partition
with  and Supplementary Figures S6 and
S7 available on Dryad show results using different values of
and Supplementary Figures S6 and
S7 available on Dryad show results using different values of  . The 1987
partition again stands out as the only group which shows evidence of recent and rapid
population growth. Less dramatic recent periods of growth are also noticeable for other
partitions with young patients. The current exponential growth in the 1987 partition is
not consistent across all analyses, but when
. The 1987
partition again stands out as the only group which shows evidence of recent and rapid
population growth. Less dramatic recent periods of growth are also noticeable for other
partitions with young patients. The current exponential growth in the 1987 partition is
not consistent across all analyses, but when  we find
 drops precipitously in 2014–2015
(Supplementary Fig. S6 available on Dryad). However, this could also be an artifact of
nonrandom sampling and inclusion of transmission pairs within the sample.
drops precipitously in 2014–2015
(Supplementary Fig. S6 available on Dryad). However, this could also be an artifact of
nonrandom sampling and inclusion of transmission pairs within the sample.
Figure 8.

Estimated effective population size through time for each partition in the Tennessee
HIV-1 phylogeny. Each panel is annotated with the median year of birth among HIV
patients in each partition.  was estimated using the
skygrowth method (Volz and Didelot
2018) with precision parameter
was estimated using the
skygrowth method (Volz and Didelot
2018) with precision parameter  .
.
This analysis supports the hypothesis that there has been a recent and rapid increase in HIV transmissions among young MSM in Tennessee and in particular among young black MSM. This interpretation is mostly in agreement with the original study (Dennis et al. 2018), but we find that black MSM are a group at greater risk than young white MSM.
Discussion
Contrasting the distribution of ordering of nodes provides a natural criterion for distinguishing clades within a time-scaled phylogeny which are shaped by different evolutionary or demographic processes. The nonparametric nature of this classification method imposes minimal assumptions on the mechanisms that generate phylogenetic patterns. Thus, we have found this method maintains good performance over a diverse range of situations where phylogenetic structure is produced, including differential transmission rates, epidemiological outbreaks, evolution of beneficial mutations, and differential sampling patterns. Our work is related to the research on species delimitation methods (see for example Zhang et al. 2013) although targeted at within-species variation and is also related to recent work on methods for detecting codiversification of species (Oaks et al. 2019). This method appears relatively robust compared to other methods against false positive identification of phylogenetic structure but nevertheless has good sensitivity for detecting structure in most situations.
There are many immediate applications of this method in the area of pathogen evolution where time-scaled phylogenetics is increasingly used in epidemiological investigations (Biek et al. 2015). We have demonstrated the role of selection in shaping phylogenetic structure of N. gonorrhoeae, and our method clearly identifies clades which expanded in the recent past due to acquisition of antimicrobial resistance. We have demonstrated the role of human demography and transmission patterns in shaping the evolution of HIV-1, and our method has shown distinct outbreaks of HIV-1 in specific groups defined by age, race, and behavior. Furthermore, we have shown how clades detected by this method can be analyzed using phylodynamic methods that can yield additional insights into recent outbreaks or the mechanisms which generated phylogenetic structure. For example, we have applied nonparametric methods to estimate the effective population size through time in HIV outbreaks detected using treestructure which highlighted particular groups that appear to be at higher risk of transmission. Such analyses would be more problematic using other partitioning or clustering algorithms because phylogenetic clusters can appear by chance in homogeneous populations of neutrally evolving pathogens, and this can give the false appearance of recent growth (Dearlove et al. 2017). This application of phylodynamics analysis methods is possible because the statistical test used in treestructure provides theoretical justification for treating each partition as a separate unstructured population.
Applications of the treestructure algorithms are scalable to relatively large phylogenies. The main algorithms require only a single pre-order traversal of the tree and all of the computations presented here required less than one minute to run. The method is based on a time-scaled phylogeny, and the computational burden of this preliminary step is typically higher than that of running treestructure, even though significant progress has been made recently in this area (Volz and Frost 2017; Didelot et al. 2018; Sagulenko et al. 2018; Tamura et al. 2018; Miura et al. 2020). Future developments of treestructure and other methods post-processing time-scaled phylogenies (Didelot et al. 2017, Volz and Didelot 2018) should address the uncertainty in the input phylogeny, for example, by accounting for bootstrap or Bayesian support values for phylogenetic splits, or by summarizing results from multiple trees.
Supplementary Material
Data available from the Dryad Digital Repository: http://dx.doi.org/10.5061/dryad.w6m905qkx.
Funding
Research reported in this publication was supported by the National Institute of Allergy and Infectious Diseases of the National Institutes of Health under Award Number R01-AI135970 (to E.M.V., A.M.D., S.D.W.F.). E.M.V. and X.D. acknowledge funding from the UK Medical Research Council (MR/R015600/1) and the National Institute for Health Research (NIHR) Health Protection Research Unit in Modelling Methodology (HPRU-2012-10080). S.D.W.F. was also supported in part by the Alan Turing Institute via an Engineering and Physical Sciences Research Council Grant (EP/510129/1).
References
- Beugin M.P., Gayet T., Pontier D., Devillard S., Jombart T. 2018. A fast likelihood solution to the genetic clustering problem. Methods Ecol. Evol. 9:1006–1016. [DOI] [PMC free article] [PubMed] [Google Scholar]
- Biek R., Pybus O.G., Lloyd-Smith J.O., Didelot X. 2015. Measurably evolving pathogens in the genomic era. Trends Ecol. Evol. 30:306–313. [DOI] [PMC free article] [PubMed] [Google Scholar]
- Bouckaert R., Heled J., Kühnert D., Vaughan T., Wu C.-H., Xie D., Suchard M.A., Rambaut A., Drummond A.J. 2014. Beast 2: a software platform for Bayesian evolutionary analysis. PLoS Comput. Biol. 10:e1003537. [DOI] [PMC free article] [PubMed] [Google Scholar]
- De Maio N., Worby C.J., Wilson D.J., Stoesser N. 2018. Bayesian reconstruction of transmission within outbreaks using genomic variants. PLoS Comput. Biol. 14:e1006117. [DOI] [PMC free article] [PubMed] [Google Scholar]
- Dearlove B.L., Frost S.D.W. 2015. Measuring asymmetry in time-stamped phylogenies. PLoS Comput. Biol. 11:e1004312. [DOI] [PMC free article] [PubMed] [Google Scholar]
- Dearlove B.L., Xiang F., Frost S.D. 2017. Biased phylodynamic inferences from analysing clusters of viral sequences. Virus Evol. 3:vex020. [DOI] [PMC free article] [PubMed] [Google Scholar]
- Dennis A.M., Herbeck J.T., Brown A.L., Kellam P., de Oliveira T., Pillay D., Fraser C., Cohen M.S. 2014. Phylogenetic studies of transmission dynamics in generalized HIV epidemics: an essential tool where the burden is greatest? J. Acquir. Immune Defic. Syndr. 67:181–195. [DOI] [PMC free article] [PubMed] [Google Scholar]
- Dennis A.M., Volz E., Frost S.D., Hossain M., Poon A.F., Rebeiro P.F., Vermund S.H., Sterling T.R., Kalish M.L. 2018. HIV-1 transmission clustering and phylodynamics highlight the important role of young men who have sex with men. AIDS Res. Hum. Retroviruses. 34:879–888. [DOI] [PMC free article] [PubMed] [Google Scholar]
- Didelot X., Croucher N.J., Bentley S.D., Harris S.R., Wilson D.J. 2018. Bayesian inference of ancestral dates on bacterial phylogenetic trees. Nucleic Acids Res. 46:e134. [DOI] [PMC free article] [PubMed] [Google Scholar]
- Didelot X., Fraser C., Gardy J., Colijn C. 2017. Genomic infectious disease epidemiology in partially sampled and ongoing outbreaks. Mol. Biol. Evol. 34:997–1007. [DOI] [PMC free article] [PubMed] [Google Scholar]
- Didelot X., Walker A.S., Peto T.E., Crook D.W., Wilson D.J. 2016. Within-host evolution of bacterial pathogens. Nat. Rev. Microbiol. 14:150–162. [DOI] [PMC free article] [PubMed] [Google Scholar]
- Didelot X., Wilson D.J. 2015. ClonalFrameML: Efficient inference of recombination in whole bacterial genomes. PLoS Comput. Biol. 11:e1004041. [DOI] [PMC free article] [PubMed] [Google Scholar]
- Dudas G., Carvalho L.M., Bedford T., Tatem A.J., Baele G., Faria N.R., Park D.J., Ladner J.T., Arias A., Asogun D., Bielejec F., Caddy S.L., Cotten M., D’Ambrozio J., Dellicour S., Di Caro A., Diclaro J.W., Duraffour S., Elmore M.J., Fakoli L.S., Faye O., Gilbert M.L., Gevao S.M., Gire S., Gladden-Young A., Gnirke A., Goba A., Grant D.S., Haagmans B.L., Hiscox J.A., Jah U., Kugelman J.R., Liu D., Lu J., Malboeuf C.M., Mate S., Matthews D.A., Matranga C.B., Meredith L.W., Qu J., Quick J., Pas S.D., Phan M.V.T., Pollakis G., Reusken C.B., Sanchez-Lockhart M., Schaffner S.F., Schieffelin J.S., Sealfon R.S., Simon-Loriere E., Smits S.L., Stoecker K., Thorne L., Tobin E.A., Vandi M.A., Watson S.J., West K., Whitmer S., Wiley M.R., Winnicki S.M., Wohl S., Wölfel R., Yozwiak N.L., Andersen K.G., Blyden S.O., Bolay F., Carroll M.W., Dahn B., Diallo B., Formenty P., Fraser C., Gao G.F., Garry R.F., Goodfellow I., Günther S., Happi C.T., Holmes E.C., Kargbo B., Keïta S., Kellam P., Koopmans M.P.G., Kuhn J.H., Loman N.J., Magassouba N., Naidoo D., Nichol S.T., Nyenswah T., Palacios G., Pybus O.G., Sabeti P.C., Sall A., Ströher U., Wurie I., Suchard M.A., Lemey P., Rambaut A. 2017. Virus genomes reveal factors that spread and sustained the ebola epidemic. Nature. 544:309–315. [DOI] [PMC free article] [PubMed] [Google Scholar]
- Everitt B., Landau S., Leese M. 2001. Cluster analysis. New York: Wiley. [Google Scholar]
- Eyre D.W., Golubchik T., Gordon N.C., Bowden R., Piazza P., Batty E.M., Ip C.L.C., Wilson D.J., Didelot X., O’Connor L., Lay R., Buck D., Kearns A.M., Shaw A., Paul J., Wilcox M.H., Donnelly P.J., Peto T.E.A., Walker A.S., Crook D.W. 2012. A pilot study of rapid benchtop sequencing of Staphylococcus aureus and Clostridium difficile for outbreak detection and surveillance. BMJ Open. 2:e001124. [DOI] [PMC free article] [PubMed] [Google Scholar]
- Grad Y.H., Harris S.R., Kirkcaldy R.D., Green A.G., Marks D.S., Bentley S.D., Trees D., Lipsitch M. 2016. Genomic epidemiology of gonococcal resistance to extended-spectrum cephalosporins, macrolides, and fluoroquinolones in the United States, 2000–2013. J. Infect. Dis. 214:1579–1587. [DOI] [PMC free article] [PubMed] [Google Scholar]
- Guindon S., Dufayard J.-F., Lefort V., Anisimova M., Hordijk W., Gascuel O. 2010. New algorithms and methods to estimate maximum-likelihood phylogenies: assessing the performance of PhyML 3.0. Syst. Biol. 59:307–21. [DOI] [PubMed] [Google Scholar]
- Han A.X., Parker E., Maurer-Stroh S., Russell C.A. 2019. Inferring putative transmission clusters with Phydelity. Virus Evol. 5:vez039. [DOI] [PMC free article] [PubMed] [Google Scholar]
- Hartl D.L., Clark A.G., Clark A.G. 1997. Principles of population genetics, Vol. 116. Sunderland, MA: Sinauer Associates. [Google Scholar]
- Höhna S., Landis M.J., Heath T.A., Boussau B., Lartillot N., Moore B.R., Huelsenbeck J.P., Ronquist F. 2016. Revbayes: Bayesian phylogenetic inference using graphical models and an interactive model-specification language. Syst. Biol. 65:726–736. [DOI] [PMC free article] [PubMed] [Google Scholar]
- Jones B.R., Poon A.F. 2016. node.dating: dating ancestors in phylogenetic trees in R. Bioinformatics. 33:932–934. [DOI] [PMC free article] [PubMed] [Google Scholar]
- Klingen T.R., Reimering S., Guzmán C.A., McHardy A.C. 2018. In silico vaccine strain prediction for human influenza viruses. Trends Microbiol. 26:119–131. [DOI] [PubMed] [Google Scholar]
- Lam T. T.-Y., Zhou B., Wang J., Chai Y., Shen Y., Chen X., Ma C., Hong W., Chen Y., Zhang Y., Duan L., Chen P., Jiang J., Zhang Y., Li L., Poon L.L.M., Webby R.J., Smith D.K., Leung G.M., Peiris J.S.M., Holmes E.C., Guan Y., Zhu H. 2015. Dissemination, divergence and establishment of H7N9 influenza viruses in china. Nature. 522:102–105. [DOI] [PubMed] [Google Scholar]
- Ledda A., Price J.R., Cole K., Llewelyn M.J., Kearns A.M., Crook D.W., Paul J., Didelot X. 2017. Re-emergence of methicillin susceptibility in a resistant lineage of Staphylococcus aureus. J. Antimicrob. Chemother. 72:1285–1288. [DOI] [PMC free article] [PubMed] [Google Scholar]
- McCloskey R.M., Poon A.F. 2017. A model-based clustering method to detect infectious disease transmission outbreaks from sequence variation. PLoS Comput. Biol. 13:e1005868. [DOI] [PMC free article] [PubMed] [Google Scholar]
- Miller R., Price J., Batty E., Didelot X., Wyllie D., Golubchik T., Crook D.W., Paul J., Peto T.E.A., Wilson D.J., Cule M., Ip C., Day N., Moore C., Bowden R., Llewelyn M. 2014. Healthcare-associated outbreak of meticillin-resistant Staphylococcus aureus bacteraemia: role of a cryptic variant of an epidemic clone. J. Hosp. Infect. 86:83–89. [DOI] [PMC free article] [PubMed] [Google Scholar]
- Miura S., Tamura K., Tao Q., Huuki L.A., Kosakovsky Pond S.L., Priest J., Deng J., Kumar S. 2020. A new method for inferring timetrees from temporally sampled molecular sequences. PLoS Comput. Biol. 16:e1007046. [DOI] [PMC free article] [PubMed] [Google Scholar]
- Mostowy R., Croucher N.J., Andam C.P., Corander J., Hanage W.P., Marttinen P. 2017. Efficient inference of recent and ancestral recombination within bacterial populations. Mol. Biol. Evol. 34:1167–1182. [DOI] [PMC free article] [PubMed] [Google Scholar]
- Notohara M. 1990. The coalescent and the genealogical process in geographically structured population. J. Math. Biol. 29:59–75. [DOI] [PubMed] [Google Scholar]
- Oaks J.R., LBahy N., Cobb K.A. 2019. Insights from a general, full-likelihood Bayesian approach to inferring shared evolutionary events from genomic data: inferring shared demographic events is challenging. bioRxiv Page 679878. [DOI] [PubMed] [Google Scholar]
- Rambaut A., Grass N.C. 1997. Seq-Gen: an application for the Monte Carlo simulation of DNA sequence evolution along phylogenetic trees. Bioinformatics. 13:235–238. [DOI] [PubMed] [Google Scholar]
- Sagulenko P., Puller V., Neher. 2018. Treetime: maximum-likelihood phylodynamic analysis. Virus Evol. 4:vex042. [DOI] [PMC free article] [PubMed] [Google Scholar]
- Suchard M.A., Lemey P., Baele G., Ayres D.L., Drummond A.J., Rambaut A. 2018. Bayesian phylogenetic and phylodynamic data integration using beast 1.10. Virus Evol. 4:vey016. [DOI] [PMC free article] [PubMed] [Google Scholar]
- Tamura K., Tao Q., Kumar S. 2018. Theoretical foundation of the RelTime method for estimating divergence times from variable evolutionary rates. Mol. Biol. Evol. 35:1770–1782. [DOI] [PMC free article] [PubMed] [Google Scholar]
- To T.-H., Jung M., Lycett S., Gascuel O. 2016. Fast dating using least-squares criteria and algorithms. Syst. Biol. 65:82–97. [DOI] [PMC free article] [PubMed] [Google Scholar]
- Tonkin-Hill G., Lees J.A., Bentley S.D., Frost S.D.W., Corander J. 2018. RhierBAPS: An R implementation of the population clustering algorithm hierBAPS. Wellcome Open Res. 3:93. [DOI] [PMC free article] [PubMed] [Google Scholar]
- Tonkin-Hill G., Lees J.A., Bentley S.D., Frost S.D.W., Corander J. 2019. Fast hierarchical Bayesian analysis of population structure, Nucleic Acids Res. 47:5539–5549. [DOI] [PMC free article] [PubMed] [Google Scholar]
- Vaughan T.G., Drummond A.J. 2013. A stochastic simulator of birth–death master equations with application to phylodynamics. Mol. Biol. Evol. 30:1480–1493. [DOI] [PMC free article] [PubMed] [Google Scholar]
- Vinh N.X., Epps J., Bailey J. 2010. Information theoretic measures for clusterings comparison: variants, properties, normalization and correction for chance. J. Mach. Learn. Res. 11:2837–2854. [Google Scholar]
- Volz E.M., Didelot X. 2018. Modeling the growth and decline of pathogen effective population size provides insight into epidemic dynamics and drivers of antimicrobial resistance. Syst. Biol. 67:719–728. [DOI] [PMC free article] [PubMed] [Google Scholar]
- Volz E.M., Frost S.D.W. 2017. Scalable relaxed clock phylogenetic dating. Virus Evol. 3:vex025. [Google Scholar]
- Wakeley J. 2009. Coalescent theory: an introduction. Greenwood Village: Roberts & Company Publishers. [Google Scholar]
- Whittles L.K., White P.J., Didelot X. 2017. Estimating the fitness benefit and cost of cefixime resistance in Neisseria gonorrhoeae to inform prescription policy: a modelling study. PLoS Med. 14:e1002416. [DOI] [PMC free article] [PubMed] [Google Scholar]
- Wiuf C. Donnelly P. 1999. Conditional genealogies and the age of a neutral mutant. Theor. Popul. Biol. 56:183–201. [DOI] [PubMed] [Google Scholar]
- Yu G., Smith D.K., Zhu H., Guan Y., Lam T.T.-Y. 2017. ggtree: an r package for visualization and annotation of phylogenetic trees with their covariates and other associated data. Methods Ecol. Evol. 8:28–36. [Google Scholar]
- Zhang J., Kapli P., Pavlidis P., Stamatakis A. 2013. A general species delimitation method with applications to phylogenetic placements. Bioinformatics. 29:2869–2876. [DOI] [PMC free article] [PubMed] [Google Scholar]