

Abstract
Objective:
To report HIV incidence and associated factors among young men who have sex with men (YMSM) and transgender women (TW).
Methods:
Data were collected February 2015 to July 2018 in the RADAR longitudinal cohort study of YMSM/TW aged 16-29 years (N=1093). Data included tests for HIV and rectal STIs and self-reported sexual behaviors and networks characteristics.
Results:
HIV incidence rates were 2.91 per 100 person years (44 seroconversions among 1,513 person years). Incidence was significantly higher in Black participants than white (IRR: 8.81; 95% CI: 2.72 – 45.26) and Latinx (IRR: 3.15; 1.49 – 7.28) participants, but no significant differences by gender identity were found. Testing positive for rectal STIs (HR: 2.50; 95% CI: 1.27-4.92) and sex with a partner from a high HIV incidence community area (HR: 2.46; 95% CI: 1.19-5.07) were associated with higher incidence.
Conclusions:
HIV incidence was very high and Black YMSM/TW experienced higher HIV incidence attributable to partner race and geographic residence. Rectal STIs were associated with increased HIV incidence.
Keywords: HIV incidence, gay and bisexual men, young MSM, transgender women, adolescent
INTRODUCTION
Compared to all other age and risk groups, adolescent and young adult men who have sex with men (hereafter collectively referred to as YMSM) represent the largest numbers of new HIV diagnoses in the U.S.1 Diagnoses are a trailing indicator of the HIV epidemic because they only represent information from individuals at the time they opt to receive HIV testing; among YMSM it is estimated to take 3 years from infection to diagnosis.2 The precision of case report data is further limited among adolescent MSM where only approximately one in four have ever had an HIV test.3 HIV incidence data are critical for monitoring the epidemic and response to prevention initiatives, but little HIV incidence data are available among YMSM—particularly among adolescents under 18 years.4 As such, additional data are needed to complement national estimates of HIV incidence derived from case reports with clinical biomarkers and that group together 13-24 year old MSM.5
Longitudinal cohort studies using population representative samples are the gold standard for estimating HIV incidence, but are expensive, require a long period of data collection, and have methodological challenges (e.g., retention, sampling from “hidden” populations). Despite these challenges, a small number of longitudinal cohort studies have estimated incidence among YMSM. In the only cohort study to include MSM under age 18, HIV incidence was 4.11/100PY in 450 YMSM in Chicago ages 16-20 years at enrollment and followed for up to 2 years (632 PY).6 In New York City, HIV incidence was reported at 2.85 per 100 person-years (PY) in a sample of 594 YMSM aged 18-19 years at enrollment and followed for up to 36 months (1,508 PY)7 Other longitudinal studies with broader age range have reported sub-group analyses for YMSM: in Atlanta, the incidence rates for 18-24 MSM was 10.9/100PY8 for blacks and 0.9/100PY for whites, and two multi-city intervention trials reported incidence among 18-30 year old MSM of 3.7/100PYs in a predominately white sample9 and 5.9/100PY in a black sample.10
While incidence rates have varied across studies, a highly consistent pattern has been a significantly higher HIV incidence among black versus white YMSM.4,6–8 Explanations for these disparities have primarily been derived from data from older MSM, but emerging data supports the explanation that HIV racial disparities among YMSM are not attributable to racial differences in HIV risk behaviors.4 Instead, partner, network, and structural characteristics appear to drive these disparities.11,12 For example, one prior study of YMSM showed no racial differences in rates of condomless sex or sex partner number, but instead found substantial homophily in race of sexual partners (i.e., among black participants 82% of sex partners were black) and differences in rates of partners from high HIV prevalence neighborhoods.12 Studies of adult MSM have used sex with black partners as a proxy for connections to black sexual networks and found it to be a strong explanatory factor for HIV incidence.8
In addition to a need for a richer understanding of racial disparities, other factors associated with HIV incidence among adult MSM remain largely unexplored for YMSM (e.g., sexual abuse, methamphetamine use). This is particularly the case for MSM under 18 years of age as only one longitudinal study has reported predictors of HIV incidence with this group.6 In terms of HIV incidence in transgender women (TW), two systematic reviews13,14 found only 3 U.S. studies. The most recent of the studies reported an incidence of 2.8/100PY among 230 TW (316 PY) aged 19-59 years (mean = 34).15 To our knowledge there has been no published reported of HIV incidence among young TW in the U.S.
In this paper, we report data on HIV incidence and associated risk factors from a large cohort of diverse YMSM and TW ages 16-29 years at enrollment. We provide estimates of HIV incidence overall and by race/ethnicity and gender subgroups and report effects of key HIV risk factors derived from the published literature,16 including engagement in condomless anal sex (CAS), STIs, sexual abuse, and methamphetamine use. We build on prior literature that has identified drivers of racial disparities in HIV risk12,16 by examining the impact of partner race and geographic residence in a high HIV incidence community area.
We also have two supplemental methodological aims. Laboratory biomarkers have been proposed to estimate incidence from cross-sectional data (i.e., recent infection testing algorithm [RITA]), but each approach has challenges in terms of biases, precision, and validation.17 To help inform the validity of this approach, we compare longitudinal incidence estimate against RITA estimates. To help inform the use of 4th generation point of care testing against laboratory testing we report supplemental analyses on sensitivity, specificity, and accuracy (see Appendix A).
METHODS
Data were collected between February 2015 and July 2018 as part of RADAR, a longitudinal cohort study of YMSM/TW living in the Chicago metropolitan area. The primary objective of this cohort study is to apply a multilevel perspective to a syndemic of health issues associated with HIV among diverse YMSM. A multiple cohort, accelerated longitudinal design was utilized by initially enrolling two existing cohorts of SGMs and then expanded with an additional recruitment group through the use of snowball sampling methods. Further information on study recruitment has been previously published.11 At the time of enrollment into their original respective cohorts, all participants were aged 16-20 years, assigned male at birth, spoke English, and had a sexual encounter with a man in the previous year or identified as gay, bisexual or transgender. Participants were followed for 4.5 years with study visits occurring every six months. Data were taken from the first seven visits; retention rates at closed visits (2-5) were 89%, 84%, 83% and 81% respectively. All procedures were approved by the Institutional Review Board.
Measures
Demographics.
Participants reporting a Hispanic/Latinx ethnicity were coded as such, regardless of their racial identity. For analytic purposes, sparse response categories for racial/ethnic identity (e.g., Asian, American Indian, Pacific Islander, multi-racial), gender identity (e.g., gender non-conforming, qenderqueer, non-binary), and sexual orientation (e.g., pansexual, questioning, heterosexual) were combined to form an “Other” category.
Unwanted Adolescent Sexual Experience.
At baseline, three items assessed unwanted sexual experience between ages 13-17 years by someone at least ten years older.18 Sexual experiences included touching of sex organs or vaginal or anal sex. Participants endorsing any of the three items were coded as having had an unwanted adolescent sexual experience.
Substance Use.
Alcohol and cannabis use in the past 6 months were assessed with the Alcohol Use Disorder Identification Test (AUDIT)19 and the Cannabis Use Disorder Identification Test (CUDIT-R).20 Rapid urine drug screening tested for metabolites for the following seven drugs: methylenedioxymethamphetamine (MDMA), marijuana, cocaine, opiates, amphetamines, methamphetamine, and benzodiazepines. Estimated detection windows were 1-2 days for MDMA, 3-10 days for marijuana, 1-2 days for cocaine, 1-4 days for opiates and amphetamines, 3-5 days for methamphetamines, and 3-7 days for benzodiazepines.21–23
Self-Reported STI History.
Participants self-reported whether they had tested positive for any of the following STIs, regardless of anatomical location (e.g., urethra, rectum), in the past six months: chlamydia, trichomonas, gonorrhea, syphilis, genital herpes, or genital warts.
Rectal STI Testing.
The Hologic® Gen-Probe PANTHER® system was used to test rectal swab specimens for Chlamydia trachomatis (CT) and Neisseria gonorrhea (NG) using the Aptima® Combo 2® Assay nucleic acid amplification test at annual study visits beginning at baseline. Specimens were self-collected by study participants. For analytic purposes, participants were coded as having a rectal STI infection if they tested positive for either CT or NG.
HIV Testing.
Alere™ Determine™ 4th Generation HIV-1/HIV-2 Ab/Ag Combo rapid test was used to test for the presence of HIV-1 antibodies, HIV-2 antibodies and free HIV-1 p24 antigen at every visit. Laboratory confirmation followed the Centers for Disease Control and Prevention (CDC) guidelines for HIV testing24 (see Appendix A for additional information). Testing was conducted to identify recent HIV infections using the Sedia™ HIV-1 Limiting Antigen (LAg) Enzyme Immunoassay (EIA) using established recommendations for interpretation.25 RITA positive was defined as having a normalized optical density (ODn) result less than 1.5 from the HIV-1 LAg-Avidity EIA, an HIV-1 RNA result >1000 copies/mL, and no self-reported history of exposure to antiretroviral therapy (ART) 26
Sexual Risk Taking.
The HIV Risk Assessment of Sexual Partnerships (H-RASP)27 was used to derive: 1) the number of male assigned at birth CAS partners in the past 6 months; 2) the number of Black, male assigned at birth CAS partners in the past 6 months among a participants’ four most recent sex partners. A network interview, using Network Canvas software11 elicited data on sexual partners of participants, including the community area where each lived. Following prior studies,12 this data was used to determine if participants had sex with a partner from a community area in the highest quartile for HIV infection rates (Yes/No). The city of Chicago consists of 77 distinct community areas, split by geographical boundaries such as streets, expressways, and parks. Data on HIV infection rates per community area were taken from the Chicago Department of Public Health’s (CDPH) 2016 HIV/STI Surveillance Report.28
Statistical Analyses
The main analytical objectives of the present study were to calculate HIV incidence rates and examine racial/ethnic and gender disparities and identify longitudinal predictors of HIV seroconversion. To account for the fact that incident cases were infected prior to their first HIV-positive visit, we estimated time-at-risk as the midpoint between their last HIV-negative and first HIV-positive study visit. For non-seroconverters, time-at-risk ceased at their last HIV-negative study visit. Participants who were lost-to-follow-up or withdrew from the study were censored at their most recent visit, but their person-time still contributed to time at risk for all analyses. Data collected prior to a participant’s sexual debut, operationally defined as having ever engaged in anal or vaginal sex, were not included in analysis as participants were not considered to be at-risk (80.4 person-years).
Kaplan-Meier survival plots were generated to examine the estimated survival function of remaining uninfected with HIV for the sample as a whole and stratified by race/ethnicity. Cox proportional-hazards regression using time-dependent covariates was utilized to predict HIV seroconversion. Time-dependent covariates were used to account for initiation and acceleration of sexual risk taking and substance use behavior during the developmental period of late adolescence to early adulthood. Data for time-independent covariates were taken from the baseline visit while data for time-dependent covariates were taken from the visit that preceded the event. The timescale used for proportional-hazards modeling was measured in days. Events with the same survival time were modeled using an exact method.
Cox proportional-hazards model development began by individually examining each independent variable for associations with HIV seroconversion, controlling for race/ethnicity to account for the significant disparities in HIV incidence rates. Variables that were found to be statistically significant predictors (p<0.10) were included in the final model. This approach led to the exclusion of some variables with large hazard ratios but significance levels that did not meet the p<0.10 criteria likely because of insufficient cases for the independent and dependent variables. To inform future research these effects are noted in the results section.
Furthermore, supplemental analyses assessed whether having a rectal STI or a sex partner from a Chicago community area with a high HIV incidence rate predicted HIV incidence, while controlling for age, race/ethnicity, and gender identity, using Cox proportional-hazards models. Since rectal STI testing was only conducted annually and not all participants resided in Chicago, these variables were not included in the aforementioned models as they produce a high percentage of missing data.
RESULTS
Demographic characteristics, stratified by HIV status, are displayed in Table I. The analytic sample for HIV incidence estimation only included sexually active participants who were HIV negative at enrollment (i.e., n=178; 16.3% participants who were HIV positive at baseline were not included) and had at least one follow-up visit (n=809).
Table I.
Baseline characteristics, stratified by HIV status at terminal visit, for a sample of 809 HIV negative sexual and gender minorities assigned male at birth, Chicago, IL, 2015-2018.
| HIV Negative (n=765) | HIV Positive (n=44) | Total (n=809) | |
|---|---|---|---|
|
| |||
| n (Row %) | n (Row %) | n (Col %) | |
| Race/Ethnicity | |||
| Black | 200 (87.7) | 28 (12.3) | 228 (28.2) |
| Latinx | 242 (96) | 10 (4) | 252 (31.1) |
| White | 232 (98.7) | 3 (1.3) | 235 (29) |
| Other | 91 (96.8) | 3 (3.2) | 94 (11.6) |
| Gender | |||
| Cisgender Men | 712 (94.6) | 41 (5.4) | 753 (93.1) |
| Transgender Women | 30 (93.8) | 2 (6.3) | 32 (4) |
| Other | 22 (95.7) | 1 (4.3) | 23 (2.8) |
| Missing | 1 (100) | 0 (0) | 1 (0.1) |
| Sexual Orientation | |||
| Gay | 525 (94.4) | 31 (5.6) | 556 (68.7) |
| Bisexual | 166 (93.3) | 12 (6.7) | 178 (22) |
| Queer | 27 (100) | 0 (0) | 27 (3.3) |
| Other | 46 (97.9) | 1 (2.1) | 47 (5.8) |
| Missing | 1 (100) | 0 (0) | 1 (0.1) |
| Education | |||
| < High School Graduate | 124 (89.9) | 14 (10.1) | 138 (17.1) |
| High School Graduate or GED | 174 (91.1) | 17 (8.9) | 191 (23.6) |
| > High School Graduate | 466 (97.3) | 13 (2.7) | 479 (59.2) |
| Missing | 1 (100) | 0 (0) | 1 (0.1) |
| Age (M=20.8, SD=2.8) | |||
| 16-17 | 85 (89.5) | 10 (10.5) | 95 (11.7) |
| 18-24 | 613 (95.3) | 30 (4.7) | 643 (79.5) |
| 25-29 | 67 (94.4) | 4 (5.6) | 71 (8.8) |
Note: Terminal visit for HIV positive participants is equal to their first HIV positive visit, while terminal visit for HIV negative participants is equal to their most recent visit.
Attrition
Attrition in the study was either due to participant initiated withdrawal or the inability to successfully locate and/or schedule participants for follow-up visits. There were no statistically significant (p<.05) baseline differences in age, gender identity, unwanted adolescent sexual experiences, alcohol or marijuana use, self-reported STIs or sexual risk taking between participants who were lost to follow-up and those still actively engaged in the study. However, participants who were lost to follow-up were more likely to have a reactive rapid urine drug result (p = 0.005) and less likely to report being Latinx compared to Black (p = 0.009), White (p = 0.045) and other racial/ethnic (p = 0.014) participants.
HIV Incidence
There were 44 confirmed HIV incident cases across 1,513 person years, resulting in a crude incidence rate of 2.91/100PY (95% CI: 2.16 – 3.91). Crude incidence rates stratified by race/ethnicity and gender identity are presented in Table II. For Black participants, compared to White, Latinx and other racial/ethnic participants, the HIV incidence rate ratio was 8.81 (95% CI: 2.72 – 45.26; p < 0.0001), 3.15 (95% CI: 1.49 – 7.28; p = 0.002) and 3.75 (95% CI: 1.16 – 19.29; p = 0.021), respectively. For cisgender participants, compared to TW and other non-cisgender identities, the HIV incidence rate ratio were not statistically significant. Figure 1 displays the Kaplan-Meier survival estimates for remaining uninfected with HIV. Within the first 12 months, 5.7%, 2.8%, 1.3% and 1.1% of Black, Latinx, White and other racial/ethnic participants, respectively, had seroconverted. The cumulative HIV incidence over the entire time period was 5.4% for the sample as a whole and 12.3%, 4.0%, 1.3% and 3.2% for Black, Latinx, White, and other racial/ethnic participants, respectively.
Table II.
Crude HIV incidence rate stratified by race/ethnicity and gender identity, Chicago, IL, 2015-2018.
| n | Incident Cases | Person-Years | Incidence Rate* (95% CI) | |
|---|---|---|---|---|
| Race/Ethnicity | ||||
| Black | 228 | 28 | 435.9 | 6.42 (4.44 - 9.30) |
| Latinx | 252 | 10 | 491.0 | 2.04 (1.10 - 3.79) |
| White | 235 | 3 | 411.3 | 0.73 (0.24 - 2.26) |
| Other | 94 | 3 | 175.3 | 1.71 (0.55 - 5.31) |
| Gender | ||||
| Cisgender | 731 | 41 | 1368.4 | 3.00 (2.21 - 4.07) |
| Transgender | 40 | 2 | 82.0 | 2.44 (0.61 - 9.75) |
| Other | 38 | 1 | 63.1 | 1.59 (0.22 - 11.25) |
| Total | 809 | 44 | 1513.5 | 2.91 (2.16 - 3.91) |
Note: CI=confidence interval.
Per 100 person-years
Figure 1.
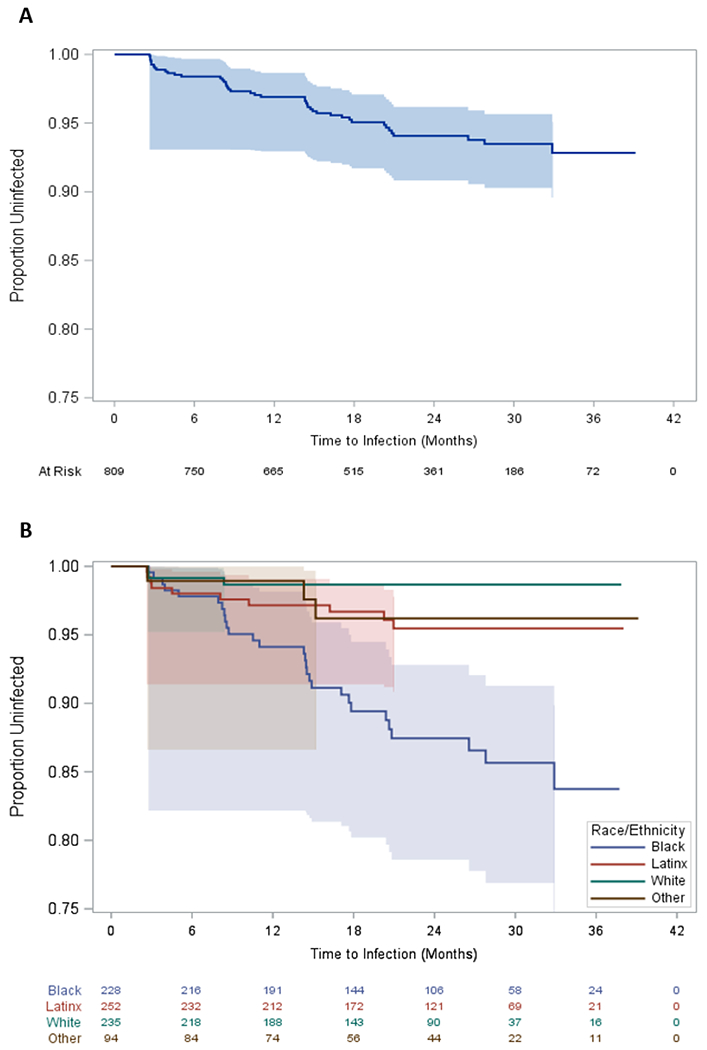
Kaplan-Meier survival estimates of time to HIV infection for the full sample (A) and stratified by race/ethnicity (B). Chicago, IL 2015-2018.
Predicting HIV Incidence
As shown in Table III, HIV incidence decreased with age; for every one year increase in age, the risk of infection decreased by 13% while holding all other covariates constant. HIV incidence increased significantly with the number of CAS partners. The effect of toxicology screen positivity for methamphetamine was large, but wasn’t included in the multivariable model as it did not meet our criteria of p>.10 in bivariable analyses (HR = 4.58, 95% CI: 0.63 – 33.40, p = .133).
Table III.
Multivariate Cox proportional hazards regression model results, Chicago, IL, 2015-2018.
| Estimate | Standard Error | Adjusted Hazard Ratio | 95% Confidence Interval | p-value | |
|---|---|---|---|---|---|
| Age+ | −0.14 | 0.06 | 0.87 | 0.77 - 0.98 | 0.019 |
| Cisgender+ | 0.83 | 0.75 | 2.29 | 0.53 - 9.92 | 0.270 |
| Unwanted adolescent sexual experience | 0.65 | 0.38 | 1.91 | 0.92 - 3.99 | 0.084 |
| Self-reported STI+ | 0.48 | 0.37 | 1.61 | 0.78 - 3.33 | 0.199 |
| Count of CAS partners+ | 0.19 | 0.05 | 1.21 | 1.09 - 1.33 | <0.001 |
| Black† | 1.79 | 0.41 | 5.98 | 2.70 - 13.24 | <0.0001 |
| Count of Black CAS partners+‡ | 0.89 | 0.18 | 2.44 | 1.71 - 3.49 | <0.0001 |
| Black x Count of Black CAS partners+ | −0.67 | 0.25 | - | - | 0.007 |
Note:
Time-varying covariate.
Results represent the simple effect of race/ethnicity when the count of Black CAS partners equals zero.
Results represent the simple effect of the count of Black CAS partners when race/ethnicity equals zero (non-Black). CAS = condomless anal sex
An interaction term between participant black race and the count of black CAS partners was added to the model to test for the impact of sexual network assortativity by race. Including this interaction term resulted in a better fitting model based on decrease in the −2 log likelihood, Akaike information criterion (AIC), and Schwarz Bayesian information criterion (SBC). The significant interaction term indicates that the effect for the count of black CAS partners varied by race/ethnicity. For non-black and black participants, each additional black CAS partner increased HIV incidence by 2.44 (95% CI: 1.71-3.49) and 1.24 (95% CI: 0.88-1.77) times, respectively. The effect of race/ethnicity across the different number of black CAS partners is displayed in Figure 2. Black participants are at 5.98 (95% CI: 2.70-13.24) and 3.05 (95% CI: 1.63-5.70) times greater risk than non-black participants when reporting zero and one black CAS partner(s) respectively. The effect of participant black race for two, three and four black CAS partners were non-significant (p>.05).
Figure 2.
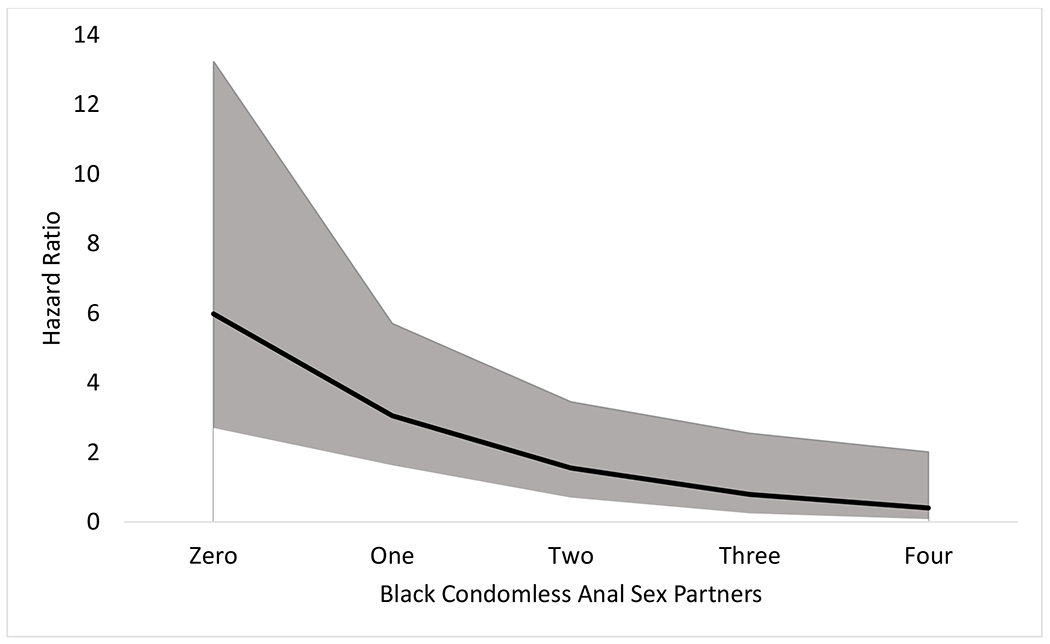
Interaction effect of participant black race with number of black condomless anal sex partners, Chicago, IL, 2015-2018.
Note: The solid black line represents the adjusted hazard ratio of HIV infection for Black participants compared to non-Black participants at each level of Black condomless anal sex partners. The grey shaded area represents the 95% confidence interval for the adjusted hazard ratio.
Supplemental analyses were conducted to examine effects of laboratory detected rectal STIs and having a sex partner from a community area with a high HIV incidence rate. Using data from annual visits, having tested positive for a rectal STI was associated with a significantly higher HIV incidence (HR: 2.50; 95% CI: 1.27-4.92). Using data from bi-annual visits, having a sex partner from a community area with a high HIV incidence rate was associated with a significantly higher HIV incidence (HR: 2.46; 95% CI: 1.19-5.07). For this later model, adding the predictor representing having a sex partner from a community area with a high HIV incidence rate resulted in a marginal reduction (7.9%) in the estimated measure of association between participant black race and HIV incidence (HR: 3.73 vs. 3.45). No significant interaction between participant black race and having a sex partner from a community area with a high HIV incidence rate was found.
Estimation of HIV Incidence Based on Cross-sectional Baseline Data
Of the 178 HIV positive participants at the baseline visit, 2.25% (95% CI: 0.62% - 5.65%) were considered recent infections using the RITA strategy. Following estimation methods recommended by the World Health Organization29 and South African Centre for Epidemiological Modeling and Analysis,30 the estimated annualized HIV incidence at the baseline visit was 0.66% (95% CI: 0.00% - 1.84%) using a post-infection cut-off time of two years, mean duration of recent infection (MDRI) of 141 days and false-recent rate (FRR) of 1.0%.
DISCUSSION
In our longitudinal cohort study, we estimated a high HIV incidence for YMSM/TW (2.91/100PY), driven primarily by a very high incidence among black participants (6.42/100PY). To put these incidence rates in perspective, in 2015 the national annual HIV incidence among all males ≥13 years, based on a cross-sectional CD4 depletion model, was estimated to be 0.02/100 persons1 and 0.51 among MSM.5 HIV incidence among MSM was higher among black than white and Hispanic MSM, and highest among those aged 25-34 years, followed by those aged 13-24 years. From 2008 – 2015, HIV incidence increased only among MSM aged 25-34 years and Latinx MSM.5 No incidence rates were reported for TW.
Our incidence estimates are somewhat lower than the estimate from another study of 16-20 year old MSM in Chicago (4.11/100PY),6 13-18 year olds in 3 cities (3.4/100PY)4, and similar to a cohort study of 18-19 year old MSM in New York City (2.85/100PY).7 Since age had an inverse relationship with HIV incidence in our sample it is not surprising that YMSM samples with younger mean ages tended to have higher incidence. Our incidence among black 16-29 year old MSM/TW is similar to the weighted mean estimate of 6.73/100PY derived from four studies of 2,045 black MSM.31 That estimate was used to model HIV prevalence in a simulated cohort over time, which estimated 60.73% of black MSM to be HIV positive by age 40 years. The authors of that study concluded that if black MSM in the U.S. formed a country, it would have the highest HIV prevalence on the globe—a powerful call to action to redouble efforts to understand and address this dramatic disparity. A call echoed by our findings, which make clear we have not bent the curve on the HIV epidemic among black YMSM/TW in the U.S.
To advance understanding of this racial disparity—particularly through consideration of partner and network factors—we included the number of black CAS partners in our multivariable model. Prior network studies11,12 and simulation models32 of YMSM HIV transmission have demonstrated the important role of homophilous sexual networks in maintaining and exacerbating racial disparities. We used the number of black CAS partners as a proxy for this network phenomenon and found that an individual’s own black race became a less important marker of HIV risk as individuals become more connected to black sexual networks. In the multivariable model, this effect was larger than the effect of total number of CAS partners, which indicates that risk for HIV infection is less about one’s own race and more about racialized sexual network connections. Since black YMSM tend to be in homophonous sexual networks11,12 new infections tend to be within this relatively insular network. Research on network-based interventions to disrupt these HIV disparities are needed.
In further analyses, we found that sex with a partner living in a high HIV incidence community area, based on health department surveillance data,28 was significantly associated with HIV incidence. As Chicago is a city with significant racial segregation and higher HIV incidence in community areas with large minority populations, we considered if community area HIV incidence might modify the racial disparities found in our primary analyses. Including this variable in a multivariable model with participant race only produced a modest decrease in the effect of race, suggesting that racial disparities in HIV incidence are unlikely to be fully explainable by residential racial segregation within Chicago. Nevertheless, partner geographic residence had a significant main effect, which suggests that structural interventions that can help to lower community viral load could help reduce HIV incidence among YMSM/TW.
Consistent with national estimates,5 we found HIV incidence among Latinx MSM to be higher than white and lower than black MSM. These national estimates found Latinx MSM to be the only MSM racial/ethnic group to show an increase in HIV incidence from 2008-2015.5 Studies of social determinants and network factors hypothesized to explain racial/ethnic disparities in HIV have consistently found that Latinx YMSM are often intermediate between white and black YMSM on the majority of variables. For example, one recent study found Latinx YMSM to be at intermediate risk in terms of multiple individual (e.g., substance use, number of condomless sex partners), structural (e.g., experiences of violence, childhood sex abuse), and network factors (e.g., more sexual mixing with higher prevalence demographics).11 Taken together, these findings are consistent with the conclusions of a simulation study of HIV incidence among YMSM over 15 years that the black-Latino HIV incidence gap will begin to close due to increasing incidence among Latino YMSM.32
Prior research has estimated that approximately one in seven HIV infections among MSM are attributable to a rectal STI.33 In our study, self-reported STI was significantly associated with HIV incidence in models only controlling for participant race, but this effect became non-significant in the full multivariable model. Further analyses that made use of data from study visits that tested rectal STI infections produced a significant effect of rectal STI diagnosis similar in magnitude previously reported among adult MSM.33 As such, accumulating evidence supports the importance of testing for and treating rectal STIs as an important HIV prevention intervention.
Here we reported the first US estimate of HIV incidence among young TW and other individuals assigned a male sex at birth that that do not identify with a male gender (e.g., Genderqueer, non-binary). With a combined 145 PY of data, these HIV estimates did not significantly differ from the estimates for cis-gender YMSM. While these data suggest comparable HIV incidence between YMSM and young TW, incidence is high in both groups. TW may benefit from interventions tailored to their needs and experiences and the high incidence found in the current study support the need to scale up culturally relevant interventions for young TW.
To help advance methodological research on estimation of HIV incidence using cross-sectional data, we calculated an HIV incidence from baseline data using a RITA algorithm. It estimated HIV incidence at 0.66; which was lower and had a non-overlapping confidence intervals with the longitudinal data-based HIV incidence estimate. In terms of the data reported here, this pattern of results suggest cross-sectional RITA HIV incidence estimates among YMSM/TW may be biased downward relative to what would be observed through the gold standard of longitudinal follow-up.
The current study had a number of strengths, including a large sample coming from community areas throughout Chicago and whose racial distribution mirrored census data on the city, the rare inclusion of participants under the age of 18 years, and excellent retention. Nevertheless, findings must be interpreted in the context of limitations. First, the sample was not ascertained using a probability sampling design and therefore may not be fully representative of YMSM/TW in Chicago. While many variables were assessed using biological assays, others were assessed through self-report and as such are subject to reporting biases. Data collection was initiated before PrEP was functionally available, so PrEP use was not integrated into the analyses in order to estimate its effects on YMSM/TW HIV incidence. Such analyses can be performed as further waves of data are collected within the cohort.
Findings from this study, including the high HIV incidence and dramatic racial disparities, suggest that implementation of effective HIV prevention strategies, including eHealth and in-person behavioral interventions, PrEP, and test and treat strategies, have not yet reached YMSM/TW at the scale necessary to get to zero new infections. With HIV incidence inversely associated with age in this cohort, we particularly emphasize the imperative for the development and scale-up of HIV interventions that reach the youngest segments of this community, including those under 18 years of age, and particularly among Black YMSM/TW.
ACKNOWLEDGEMENTS
This study was funded by the National Institute on Drug Abuse (U01DA036939). We acknowledge the support of the Third Coast Center for AIDS Research (P30AI117943) and the Northwestern University Clinical and Translational Sciences Institute (UL1TR001422). We thank the participants in the RADAR study for sharing their experiences. We acknowledge the contributions of the RADAR study staff, particularly Antonia Clifford, Justin Franz, Roky Truong, Christian Castro, and Hannah Hudson.
Conflicts of Interest and Source of Funding
The authors declare that they have no conflicts of interest. This study was funded by the National Institute on Drug Abuse (U01DA036939).
Appendix A. Comparison of point of care and laboratory 4th generation HIV tests
Methods
For the first nine months of the study, laboratory confirmation was conducted on all participants, regardless of result, to assess sensitivity and specificity of this diagnostic tool. After this evaluation period, laboratory confirmation was only conducted on participants with a reactive rapid test result. Laboratory confirmation followed the Centers for Disease Control and Prevention (CDC) guidelines for HIV testing24.
Results
HIV rapid testing as described in primary methods, with follow-up laboratory confirmation, was conducted on 579 specimens of which 13.6% (n=79) were confirmed to be infected with HIV. Sensitivity, specificity and accuracy of the rapid test was 97.5% (95% CI: 94.0% - 100.0%), 99.8% (95% CI: 99.4% - 100.0%) and 99.5% (95% CI: 98.9% - 100.0%) respectively. Two false negative cases were found and both came from participants who were on antiretroviral therapy (ART). A single false positive case was verified based on the results of a HIV-1 nucleic acid amplification test. Of the 77 true positive cases, zero tested reactive for free HIV-1 p24 antigen.
Footnotes
To increase comparability of annual incidence estimates values were converted published estimates per 100,000 people to estimates per 100 people by dividing numerator by 1,000.
REFERENCES
- 1.Centers for Disease Control and Prevention. Estimated HIV incidence and prevalence in the United States, 2010-2015. HIV Surveillance Supplemental Report Web site. https://www.cdc.gov/hiv/library/reports/hiv-surveillance.html. Published 2018. Accessed 21 September 2018. [Google Scholar]
- 2.Hall HI, Song R, Szwarcwald CL, Green T. Brief report: Time from infection with the human immunodeficiency virus to diagnosis, United States. J Acquir Immune Defic Syndr. 2015;69(2):248–251. [DOI] [PMC free article] [PubMed] [Google Scholar]
- 3.Sharma A, Wang LY, Dunville R, Valencia RK, Rosenberg ES, Sullivan PS. HIV and sexually transmitted disease testing behavior among adolescent sexual minority males: Analysis of pooled Youth Risk Behavior Survey data, 2005-2013. LGBT Health. 2017;4(2):130–140. [DOI] [PMC free article] [PubMed] [Google Scholar]
- 4.Balaji AB, An Q, Smith JC, et al. High human immunodeficiency virus incidence and prevalence and associated factors among adolescent sexual minority males-3 cities, 2015. Clin Infect Dis. 2018;66(6):936–944. [DOI] [PMC free article] [PubMed] [Google Scholar]
- 5.Singh S, Song R, Johnson AS, McCray E, Hall HI. HIV incidence, prevalence, and undiagnosed infections in U.S. men who have sex with men. Ann Intern Med. 2018;168(10):685–694. [DOI] [PubMed] [Google Scholar]
- 6.Garofalo R, Hotton AL, Kuhns LM, Gratzer B, Mustanski B. Incidence of HIV infection and sexually transmitted infections and related risk factors among very young men who have sex with men. J Acquir Immune Defic Syndr. 2016;72(1):79–86. [DOI] [PMC free article] [PubMed] [Google Scholar]
- 7.Halkitis P, Kapadia F, Ompad D. Incidence of HIV infection in young gay, bisexual, and other YMSM: The P18 cohort study. J Acquir Immune Defic Syndr. 2015;69(4):466–473. [DOI] [PMC free article] [PubMed] [Google Scholar]
- 8.Sullivan PS, Rosenberg ES, Sanchez TH, et al. Explaining racial disparities in HIV incidence in black and white men who have sex with men in Atlanta, GA: A prospective observational cohort study. Ann Epidemiol. 2015;25(6):445–454. [DOI] [PMC free article] [PubMed] [Google Scholar]
- 9.Ackers ML, Greenberg AE, Lin CY, et al. High and persistent HIV seroincidence in men who have sex with men across 47 U.S. cities. PLoS ONE. 2012;7(4):e34972. [DOI] [PMC free article] [PubMed] [Google Scholar]
- 10.Koblin BA, Mayer KH, Eshleman SH, et al. Correlates of HIV acquisition in a cohort of Black men who have sex with men in the United States: HIV prevention trials network (HPTN) 061. PLoS ONE. 2013;8(7):e70413. [DOI] [PMC free article] [PubMed] [Google Scholar]
- 11.Mustanski B, Morgan E, D’Aquila R, Birkett M, Janulis P, Newcomb ME. Individual and Network Factors Associated With Racial Disparities in HIV Among Young Men Who Have Sex With Men: Results From the RADAR Cohort Study. J Acquir Immune Defic Syndr. 2019;80(1):24–30. [DOI] [PMC free article] [PubMed] [Google Scholar]
- 12.Mustanski B, Birkett M, Kuhns LM, Latkin CA, Muth SQ. The role of geographic and network factors in racial disparities in HIV among young men who have sex with men: An egocentric network study. AIDS Behav. 2015;19(6):1037–1047. [DOI] [PMC free article] [PubMed] [Google Scholar]
- 13.Poteat T, Scheim A, Xavier J, Reisner S, Baral S. Global epidemiology of HIV infection and related syndemics affecting transgender people. J Acquir Immune Defic Syndr. 2016;72 Suppl 3:S210–219. [DOI] [PMC free article] [PubMed] [Google Scholar]
- 14.Baral SD, Poteat T, Stromdahl S, Wirtz AL, Guadamuz TE, Beyrer C. Worldwide burden of HIV in transgender women: A systematic review and meta-analysis. Lancet Infect Dis. 2013;13(3):214–222. [DOI] [PubMed] [Google Scholar]
- 15.Nuttbrock L, Bockting W, Rosenblum A, et al. Gender Abuse and Incident HIV/STI Among Transgender Women in New York City: Buffering Effect of Involvement in a Transgender Community. AIDS Behav. 2015;19(8):1446–1453. [DOI] [PubMed] [Google Scholar]
- 16.Mustanski B, Newcomb ME, Du Bois SN, Garcia SC, Grov C. HIV in young men who have sex with men: A review of epidemiology, risk and protective factors, and interventions. J Sex Res. 2011;48(2-3):218–253. [DOI] [PMC free article] [PubMed] [Google Scholar]
- 17.Schlusser KE, Pilcher C, Kallas EG, et al. Comparison of cross-sectional HIV incidence assay results from dried blood spots and plasma. PLoS ONE. 2017;12(2):e0172283. [DOI] [PMC free article] [PubMed] [Google Scholar]
- 18.Leserman J Sexual abuse history: Prevalence, health effects, mediators, and psychological treatment. Psychosom Med. 2005;67(6):906–915. [DOI] [PubMed] [Google Scholar]
- 19.Saunders JB, Aasland OG, Babor TF, de la Fuente JR, Grant M. Development of the Alcohol Use Disorders Identification Test (AUDIT): WHO collaborative project on early detection of persons with harmful alcohol consumption-II. Addiction. 1993;88(6):791–804. [DOI] [PubMed] [Google Scholar]
- 20.Adamson SJ, Kay-Lambkin FJ, Baker AL, et al. An improved brief measure of cannabis misuse: the Cannabis Use Disorders Identification Test-Revised (CUDIT-R). Drug Alcohol Depend. 2010;110(1-2):137–143. [DOI] [PubMed] [Google Scholar]
- 21.Innovacon Inc. Drugs of abuse: One step drug screen test card: Instruction sheet for single and multi drug screen test cards for any combination of the following drugs: AMP/BAR/BZO/COC/THC/MTD/mAMP/MDMA/MOP/OPI/OXY/PCP/PPX/TCA. In. San Diego, CA: CLIAwaived.com; n.d. [Google Scholar]
- 22.Substance Abuse and Mental Health Services Administration. Clinical drug testing in primary care. In. 32 ed. Rockville, MD: Substance Abuse and Mental Health Services Administration; 2012. [Google Scholar]
- 23.Li DH, Janulis P, Mustanski B. Predictors of correspondence between self-reported substance use and urinalysis screening among a racially diverse cohort of young men who have sex with men and transgender women. Addict Behav. 2018;88:6–14. [DOI] [PMC free article] [PubMed] [Google Scholar]
- 24.Centers for Disease Control and Prevention and Association of Public Health Laboratories. Technical update on HIV-1/2 differentiation assays, https://stacks.cdc.gov/view/cdc/40790. Published 2016. Accessed 11 April 2017.
- 25.Duong YT, Kassanjee R, Welte A, et al. Recalibration of the limiting antigen avidity EIA to determine mean duration of recent infection in divergent HIV-1 subtypes. PLoS ONE. 2015;10(2):e0114947. [DOI] [PMC free article] [PubMed] [Google Scholar]
- 26.Kim AA, Rehle T. Assessing estimates of HIV incidence with a recent infection testing algorithm that includes viral load testing and exposure to antiretroviral therapy. AIDS Res Hum Retroviruses. 2018. [DOI] [PubMed] [Google Scholar]
- 27.Swann G, Newcomb ME, Mustanski B. Validation of the HIV Risk Assessment of Sexual Partnerships (H-RASP): Comparison to a 2-month prospective diary study. Arch Sex Behav. 2018;47(1): 121–131. [DOI] [PMC free article] [PubMed] [Google Scholar]
- 28.Chicago Department of Public Health. HIV/STI Surveillance Report 2016. Chicago, IL: 2016. [Google Scholar]
- 29.World Health Organization and UNAIDS. Technical update on HIV incidence assays for surveillance and monitoring purposes. WHO HIV Incidence Assay Working Group Meeting; Spain: UNAIDS, Barecelona, 2015. [Google Scholar]
- 30.South African Centre for Epidemiological Modeling and Analysis. Incidence estimation tools. http://www.incidence-estimation.org/page/tools. Published 2015. Accessed 3 October 2018.
- 31.Matthews DD, Herrick AL, Coulter RW, et al. Running backwards: Consequences of current HIV incidence rates for the next generation of black MSM in the United States. AIDS Behav. 2016;20(1):7–16. [DOI] [PMC free article] [PubMed] [Google Scholar]
- 32.Beck EC, Birkett M, Armbruster B, Mustanski B. A data-driven simulation of HIV spread among young men who have sex with men: Role of age and race mixing and STIs. J Acquir Immune Defic Syndr. 2015;70(2):186–194. [DOI] [PMC free article] [PubMed] [Google Scholar]
- 33.Barbee LA, Khosropour CM, Dombrowksi JC, Golden MR. New human immunodeficiency virus diagnosis independently associated with rectal gonorrhea and chlamydia in men who have sex with men. Sex Transm Dis. 2017;44(7):385–389. [DOI] [PMC free article] [PubMed] [Google Scholar]