

Abstract
Exposure to polycyclic aromatic hydrocarbons (PAHs) often occur as complex chemical mixtures, which are linked to numerous adverse health outcomes in humans, with cancer as the greatest concern. The cancer risk associated with PAH exposures is commonly evaluated using the relative potency factor (RPF) approach, which estimates PAH mixture carcinogenic potential based on the sum of relative potency estimates of individual PAHs, compared to benzo[a]pyrene (BAP), a reference carcinogen. The present study evaluates molecular mechanisms related to PAH cancer risk through integration of transcriptomic and bioinformatic approaches in a 3D human bronchial epithelial cell model. Genes with significant differential expression from human bronchial epithelium exposed to PAHs were analyzed using a weighted gene coexpression network analysis (WGCNA) two-tiered approach; first to identify gene sets co-modulated to RPF, and second, to link genes to a more comprehensive list of regulatory values, including inhalation-specific risk values. Over 3,000 genes associated with processes of cell cycle regulation, inflammation, DNA damage, and cell adhesion processes were found to be co-modulated with increasing RPF with pathways for cell cycle S phase and cytoskeleton actin identified as the most significantly enriched biological networks correlated to RPF. In addition, co-modulated genes were linked to additional cancer-relevant risk values, including inhalation unit risks, oral cancer slope factors, and cancer hazard classifications from the World Health Organization’s International Agency for Research on Cancer (IARC). These gene sets represent potential biomarkers that could be used to evaluate cancer risk associated with PAH mixtures. Among the values tested, RPF values and IARC categorizations shared the most similar responses in positively and negatively correlated gene modules. Together, we demonstrated a novel manner of integrating gene sets with chemical toxicity equivalence estimates through WGCNA to understand potential mechanisms.
Keywords: Polycyclic aromatic hydrocarbons, 3D in vitro model, bronchial epithelial cells, risk assessment, cancer
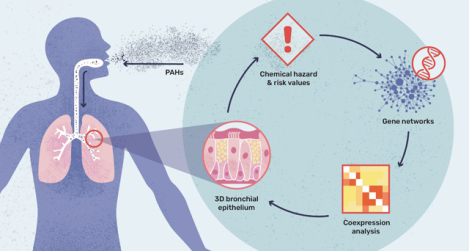
Graphical Abstract
INTRODUCTION
PAHs as global contaminants
Polycyclic aromatic hydrocarbons (PAHs) are a ubiquitous class of environmental contaminants found in ambient air, indoor air, water, and soil. Of hundreds of identified and studied PAHs, currently 16 PAHs are listed on the US Environmental Protection Agency (EPA) high priority pollutant list1. These priority PAHs were identified based on relative abundance in the environment and toxicity, but there are PAHs beyond the list of 16 that have higher toxicity in complex environmental mixtures2. Atmospheric PAHs can serve as an important source of PAH exposure and can participate in long range transport to settle in soil and water3–7,8. The hazards and risks of PAH exposure may depend on the mixture composition and exposure route, which can include ingestion, inhalation, and dermal contact in occupational and environmental settings8–12. Adverse human health outcomes can be diverse for the class, but include cancer as the health effect of greatest concern with the US EPA and the European Chemicals restricting the exposure and sale of petroleum products containing at least eight of these carcinogenic PAHs. Despite their importance and prominence in mixtures of concern, accurate human health risk assessment of PAHs remains a challenge.
Cancer risk assessment of PAHs
The current EPA framework for PAH regulation involves estimating cancer risk using a component-based relative potency factor (RPF) approach in which risk for PAH mixtures is estimated based on sum relative potency for component PAHs present in the mixture13. In this approach, benzo[a]pyrene (BAP) is used as a reference carcinogen and cancer risk is reported in terms of BAP equivalents (BAPeq). A major limitation of this approach includes its heavy reliance on dose-response assessments of traditional, two-year in vivo rodent carcinogenicity bioassays that are lengthy and resource-intensive. Further, RPF estimates exist for only 27 PAHs limiting applicability of the approach to the broader class of over 1500 polycyclic aromatic compounds, many of which co-occur in mixtures. In addition, RPF values are primarily derived from studies based on intraperitoneal injection or dermal exposure, which may not adequately represent alternate PAH routes of exposure in humans and could fail to capture the true risk of individuals PAHs. These data suggest an urgent need to develop alternative approaches for chemical hazard assessment and regulation14. In addition, other risk and regulatory values should be considered to adequately evaluate lung-specific PAH cancer hazards. Regulatory values that incorporate additional routes of exposure include inhalation unit risk (IUR), cancer slope factor, reference concentration (RfC), reference dose (RfD), and cancer hazard categorizations are available through the International Agency for Research on Cancer (IARC) and assessments from the US EPA Integrated Risk Information System (IRIS). Currently, there are limited investigations examining possible links between biological mechanisms and such increased cancer risks and toxicity values across different chemicals within a chemical class.
Utility of Transcriptional Signatures in Chemical Hazard Assessment
Transcriptomics has emerged as an informative method for evaluating biological functions and pathways targeted by xenobiotics. Transcriptional profiling of gene signatures has been especially useful in identifying mechanisms linked to adverse outcomes and cancer modes of action15–17. Additional applications in toxicology include modeling transcriptional information for risk assessment18–20 and evaluating chemical mixture interactions21,22. Further applications of bioinformatics and transcriptomics have been used to evaluate biomarkers of chemical exposure at the transcriptional level23.
Despite the acceptance of transcriptomics, standard methods for global gene expression analyses, which typically filter data based on differential expression criteria for pathway enrichment, can restrict the number of possible toxicogenomic biomarkers identified and limit downstream interpretation. We previously analyzed transcriptional gene signatures exposed to a range of carcinogenic PAHs and identified pathway gene sets for successful development of a classification model to accurately predict chemical carcinogenic potency24,25. However, a limitation of this gene classifier identification was the reliance on pathway annotation. Novel bioinformatics approaches can help overcome these limitations. One such method, known as the weighted gene co-expression network analysis (WGCNA), provides a systems biology approach to explore genes regulated together without a priori knowledge26,27. Researchers have noted the benefit of co-expression approaches where gene signature identification would be independent of pathway annotations28. In addition, co-expression network analysis allows for identification of genes associated with a specific parameter rather than focusing on chemical-specific gene regulation. Groups of genes are identified as modules through an initial correlation analysis; then gene modules are related to traits or parameters, which can span dose, time, chemical traits, and biological phenotypes26,29. This co-expression approach has been applied successfully in the field of toxicology to identify novel transcription factors associated with bisphenol A exposure30 and genes and proteins linked to adverse health effects associated with increased inorganic arsenic exposure31.
While the cancer-related health effects of PAHs and PAH mixtures have been evaluated in numerous cell-based and animal studies, there remains a lack of understanding of the genes and pathways affected by different carcinogenic PAHs in an inhalation-relevant model. There also exist data gaps in understanding genes and signaling events implicated in chemical carcinogenesis. WGCNA can be used to correlate transcriptional changes with increasing cancer risk (RPF), thereby allowing comparisons across chemicals and mixtures with different relative potencies. Therefore, co-expression analysis serves as a novel approach to investigate PAH-induced system-wide biological changes in an organotypic tissue model and may contribute MOA information to future cancer hazard and risk assessment. The goal of the present study is to identify gene sets co-modulated in relation to estimated human cancer risk and regulatory values and to better understand biological signaling important for chemically-induced disease. Network analysis of these co-modulated molecules was carried out to understand the biological functions and signaling networks of genes most significantly co-modulated in relation to cancer risk.
METHODS
Chemicals and Reagents
Cell culture media and phosphate buffered saline (PBS) were provided by MatTek Corporation (Ashland, MA). Benzo[a]pyrene (BAP) CAS# 50-32-8 and dibenzo[def,p]chrysene (DBC) CAS# 189-64-0 were purchased from MRIGlobal (Kansas City, MO). Benz[a]anthracene (BAN) CAS# 56-55-3, phenanthrene (PHE) CAS# 85-01-8, and pyrene (PYR) CAS# 19-00-0 were acquired from Sigma-Aldrich Chemical (St. Louis, MO.). PAHs used in the simulated air mixture (AM) were purchased from Sigma-Aldrich Chemical (St.Louis, MO.) Coal Tar Extract (CTE) standard reference material (SRM 1597a) was purchased from the National Institute of Standards & Technology (Gaithersburg, MD.) DNase I, TRIzol® reagent, Superscript® III First Strand Synthesis System, qPCR primers, and Pierce™ LDH Cytotoxicity Assay Kit were from Thermo Fisher Scientific (Waltham, MA). 2X SsoAdvanced™ Universal SYBER®Green Supermix was purchased from BioRad Laboratories, Inc. (Hercules, CA.) A simulated AM designed from published results of air samples collected in Beijing, China and analyzed for parent, nitrated, and oxygenated PAHs (Wang et. al., 2011) was produced as follows. Five parent PAHs were selected based on their abundance and biological relevance. Three additional methylated PAHs were selected for addition of non-carcinogenic components. Benzo[b]fluoranthene CAS# 205-99-2, benz[e]pyrene CAS# 192-97-2, benzo[g,h,i]perylene CAS# 191-24-2, benzo[a]pyrene, dibenzo[def,p]chrysene, 2-methylnaphthalene CAS# 91-57-6, 1-methylnaphthalene CAS# 90-12-0, and 1,3-dimethylnaphthalene CAS# 575-41-7 were added in the reported proportions relative to the sum of the eight chosen PAHs (Supplemental File S1). The simulated mixture was solubilized in acetone vehicle.
Tissue Culture and Chemical Exposures
Tissue culture and chemical exposures were described previously32. Briefly, primary human bronchial epithelial cells (HBEC) differentiated on transwell inserts (EpiAirway™ 100, Mattek, Ashland, MA) equilibrated for 24 hours at 37°C, 5% CO2 followed by a change of fresh medium. Single PAHs and mixtures were solubilized in acetone and applied (0.01 ml/insert) to the apical surface of tissues (n=4 per treatment) for up to 48 hrs, BAP (1–500 ug/ml or 0.02–8.33 ug/cm2), DBC (1–50 ug/ml or 0.02–0.83 ug/cm2), BAN (10–500 ug/ml or 0.17–8.33 ug/cm2), PYR (10–250 ug/ml or 0.17–8.34 ug/cm2), PHE (10–250 ug/ml, or 0.17–4.17 ug/cm2), AM (125–2000 ug/ml or 2.08–33.3 ug/cm2) and CTE (250 −1500 ug/ml or 4.17–25 ug/cm2). Individual PAHs were chosen to span carcinogenic potency, ranging from non-carcinogenic to those with lower/higher potency than BAP13. Forty eight hours post treatment, PBS (0.20ml) was added to the apical surface of each insert and 48 hr transepithelial electrical resistance (TEER) recorded as previously reported25,32. Apical washes and basal media were transferred to clean, sterile tubes and stored at −80°C. At the end of each exposure regimen, lysis buffer was added to each insert, collected, and stored at −80°C until extraction using RNeasy Mini kit (Qiagen, Venlo, Netherlands).
Transcriptomic Analyses
Total RNA samples were isolated from HBEC (n=4 per treatment) after treatment with 10, 100, and 500 ug/ml BAP, 10 ug/ml DBC, 100 ug/ml PHE, 500 ug/ml PYR, 500 ug/ml BAN, 1500 ug/ml CTE and 250 ug/ml AM. Dosing was chosen based on BAP equivalents at concentrations similar to those used in prior animal studies as previously reported. Briefly, RNA was isolated using RNeasy Mini Kit (Qiagen, Venlo, Netherlands) and was quantitated on a SYNERGY/HTX plate reader equipped with a Take3 module, then evaluated for quality with a Bioanalyzer 2100, Agilent (Santa Clara, CA). Samples were sequenced by Illumina HiSeq3000 through the Oregon State University’s Center for Genome Research and Biocomputing Core facilities yielding 22–25 million reads per sample as described previously25,32. Sequenced reads were processed with Cutadapt (version 1.8.1) to trim adapter sequences from the paired-end reads. The human genome assembly GRCh38.84 was indexed using botwie2-build (version 2.2.3) while the transcriptome was indexed using Tophat (version 2.1.1.)33. TopHat was used to align the trimmed reads to indexed transcriptome and genome34. FeatureCounts, from the Subread package (version 1.6.0) was used to generate count tables.
Statistical Evaluation of Transcriptional Changes Associated with PAHs
Sequence count data were used to identify genes with expression levels associated with each PAH exposure. A comparative analysis of RNAseq data was determined in DESeq2 (version 1.26.0)35. The non-normalized count table output from FeatureCounts was input into DESeq2 to estimate differential gene expression as logarithmic fold change (log2FC) compared to vehicle control. Genes included for further analysis in WGCNA met the statistical criteria of q<0.05 for at least one chemical exposure group with no undetected values in the remaining exposure groups.
Organizing Cancer Risk Values across Databases
We first used RPFs from the U.S. Environmental Protection Agency IRIS 2010 recommendation of an RPF approach for the carcinogenic risk assessment of PAH mixtures. The RPF approach assigns a numerical value to each chemical based on experimentally derived carcinogenic potency, scaled as greater or less than BAP (RPF of 1). The dose-specific cancer risk of PAH mixtures were calculated by multiplying available RPFs to the proportions (mg/kg) of the individual PAH present in the mixtures and reported as weighted averages (Supplemental File S2). Chemicals without RPF carcinogenic estimates were assigned values of 0 for the purpose of calculating a sum mixture cancer risk. Individual PAHs were calculated by multiplying dose with RPF.
Additional cancer-relevant regulatory values, such as oral slope factor (OSF), IUR, RFC and RFD were downloaded from databases, prioritized in order of availability from the EPA CompTox Chemistry Dashboard36, then predicted from Conditional Toxicity Value Predictor (CTV)37. While many of these health risk values were derived or predicted with variable confidence, it was important to consider these with the goal of including inhalation risk values, to serve as comparisons against RPF and OSF, which are derived through oral and dermal routes of exposure. IRIS and IARC categories also were converted to a numerical scale, with 0 representing least and 4 representing greatest hazard, or group 1. Chemicals with no IRIS or IARC information were grouped as the least hazard.
Identifying Genes with Co-Modulated Expression Patterns through WGCNA
To identify co-modulated gene sets within the transcriptomic dataset of PAH and PAH mixtures treated HBEC, WGCNA was employed to calculate integrated measures from co-modulated genes. WGCNA is a quantitative, systems biology approach that describes correlation patterns between groups of genes26. All genes that were identified as significantly regulated across at least one treatment (13644 genes in total) were analyzed collectively using the WGCNA R package27. WGCNA was used to identify clusters (modules) of highly interconnected genes across both experimentally and database-derived traits and regulatory values, all correlated with each other, and thus considered co-modulated. The steps have been previously summarized26–28,30,38. Overall network and module statistics were performed following methods described by Langfelder et al.27. First, Pearson correlation coefficients were calculated for all pairwise comparisons of genes. The resulting Pearson correlation matrix was transformed into an adjacency matrix resulting in a weighted network describing connection strengths between genes. To allow genes with both negative and positive correlations to be grouped together, an unsigned network was used. A power of 16 and minimum gene module size of 50 was used to construct co-expression gene networks that were weighted to prioritize genes with high correlations as previously described31. Modules were then identified as groups of interconnected genes in the weighted network analysis with high topological overlap, measured based on an average linkage hierarchical clustering. The resulting modules represent clusters of highly interconnected genes with high positive or negative correlations. With these defined modules, the first principal component of the modules were calculated and referred to as eigenmodules, then correlated with toxicity values where statistical significance was evaluated26.
Network Analysis of Co-Modulated Genes associated with Cancer Risk Values
Network analysis was carried out to understand systems-level responses that occur within a co-modulated set of mRNAs identified through WGCNA. RPF-associated genes from prioritized module eigengene were further analyzed for pathway enrichment analysis using the Process Network knowledgebase in Metacore (Clarivate Analytics, Philadelphia, PA). In addition, protein-protein interactions were evaluated in Metacore to identify over-connected genes or hubs associated with the dataset. Statistical significance of over-connected interactions was calculated using a hypergeometric distribution, where the p value represents the probability of a particular mapping arising by chance for experimental data compared to the background39. Average FDRs for network categories were calculated for further analysis. Network visualizations were prepared in Cytoscape (v3.8.0)40 using gene and protein interactions provided from the Metacore Process Network knowledgebase. The functional networks were analyzed through the Cytoscape NetworkAnalyzer tool to calculate betweenness centrality for each gene based on interactions (undirected) described from Metacore as a way to prioritize the role of genes within the network41. Betweenness centrality provides a measure of how important the node is to the flow of information through a network and may represent important regulators in a biological network42–45.
RESULTS
Organizing Cancer Risk Values across Databases
To relate human cancer risk to our PAH treatments, we first used RPFs from the U.S. Environmental Protection Agency Integrated Risk Information System’s (IRIS) 2010 recommendation of a component-based RPF approach for the carcinogenic risk assessment of PAH mixtures, in which RPFs for component PAHs are summed after scaling for concentration in the mixture13. Cancer potency factors (referred to as BAP equivalents, or BAPeq) were calculated using the RPF approach for PAHs with RPF estimates available. For the PAH mixtures, RPFs were missing for as many as 57 out of the 73 PAHs in Coal tar extract mixture (78%), and 4 out of the 8 PAHs in the air mixture sample (50%). Calculations by mass determined that 75% of the components in CTE were unaccounted for by RPF, while 58% of the PAHs by mass in AM were unaccounted for by RPF, which is a primary limitation of relying on RPF for estimating potency of mixtures. Additional cancer-relevant regulatory values, such as RFC, RFD, OSF and IUR were downloaded from databases, prioritized in order of availability from EPA IRIS, and then missing values were predicted using the CTV in silico prediction approach to fill most missing values (Supplemental File S2). Cancer-relevant risk and classification values from IRIS, and IARC cancer hazard classifications were included for completeness. While the applicability domain was high for almost all predicted values, indicating low confidence in those predictions, those values were included in the analysis to provide inhalation-relevant risk values for comparison.
Identifying Co-Modulated Genes associated with Cancer RPF
Overall, this study evaluates molecular mechanisms related to PAH cancer risk through coexpression analysis of global transcriptomic data collected in vitro with regulatory values relevant for PAH cancer risk. The effects of PAH and PAH mixture exposure in 3D HBEC were investigated using a transcriptomic profiling approach through RNAseq analysis. HBEC (n=4 per treatment) were treated with both individual PAHs and PAH mixtures, including 10, 100, and 500 ug/ml BAP, 10 ug/ml DBC, 100 ug/ml PHE, 500 ug/ml PYR, 500 ug/ml BAN, 1500 ug/ml CTE and 250 ug/ml AM, as proof-of-concept for utilizing coexpression analysis to identify genes co-modulated with cancer risk and regulatory values for PAH chemicals. Raw and normalized sequencing files are available online at NCBI Gene Expression Omnibus (GSE128471 and GSE156147). Over 60,000 mRNA transcripts were mapped and evaluated, and 13,644 genes were identified as statistically significant (q <0.05). The number of genes that showed significant differential expression varied according to each exposure condition, with numbers ranging from 3 (pyrene) to over 9000 (air mixture). Because the number of significantly regulated genes varied so highly between exposure groups, it was advantageous to employ an approach that evaluated co-modulated expression profiles regardless of significant differential expression.
This first tier of the analysis identified and prioritized module eigengenes, or gene modules, linked to RPF. Twenty-three gene modules were identified through WGCNA (Fig. 1A), representing groups of genes that are co-modulated across PAH and PAH mixtures treatments. Seven modules were significantly correlated to RPF cancer risk (Table 1). The top most significant positively and negatively correlated modules associated with RPF were prioritized for further analysis to identify which genes, cellular networks and processes were most co-modulated and involved in the processes of cellular response to carcinogenic PAH treatment. One module (“MEturquoise”) was identified as the most significantly positively correlated with RPF (p=0.01), while another module (“MEred”) was identified as the most significantly negatively correlated with RPF (p=0.0007). The MEturquoise module identified 2078 total co-modulated transcripts and included 7 miRNAs and 303 lncRNAs (Supplemental File S3). This module contained co-modulated genes related to cell cycle and inflammation, including breast cancer type 1 susceptibility gene (BRCA1), breast cancer type 2 susceptibility gene (BRCA2), nuclear receptor subfamily 2 group F member 2 (NR2F2), tumor protein p53 regulated apoptosis inducing protein 1 (TP53AIP1), JunB proto-oncogene, AP-1 transcription factor subunit (JUNB), and heme oxygenase 1 (HMOX1) (Fig. 1B). In the MEred gene module, 1021 transcripts were found to be significantly negatively co-modulated with RPF (Supplemental File S4). Many of these genes are downregulated in response to RPF and include 2 miRNAs and 126 lncRNAs (Fig. 1C). These include genes important for cell motility junction organization, including formin 1 (FMN1), dynein cytoplasmic 2 light intermediate chain 1 (DYNC2LI1), dynein axonemal light chain 1 (DNAL1), and claudin 8 (CLDN8).
Figure 1. Module-trait relationships and genes of interest (A) Module-trait relationships matrix. WGCNA identification of gene modules correlated to PAH cancer risk, calculated through RPF.
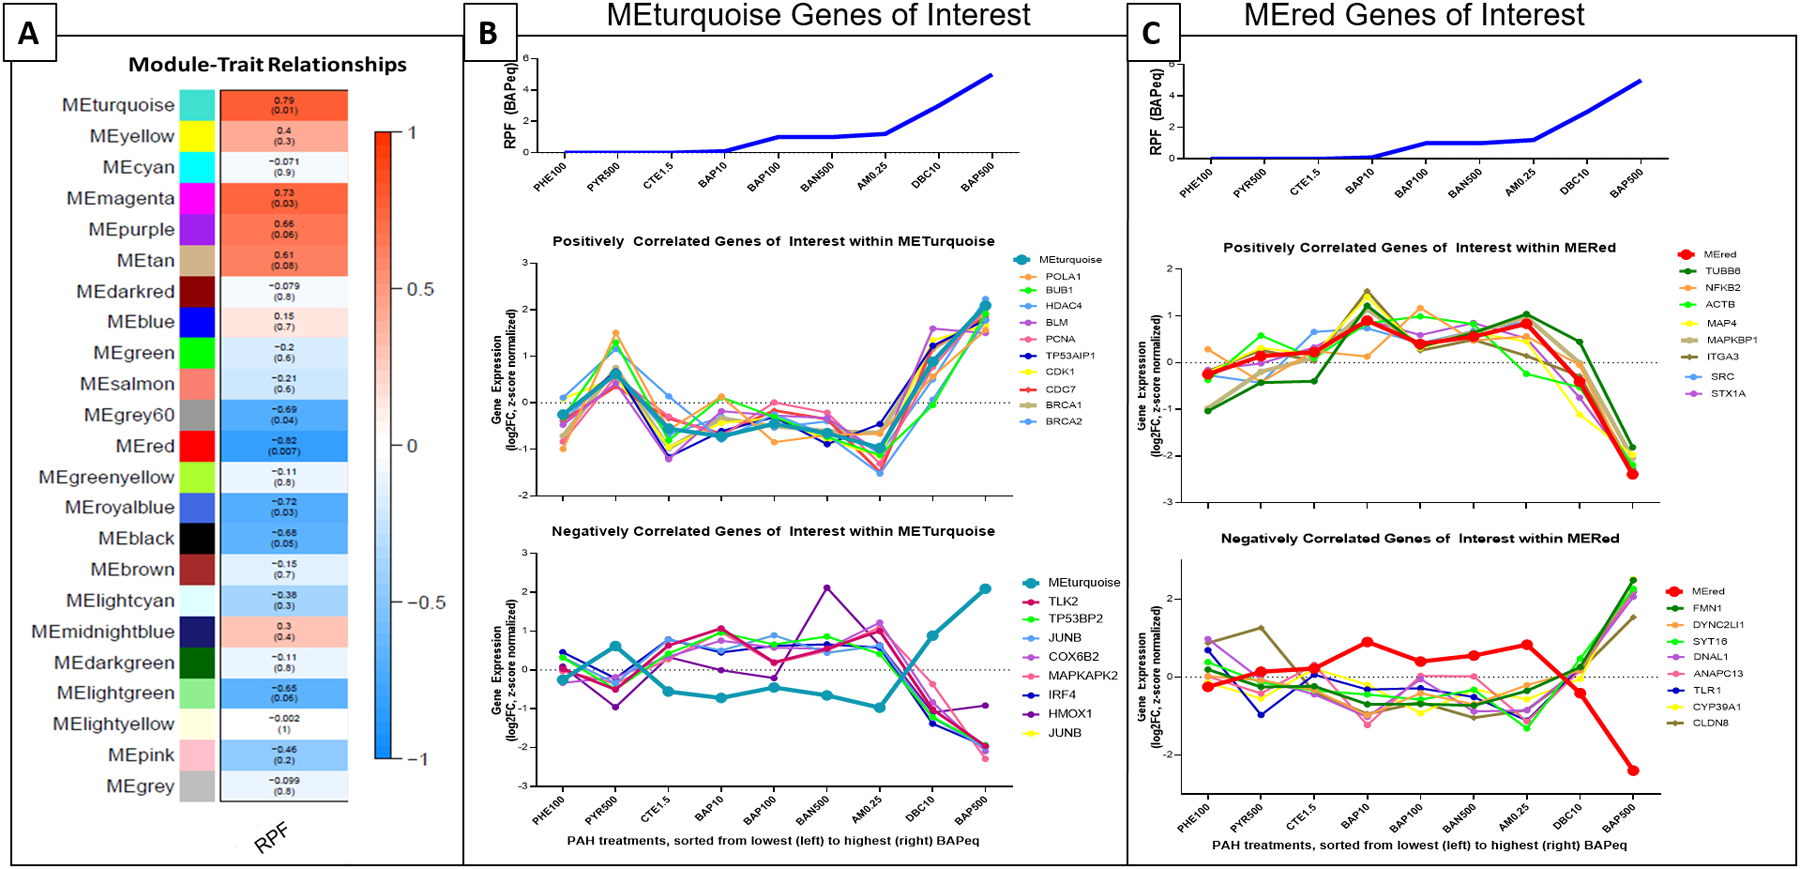
Seven module eigengenes (MEs) were highly correlated with RPF. Degree of correlation is colored, with red as positive and blue as negative, and p-values in parentheses. (B) MEturquoise genes of Interest. The most positively correlated module eigengene (“MEturquoise”) was prioritized for evaluation; genes of interest that had expression levels correlated to MEturquoise are shown. Expression levels are Z-score normalized. (C) MEred genes of interest. The most significantly negatively correlated module eigengene (“MEred”) was priotized for evaluation; genes of interest shown, ranked by RPF, with expression levels Z-score normalized.
Table 1.
Gene modules significantly (p< 0.05) associated with RPF.
| Module | Correlation | p-value |
|---|---|---|
| Turquoise | 0.79 | 0.01 |
| Magenta | 0.73 | 0.03 |
| Lightgreen | −0.65 | 0.05 |
| Black | −0.68 | 0.05 |
| Grey60 | −0.69 | 0.04 |
| Royalblue | −0.72 | 0.03 |
| Red | −0.82 | 0.007 |
Network Analysis of Co-modulated Genes in Prioritized Modules
To further assess biological relevance of the genes identified in each prioritized module, a pathway enrichment analysis of MEturquoise and MEred was conducted (Fig 2). Network analysis of genes was used to identify biological processes that were significantly enriched (FDR<0.05) within both prioritized modules, as well as processes uniquely enriched by one module and not the other. These biological processes were organized into broad biological categories for direct comparison between modules. Genes within the positively correlated MEturquoise module were significantly enriched (p<0.05) for biological processes related to cell cycle regulation, DNA damage, signal transduction, and cardiac development (Fig 2). These biological process categories were uniquely enriched by the MEturquoise module and MEred did not share any significant enrichment in these functional categories. In contrast, genes within the MEred module were significantly enriched (p<0.05) for processes related to cell adhesion, cytoskeleton, protein folding, transcription, and translation. Genes within both modules were enriched for processes related to inflammation (9 specific processes enriched by MEturquoise, and 15 specific processes enriched by MEred).
Figure 2. Network category table of gene modules MEturquoise and MEred that are most significantly correlated to PAH RPF.
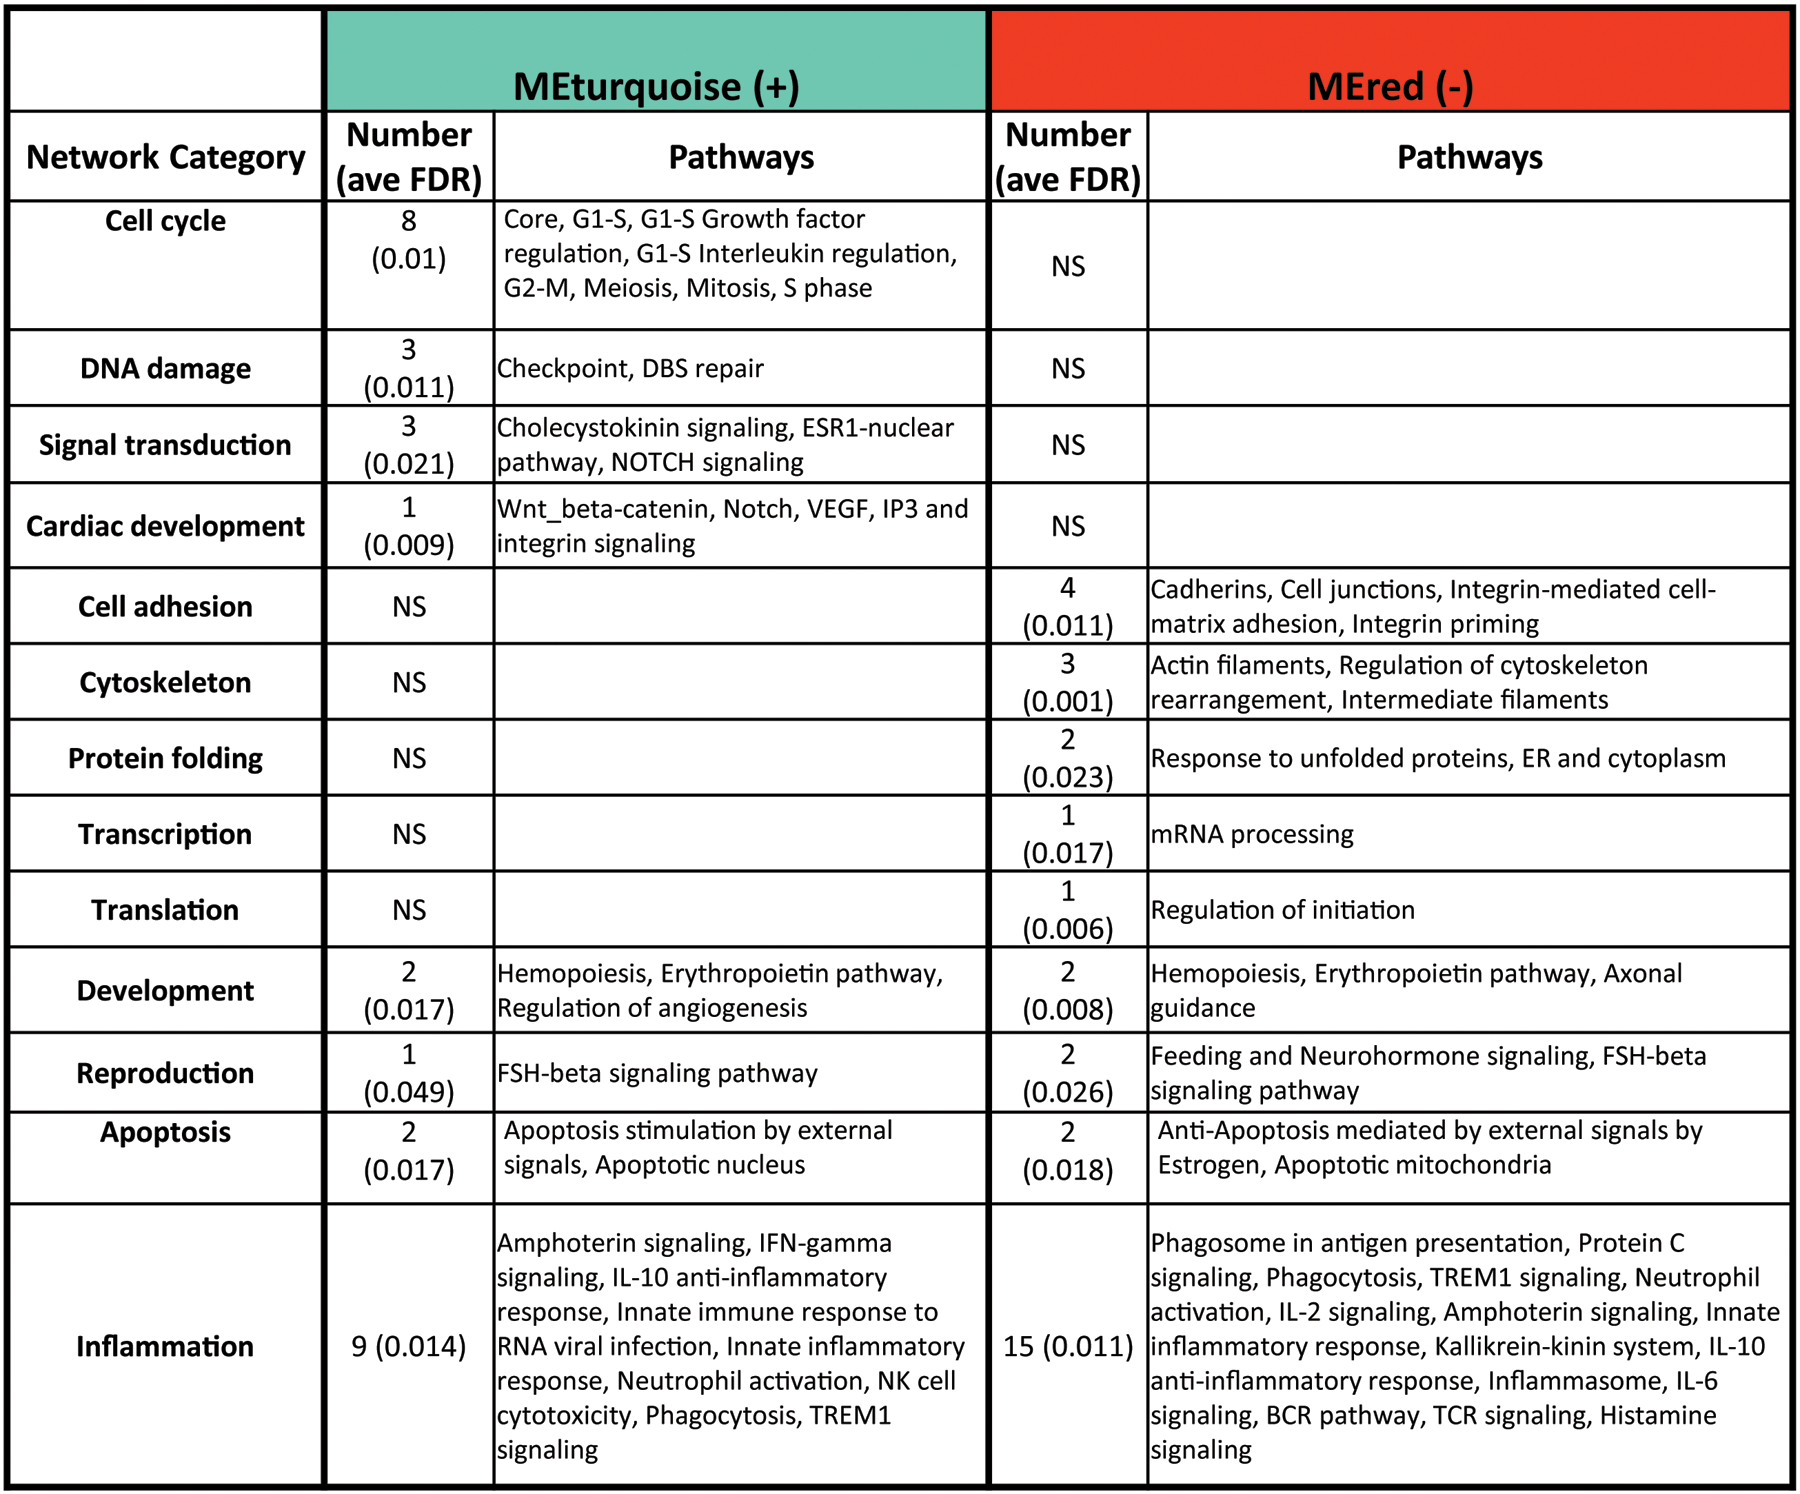
Pathway enrichment analysis was conducted, and a broader network category-level significant enrichment score was calculated. Numbers indicate number of pathways enriched under each network category, and ave FDR (average false discovery rate) shown in parentheses. Distinct biological networks were enriched by MEturquoise and MEred, as well as several network categories commonly enriched, notably Inflammation.
To study network regulation of the genes in each prioritized pathways, process networks were visualized by comparing module membership of network genes. The Cell Cycle S phase network was the most significantly enriched network (FDR=1.16E-09) unique to MEturquoise (Fig 3A), while the Cytoskeleton-Actin filaments network was the most significantly enriched network (FDR=4.24E-06) unique to MEred (Fig 3B). The networks were analyzed through Cytoscape (v3.8.0) with the size of the nodes in the network mapped to calculated betweenness centrality for each gene and edges mapped to annotated interactions (undirected) from Metacore. The betweenness centrality parameter represents the extent to which a vertex is in the shortest path between other vertices. Genes with high betweenness centrality measures likely represent important regulators in biological processes. In the Cell Cycle S phase gene network, the top gene nodes with the highest centrality measures from MEturquoise were cyclin dependent kinase 1 (CDK1), minichromosome maintenance complex component 2 (MCM2), and proliferating cell nuclear antigen (PCNA). In the Cytoskeleton-Actin filaments network, the gene nodes with the highest centrality measures from MEred included actin gamma 1 (ACTG1), SRC proto-oncogene, non-receptor tyrosine kinase (SRC), actin beta (ACTB), and cortactin (CTTN). All of these genes were also identified as significantly over-connected hubs within the networks (p<0.005) based on the number of shared edges with network members.
Figure 3. Gene networks showing most significantly enriched networks associated with prioritized gene modules significantly correlated to PAH RPF. (A) MEturquoise significant enrichment of the Cell cycle S phase gene network, and (B) MEred significant enrichment of the Cytoskeleton actin filament gene network.
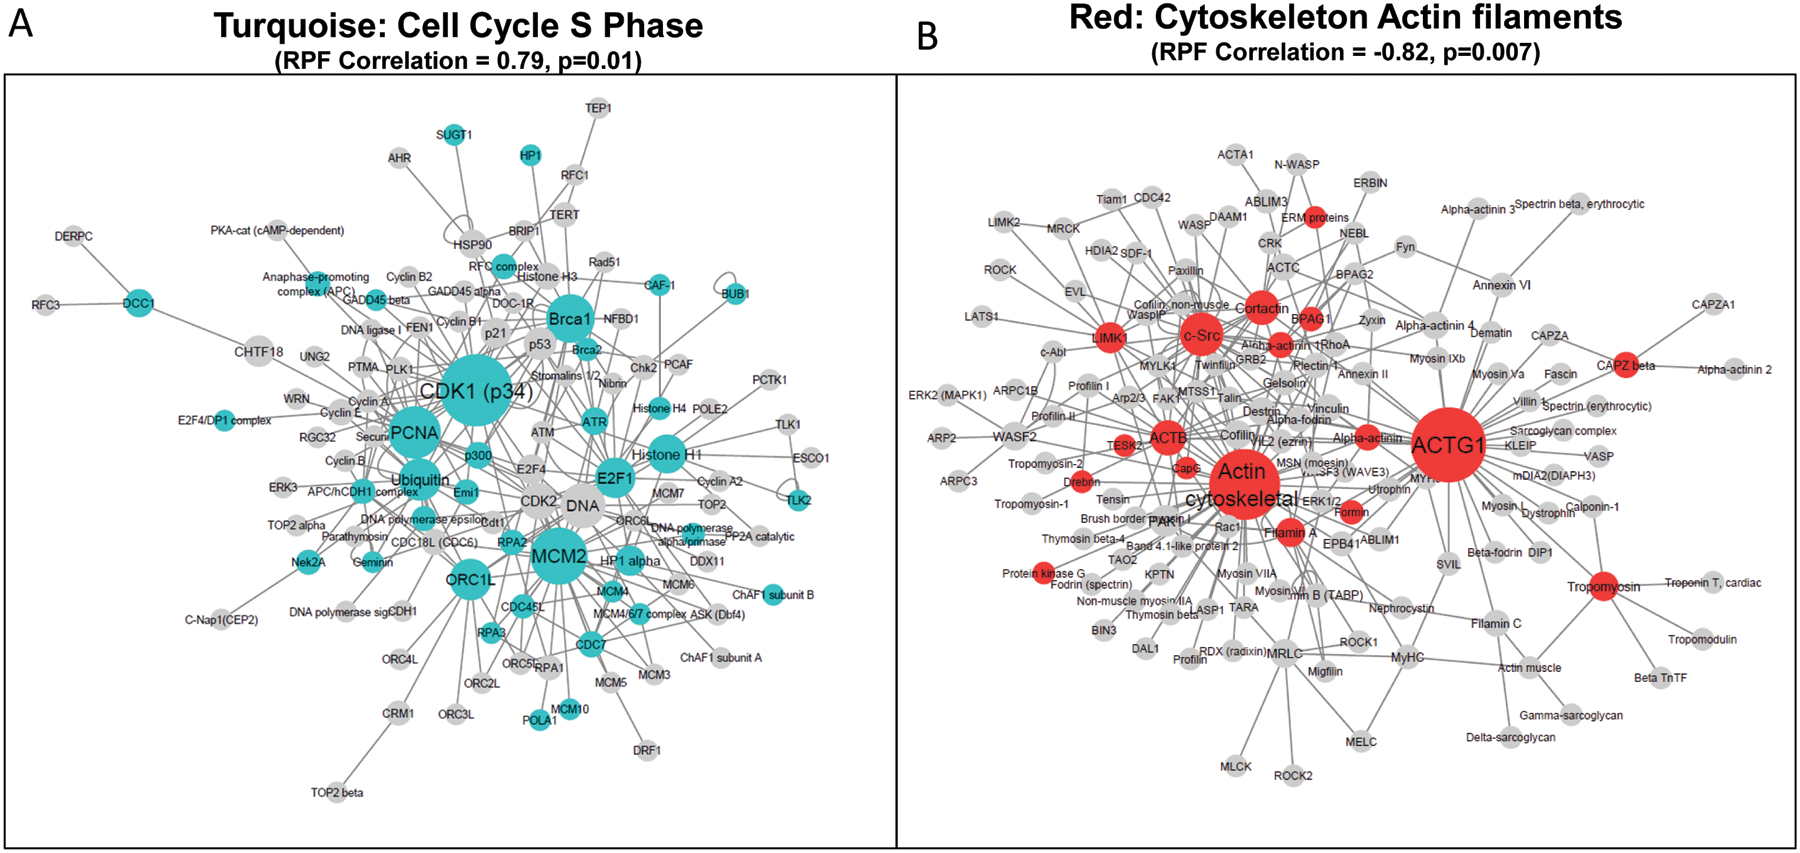
Node sizes denote betweennenss centrality measures calculated in each network. A larger node, or “bottleneck gene” thus represents a gene or biomolecule that stands in between the shortest paths connecting the maximum number of neighboring nodes to each other.
Identifying Co-Modulated Genes associated with Additional Cancer Regulatory Values
To evaluate relationships between co-modulated genes and regulatory values and hazard classifications, we performed a second analysis to identify co-modulated genes associated with additional database-derived values, particularly inhalation-relevant values such as IUR, RfC, OSF, RfD, and IRIS cancer risk values and IARC cancer hazard classifications, and compared to RPF (Fig. 4). The gene modules that correlated most significantly with RPF were MEfive, at p = 0.02 (positive correlation) and MEfourteen, at p = 0.02 (negative correlation) (Figure 4 and Table 2). A pathway enrichment analysis on the transcripts from MEfive and MEfourteen identified processes related to transcription, translation, and cell cycle regulation as among the top most significantly (p<0.05) enriched. Certain regulatory and hazard classifications’ correlations were found to be more similar to RPF’s module correlations than other regulatory values. Specifically, RPF and RfD did not share any significantly correlated module eigengenes; however RPF shared two significantly correlated modules with OSF. When the regulatory value groups’ overall correlations were evaluated through unsupervised hierarchical clustering, we found that RPF’s correlations to the module eigengenes were the most similar to IARC hazard classifications, followed by IRIS, then OSF, IUR, RfD, and RfC (Fig. 4). Through this analysis, we observed that select module eigengenes were significantly correlated with RPF, yet different module eigengenes were significantly correlated with different risk value types. MEthirteen was highly significantly correlated (p=3E-4) with OSF, while IUR was significantly linked to MEten. These uniquely correlated modules suggest that a combined approach of multiple regulatory values can be used to identify potential biomarkers that may have greater applications in chemical safety and hazard assessment.
Figure 4. Module-trait relationship correlation matrix linking module eigengenes with risk values.
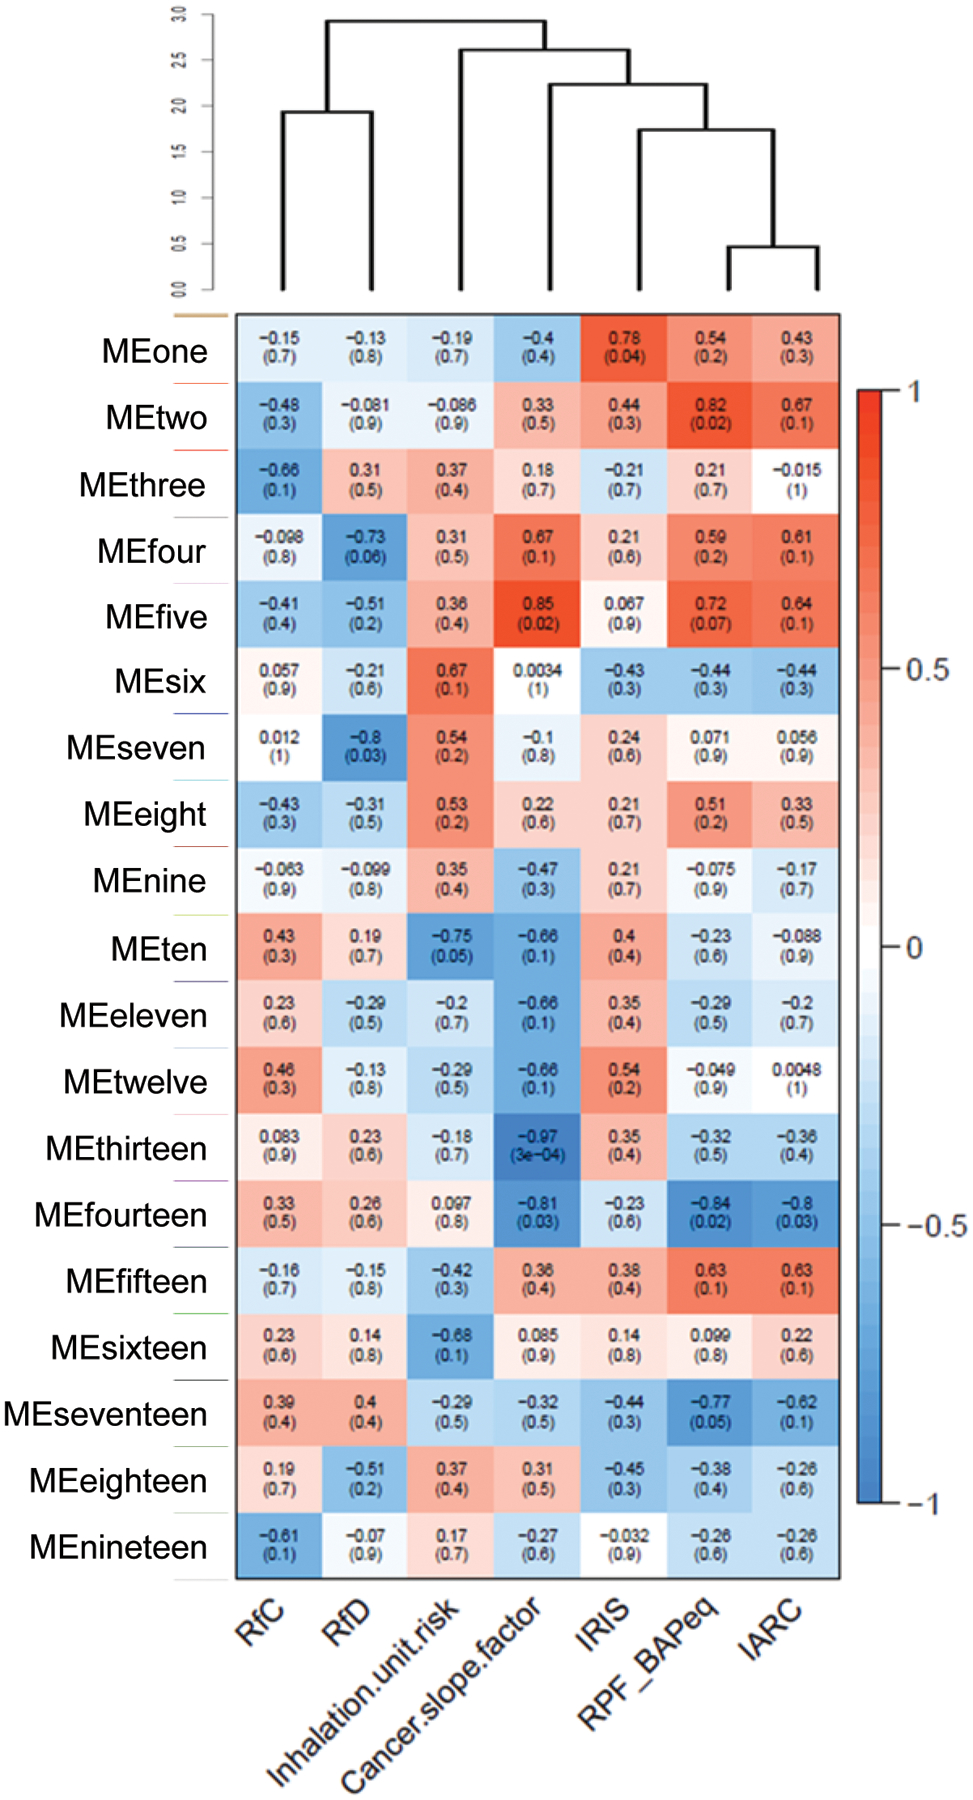
WGCNA identification of gene modules significantly correlated to risk values and cancer categorizations (RfC, RfD, inhalation unit risk, oral slope factor, RPF, and IRIS and IARC carcinogen classes). Correlation matrix shows that several module eigengenes (MEs) were highly correlated with PAH cancer risk values (RPF), as well as correlated in common between RPF, OSF, and IARC classes. Unsupervised hierarchical clustering was performed on the correlation values and the dendrogram identifies RPF and IARC as having the most similar module correlation patterns. Degree of correlation is colored, with red as positive and blue as negative, and p-values in parentheses.
Table 2.
Gene modules significantly (p< 0.05) associated with cancer risk values.
| Module | Correlation (max) |
p-value (min) |
Risk value(s)* |
|---|---|---|---|
| Two | 0.82 | 0.02 | RPF |
| Five | 0.85 | 0.02 | OSF, RPF |
| Fourteen | −0.84 | 0.02 | OSF, RPF, IARC |
| Seventeen | −0.77 | 0.05 | RPF |
Note that IARC is a cancer classification value (as opposed to risk)
DISCUSSION
As the toxicology community shifts towards in vitro testing and computational biology, novel approaches in transcriptional data analyses must be developed and refined to fill unmet needs in chemical hazard assessment46. The ultimate goal of toxicity testing is to generate and understand data to protect the public and environment from harmful chemicals. However, traditional in vivo toxicity testing is limited in its throughput and capacity to provide mechanistic information linking apical endpoints to the underlying processes involved in chemical toxicity47. Current “-omics” level approaches evaluating PAH carcinogenicity have focused on identifying chemical-specific mechanisms and been largely successful contributing towards development of predictive approaches of chemical MOA24,48–51. However, past studies have not focused on identifying broader patterns in affected biomolecules across different parameters of PAHs, such as cancer risk. Here, we evaluated the transcriptional signatures associated with a range of carcinogenic PAHs tested in a 3D in vitro airway epithelium and utilized a WGCNA approach to identify gene modules significantly correlated to increasing cancer risk calculated through RPF.
Overall, we identified groups of genes with similar expression patterns that were significantly correlated to PAH cancer RPF estimates. Through our co-expression analysis, we identified multiple co-modulated gene clusters significantly correlated with RPF. Genes within the two most significantly correlated modules were enriched for processes of cell cycle regulation and cytoskeleton, suggesting the importance of these processes for cancer risk associated with RPF. We also evaluated additional risk values both specific and non-specific to inhalation. Our expanded co-expression analysis identified shared gene modules among RPF, IARC hazard classes, and cancer slope factor indicating similarity in these values for PAH cancer risk.
Carcinogenic PAH exposure is associated with alterations in cell cycle S phase gene regulation
This study identified cell cycle S phase genes as an important and highly enriched pathway associated with a module of high interest associated with cancer RPF values, MEturquoise. MEturquoise genes were significantly positively correlated with increased RPF estimates. Our results are consistent with other findings that PAH exposure is linked to alterations in cell cycle processes. Previous research has identified dysregulation of cell proliferation as a potential mechanism of BAP and BAN activity52. The p53 signaling pathway is also activated in response to stress, which includes DNA damage53. Several genes identified in MEturquoise (Fig 1B) (i.e. TP53BP2 and MDM2) are involved in p53 signaling54–56. Cyclin-dependent kinase (CDK1) was also identified as a gene of interest in MEturquoise, and normally functions in cell cycle progression via S phase initiation57. Dysregulation of these signaling pathways may be important in early cellular responses to PAH exposure. A well-understood mechanism of BAP carcinogenesis is its genotoxic activity forming diolepoxide DNA adducts58–61. Our findings support several reports that exposure to BAP can cause S phase arrest through DNA damage signaling52,62,63.
Bottleneck genes identified in the network (CDK1, MCM2, PCNA) have roles central to controlling cell cycle progression, including M-phase transition, and responding to DNA damage (Fig. 3A). However, their involvement with environmental carcinogens have not been clearly established. Our network analysis identified several highly connected bottleneck genes central to the network, which include the MCM2, a regulator of DNA synthesis, and CDK1, which controls progression into S phase and M-phase transition of the cell cycle and induces senescence in response to DNA damage64–67. Malfunction or dysregulation of these proteins have been linked to the development of cancers in multiple tissues, including lung and breast67–71. While BAP exposure has previously been linked to alterations in CDK1 and MDM2 activity, the findings of this network analysis support S phase gene regulation as a major cellular network perturbed by carcinogenic PAH exposure62,63,72.
Carcinogenic PAH exposure dysregulates actin cytoskeleton gene networks
In our analysis of prioritized MEred module genes significantly correlated to RPF, we identified the cytoskeleton actin filament network as a top negatively correlated gene network to PAH cancer risk. Several genes (ACTG1, ACTB, SRC) were also identified as bottleneck genes with high betweenness centrality measures (Fig. 3B). These findings suggest that genes integral to actin cytoskeleton structure, maintenance, and regulation, are negatively associated with increased PAH cancer risk. Similar mechanistic studies also found that short-term exposure to PAHs or PAH-containing mixtures result in the down-regulation of several cell adhesion, motility, and cytoskeletal-involved processes, including epithelial-mesenchymal transition32,73–76. These processes can be indicators of cancer promotion and progression, and can co-regulate in complex signaling networks during cancer progression. Actin filament reorganization is directly responsible for driving cancer cell motility, morphological changes, and alterations in extracellular matrix and adhesion77–79. Additionally, actin-based adhesion protein complexes are integral in linking cells via cell-cell adhesion and to the extracellular matrices. Taken together, these findings support the role of actin cytoskeletal networks as early biomarkers and indicators of cellular changes affected by carcinogenic PAH exposure.
Comparisons of regulatory values and associated gene modules
PAH cancer risk assessment has traditionally relied on the use of RPF estimates available only for a subset of PAHs13. In this study, we adapted WGCNA in a novel manner to identify genes similarly associated to RPF and other risk values and hazard classifications. Notably, we identified overlap in significant gene module membership between RPF and at least one other risk value in two modules. We also found that RPF correlation patterns were the most similar to that of IARC cancer classes. These results suggest that the RPF approach currently has more similar hazard designations towards chemicals, compared to IARC classifications, which classifies chemicals as carcinogens based on weight of evidence80–82. Inversely, many chemicals, including heterocyclic PAHs, present in PAH mixtures evaluated did not have RPF estimates nor IARC classifications; yet had OSF and IUR values. While direct comparisons between differing regulatory and risk values is not feasible, this analysis focused on identifying shared gene clusters and exploring correlations across risk values. There were also several challenges and limitations involved with using RPF and risk values. The RPF estimates available to calculate BAPeqs were derived from murine and rodent models from studies where animals were exposed orally and through intraperitoneal injection, which do not represent typical routes of PAH exposures for human. Most importantly, inhalation was not considered in deriving RPF estimates. The IURs we included from CTV completed our trait table, however a majority of the chemical values sourced for chemical mixtures were predicted from CTV, rather than experimentally derived. CTV was a useful tool in supplementing data-poor chemicals with predicted health regulatory values. However, this data was frequently low confidence, from CTV’s high percent of applicability domain. Additionally, the second tier of our analysis did not allow taking chemical dose into consideration; only one dataset per chemical was able to be associated to database-derived regulatory and hazard values.
Advantages of identifying co-modulated gene sets across cancer risk values
Data generation from chemical transcriptional profiling has yielded a wealth of chemical-gene signatures; however researchers lack adequate measures to understand broader patterns across chemical groups. The results from this study demonstrate a novel and effective method to identify gene associations across multiple chemicals and parameters. There were several advantages to using RPF as the primary chemical risk value for identification of co-modulated gene associations. RPF estimates are derived through a weight of evidence approach, and so RPF values are substantiated by in vivo tumorigenic evidence13. Typically, multiple chronic rodent cancer bioassays are evaluated towards the development of an RPF estimate. We identified cellular networks positively and negative associated with cancer risk in the 3D HBEC model, and our findings supported several reports in the literature, indicating that short-term gene signatures can be particularly useful in identifying genes linked to cancer. A major benefit of a co-expression approach is that subtle gene changes and biological interactions may be captured28, allowing identification of similarly regulated gene networks. Previous research using WGCNA has found that gene modules identified in drug-induced hepatocyte transcriptional changes are correlated to adverse outcomes and toxicity83; however some of the top ranked gene modules identified had little biological annotation, indicating a unique capability of this approach84. Investigation of these poorly annotated genes and lesser understood signaling networks may prove useful in developing novel biomarkers to identify potential drivers of chemical toxicity. In this study, we identified 9 miRNAs and over 300 lncRNAs as significantly correlated with PAH cancer risk. Thus there is high potential for identifying novel or understudied biomarkers related to PAH-specific cancer risk through applications of WGCNA. In addition, expansion of this analysis to include more PAHs of varying carcinogenic potential could help strengthen gene associations and identify broader patterns across carcinogenic potency.
CONCLUSIONS
This study examined relationships between co-modulated gene sets and chemical risk values relevant to human cancer risk, with the goal of identifying key pathways, and biomarkers linked to cancer risk of PAH and PAH mixtures. For the first time, PAH-responsive genes were linked to RPF through a quantitative systems biology approach. We prioritized positively and negatively associated modules for further study, and these genes significantly enriched distinct biological functions including cell cycle, cytoskeleton, and inflammation. This study also identified module eigengenes significantly associated with additional regulatory values and hazard classifications including IARC classifications, oral cancer slope factors, and inhalation unit risks. Some regulatory values (IARC, IRIS, OSF) shared greater numbers of commonly correlated modules with RPF than other regulatory values (IUR, RfC, RfD), suggesting potential value in using them when RPF is unavailable. This study shows the potential for using transcriptional signatures in response to short-term chemical exposures to identify biomarkers and associations between regulatory values and biological activity. Such an approach could be used to relate organotypic, human in vitro-derived toxicogenomics information towards regulatory applications in the near future.
Supplementary Material
Supplemental File S1. Chemical composition of the artificial air mixture.
Supplemental File S2. Summary of risk regulatory values (RPF, RfC, RfD, OSF, IUR, IARC, IRIS).
Supplemental File S3. List of genes in the MEturquoise module.
Supplemental File S4. List of genes in the MEred module.
Funding Sources
This work was supported by the National Institute of Environmental Health Sciences Superfund Basic Research Program, National Institute of Health, P42 ES016465 and by Public Health Service grant T32ES07060.
Abbreviations
- ACTB
actin beta
- ACTG1
actin gamma 1
- AM
simulated air mixture
- BAN
benz[a]anthracene
- BAP
benzo[a]pyrene
- BAPeq
benzo[a]pyrene equivalents
- BRCA1
breast cancer type 1 susceptibility gene
- BRCA2
breast cancer type 2 susceptibility gene
- CDK1
cyclin-dependent kinase 1
- CLDN8
claudin 8
- CTE
coal tar extract
- CTTN
cortactin
- CTV
Conditional Toxicity Value Predictor
- DBC
dibenzo[def,p]chrysene
- DNAL1
dynein axonemal light chain 1
- DYNC2LI1
dynein cytoplasmic 2 light intermediate chain
- FMN1
formin 1
- HBEC
human bronchial epithelial cells
- HMOX1
heme oxygenase 1
- IUR
inhalation unit risk
- MCM2
minichromosome maintenance complex component 2
- ME
module eigengene
- JUNB
JunB proto-oncogene, AP-1 transcription factor subunit
- NR2F2
nuclear receptor subfamily 2 group F member 2
- OSF
oral slope factor
- PAH
polycyclic aromatic hydrocarbon
- PBS
phosphate buffered saline
- PCNA
proliferating cell nuclear antigen
- PHE
phenanthrene
- RfC
reference concentration
- RfD
reference dose
- RPF
relative potency factor
- SRC
SRC proto-oncogene, non-receptor tyrosine kinase
- U.S. EPA
United States Environmental Protection Agency
- TEER
transepithelial electrical resistance
- TP53AIP1
tumor protein p53 regulated apoptosis inducing protein 1
- WGCNA
weighted gene co-expression analysis
Footnotes
The authors declare they have no competing financial interests.
REFERENCES
- 1.Bojes HK & Pope PG Characterization of EPA’s 16 priority pollutant polycyclic aromatic hydrocarbons (PAHs) in tank bottom solids and associated contaminated soils at oil exploration and production sites in Texas. Regulatory Toxicology and Pharmacology 47, 288–295, doi: 10.1016/j.yrtph.2006.11.007 (2007). [DOI] [PubMed] [Google Scholar]
- 2.Andersson JT & Achten C Time to Say Goodbye to the 16 EPA PAHs? Toward an Up-to-Date Use of PACs for Environmental Purposes. Polycyclic Aromatic Compounds 35, 330–354, doi: 10.1080/10406638.2014.991042 (2015). [DOI] [PMC free article] [PubMed] [Google Scholar]
- 3.Witt G & Siegel H The Consequences of the Oder Flood in 1997 on the Distribution of Polycyclic Aromatic Hydrocarbons (PAHs) in the Oder River Estuary. Marine Pollution Bulletin 40, 1124–1131, doi: 10.1016/S0025-326X(00)00066-7 (2000). [DOI] [Google Scholar]
- 4.Witter B, Winkler M & Friese K Depth Distribution of Chlorinated and Polycyclic Aromatic Hydrocarbons in Floodplain Soils of the River. Acta hydrochimica et hydrobiologica 31, 411–422, doi: 10.1002/aheh.200300501 (2003). [DOI] [Google Scholar]
- 5.Genualdi SA et al. Trans-Pacific and Regional Atmospheric Transport of Polycyclic Aromatic Hydrocarbons and Pesticides in Biomass Burning Emissions to Western North America. Environmental science & technology 43, 1061–1066, doi: 10.1021/es802163c (2009). [DOI] [PMC free article] [PubMed] [Google Scholar]
- 6.Killin RK, Simonich SL, Jaffe DA, DeForest CL & Wilson GR Transpacific and regional atmospheric transport of anthropogenic semivolatile organic compounds to Cheeka Peak Observatory during the spring of 2002. Journal of Geophysical Research: Atmospheres 109, doi: 10.1029/2003JD004386 (2004). [DOI] [Google Scholar]
- 7.Lafontaine S et al. Relative Influence of Trans-Pacific and Regional Atmospheric Transport of PAHs in the Pacific Northwest, U.S. Environmental science & technology 49, 13807–13816, doi: 10.1021/acs.est.5b00800 (2015). [DOI] [PMC free article] [PubMed] [Google Scholar]
- 8.Abdel-Shafy HI & Mansour MSM A review on polycyclic aromatic hydrocarbons: Source, environmental impact, effect on human health and remediation. Egyptian Journal of Petroleum 25, 107–123, doi: 10.1016/j.ejpe.2015.03.011 (2016). [DOI] [Google Scholar]
- 9.Stec AA et al. Occupational Exposure to Polycyclic Aromatic Hydrocarbons and Elevated Cancer Incidence in Firefighters. Scientific reports 8, 2476, doi: 10.1038/s41598-018-20616-6 (2018). [DOI] [PMC free article] [PubMed] [Google Scholar]
- 10.Mehlman MA Causal Relationship from Exposure to Chemicals in Oil Refining and Chemical Industries and Malignant Melanoma. Annals of the New York Academy of Sciences 1076, 822–828, doi: 10.1196/annals.1371.005 (2006). [DOI] [PubMed] [Google Scholar]
- 11.Poutasse CM et al. Discovery of firefighter chemical exposures using military-style silicone dog tags. Environment international 142, 105818, doi: 10.1016/j.envint.2020.105818 (2020). [DOI] [PMC free article] [PubMed] [Google Scholar]
- 12.Hamidi EN, Hajeb P, Selamat J & Abdull Razis AF Polycyclic Aromatic Hydrocarbons (PAHs) and their Bioaccessibility in Meat: a Tool for Assessing Human Cancer Risk. Asian Pacific journal of cancer prevention : APJCP 17, 15–23, doi: 10.7314/apjcp.2016.17.1.15 (2016). [DOI] [PubMed] [Google Scholar]
- 13.EPA, U. S. Development of a relative potency factor (RPF) approach for polycyclic aromatic hydrocarbon (PAH) mixtures, <http://cfpub.epa.gov/ncea/cfm/recordisplay.cfm?deid=194584> (2010).
- 14.Zavala J et al. New Approach Methods to Evaluate Health Risks of Air Pollutants: Critical Design Considerations for In Vitro Exposure Testing. International journal of environmental research and public health 17, doi: 10.3390/ijerph17062124 (2020). [DOI] [PMC free article] [PubMed] [Google Scholar]
- 15.Lee SJ et al. Distinguishing between genotoxic and non-genotoxic hepatocarcinogens by gene expression profiling and bioinformatic pathway analysis. Scientific reports 3, 2783, doi: 10.1038/srep02783 (2013). [DOI] [PMC free article] [PubMed] [Google Scholar]
- 16.Watanabe T et al. Discrimination of genotoxic and non-genotoxic hepatocarcinogens by statistical analysis based on gene expression profiling in the mouse liver as determined by quantitative real-time PCR. Mutation Research/Genetic Toxicology and Environmental Mutagenesis 747, 164–175, doi: 10.1016/j.mrgentox.2012.04.011 (2012). [DOI] [PubMed] [Google Scholar]
- 17.Cui Y & Paules RS Use of transcriptomics in understanding mechanisms of drug-induced toxicity. Pharmacogenomics 11, 573–585, doi: 10.2217/pgs.10.37 (2010). [DOI] [PMC free article] [PubMed] [Google Scholar]
- 18.Chepelev N et al. Integrating toxicogenomics into human health risk assessment: Lessons learned from the benzo[a] pyrene case study. Critical reviews in toxicology 45, 44–52, doi: 10.3109/10408444.2014.973935 (2015). [DOI] [PubMed] [Google Scholar]
- 19.Moffat I et al. Comparison of toxicogenomics and traditional approaches to inform mode of action and points of departure in human health risk assessment of benzo[a]pyrene in drinking water. 45, 1–43, doi: 10.3109/10408444.2014.973934 (2015). [DOI] [PMC free article] [PubMed] [Google Scholar]
- 20.Webster AF et al. Impact of Genomics Platform and Statistical Filtering on Transcriptional Benchmark Doses (BMD) and Multiple Approaches for Selection of Chemical Point of Departure (PoD). PloS one 10, e0136764, doi: 10.1371/journal.pone.0136764 (2015). [DOI] [PMC free article] [PubMed] [Google Scholar]
- 21.Xia P, Zhang H, Peng Y, Shi W & Zhang X Pathway-based assessment of single chemicals and mixtures by a high-throughput transcriptomics approach. Environment international 136, 105455, doi: 10.1016/j.envint.2019.105455 (2020). [DOI] [PubMed] [Google Scholar]
- 22.Labib S et al. A framework for the use of single-chemical transcriptomics data in predicting the hazards associated with complex mixtures of polycyclic aromatic hydrocarbons. Archives of toxicology 91, 2599–2616, doi: 10.1007/s00204-016-1891-8 (2017). [DOI] [PMC free article] [PubMed] [Google Scholar]
- 23.Heijne WHM, Kienhuis AS, van Ommen B, Stierum RH & Groten JP Systems toxicology: applications of toxicogenomics, transcriptomics, proteomics and metabolomics in toxicology. Expert Review of Proteomics 2, 767–780, doi: 10.1586/14789450.2.5.767 (2005). [DOI] [PubMed] [Google Scholar]
- 24.Tilton SC et al. Mechanism-Based Classification of PAH Mixtures to Predict Carcinogenic Potential. Toxicological sciences : an official journal of the Society of Toxicology 146, 135–145, doi: 10.1093/toxsci/kfv080 (2015). [DOI] [PMC free article] [PubMed] [Google Scholar]
- 25.Chang Y et al. Classifying polycyclic aromatic hydrocarbons by carcinogenic potency using in vitro biosignatures. Toxicology in vitro : an international journal published in association with BIBRA 69, 104991, doi: 10.1016/j.tiv.2020.104991 (2020). [DOI] [PMC free article] [PubMed] [Google Scholar]
- 26.Zhang B & Horvath S A general framework for weighted gene co-expression network analysis. Stat Appl Genet Mol Biol 4, Article17, doi: 10.2202/1544-6115.1128 (2005). [DOI] [PubMed] [Google Scholar]
- 27.Langfelder P & Horvath S WGCNA: an R package for weighted correlation network analysis. BMC bioinformatics 9, 559, doi: 10.1186/1471-2105-9-559 (2008). [DOI] [PMC free article] [PubMed] [Google Scholar]
- 28.Maertens A, Luechtefeld T, Kleensang A & Hartung T MPTP’s Pathway of Toxicity Indicates Central Role of Transcription Factor SP1. Archives of toxicology 89, 743–755, doi: 10.1007/s00204-015-1509-6 (2015). [DOI] [PMC free article] [PubMed] [Google Scholar]
- 29.Alexander-Dann B et al. Developments in toxicogenomics: understanding and predicting compound-induced toxicity from gene expression data. Mol Omics 14, 218–236, doi: 10.1039/c8mo00042e (2018). [DOI] [PMC free article] [PubMed] [Google Scholar]
- 30.Maertens A, Tran V, Kleensang A & Hartung T Weighted Gene Correlation Network Analysis (WGCNA) Reveals Novel Transcription Factors Associated With Bisphenol A Dose-Response. Frontiers in Genetics 9, doi: 10.3389/fgene.2018.00508 (2018). [DOI] [PMC free article] [PubMed] [Google Scholar]
- 31.Rager JE et al. Benchmark Dose Modeling Estimates of the Concentrations of Inorganic Arsenic That Induce Changes to the Neonatal Transcriptome, Proteome, and Epigenome in a Pregnancy Cohort. Chemical research in toxicology 30, 1911–1920, doi: 10.1021/acs.chemrestox.7b00221 (2017). [DOI] [PMC free article] [PubMed] [Google Scholar]
- 32.Chang Y et al. Comparative mechanisms of PAH toxicity by benzo[a]pyrene and dibenzo[def,p]chrysene in primary human bronchial epithelial cells cultured at air-liquid interface. Toxicology and applied pharmacology 379, 114644, doi: 10.1016/j.taap.2019.114644 (2019). [DOI] [PMC free article] [PubMed] [Google Scholar]
- 33.Trapnell C, Pachter L & Salzberg SL TopHat: discovering splice junctions with RNA-Seq. Bioinformatics (Oxford, England) 25, 1105–1111, doi: 10.1093/bioinformatics/btp120 (2009). [DOI] [PMC free article] [PubMed] [Google Scholar]
- 34.Trapnell C et al. Transcript assembly and quantification by RNA-Seq reveals unannotated transcripts and isoform switching during cell differentiation. Nature biotechnology 28, 511–515, doi: 10.1038/nbt.1621 (2010). [DOI] [PMC free article] [PubMed] [Google Scholar]
- 35.Love MI, Huber W & Anders S Moderated estimation of fold change and dispersion for RNA-seq data with DESeq2. Genome Biology 15, 550, doi: 10.1186/s13059-014-0550-8 (2014). [DOI] [PMC free article] [PubMed] [Google Scholar]
- 36.Williams AJ et al. The CompTox Chemistry Dashboard: a community data resource for environmental chemistry. Journal of Cheminformatics 9, 61, doi: 10.1186/s13321-017-0247-6 (2017). [DOI] [PMC free article] [PubMed] [Google Scholar]
- 37.Wignall JA et al. Conditional Toxicity Value (CTV) Predictor: An In Silico Approach for Generating Quantitative Risk Estimates for Chemicals. Environmental health perspectives 126, 057008, doi: 10.1289/ehp2998 (2018). [DOI] [PMC free article] [PubMed] [Google Scholar]
- 38.Smith ML et al. Time-Course Analysis of Brain Regional Expression Network Responses to Chronic Intermittent Ethanol and Withdrawal: Implications for Mechanisms Underlying Excessive Ethanol Consumption. PloS one 11, e0146257, doi: 10.1371/journal.pone.0146257 (2016). [DOI] [PMC free article] [PubMed] [Google Scholar]
- 39.Nikolsky Y, Kirillov E, Zuev R, Rakhmatulin E & Nikolskaya T Functional analysis of OMICs data and small molecule compounds in an integrated “knowledge-based” platform. Methods in molecular biology (Clifton, N.J.) 563, 177–196, doi: 10.1007/978-1-60761-175-2_10 (2009). [DOI] [PubMed] [Google Scholar]
- 40.Shannon P et al. Cytoscape: a software environment for integrated models of biomolecular interaction networks. Genome Res 13, doi: 10.1101/gr.1239303 (2003). [DOI] [PMC free article] [PubMed] [Google Scholar]
- 41.Assenov Y, Ramírez F, Schelhorn SE, Lengauer T & Albrecht M Computing topological parameters of biological networks. Bioinformatics (Oxford, England) 24, 282–284, doi: 10.1093/bioinformatics/btm554 (2008). [DOI] [PubMed] [Google Scholar]
- 42.Hou MX et al. A new method for mining information of co-expression network based on multi-cancers integrated data. BMC medical genomics 12, 155, doi: 10.1186/s12920-019-0608-2 (2019). [DOI] [PMC free article] [PubMed] [Google Scholar]
- 43.Ozgür A, Vu T, Erkan G & Radev DR Identifying gene-disease associations using centrality on a literature mined gene-interaction network. Bioinformatics (Oxford, England) 24, i277–285, doi: 10.1093/bioinformatics/btn182 (2008). [DOI] [PMC free article] [PubMed] [Google Scholar]
- 44.Ray S, Hossain SMM, Khatun L & Mukhopadhyay A A comprehensive analysis on preservation patterns of gene co-expression networks during Alzheimer’s disease progression. BMC bioinformatics 18, 579, doi: 10.1186/s12859-017-1946-8 (2017). [DOI] [PMC free article] [PubMed] [Google Scholar]
- 45.Riquelme Medina I & Lubovac-Pilav Z Gene Co-Expression Network Analysis for Identifying Modules and Functionally Enriched Pathways in Type 1 Diabetes. PloS one 11, e0156006, doi: 10.1371/journal.pone.0156006 (2016). [DOI] [PMC free article] [PubMed] [Google Scholar]
- 46.Krewski D et al. Toxicity Testing in the 21st Century: A Vision and a Strategy. Journal of Toxicology and Environmental Health, Part B 13, 51–138, doi: 10.1080/10937404.2010.483176 (2010). [DOI] [PMC free article] [PubMed] [Google Scholar]
- 47.Daston G & McNamee P Alternatives to Toxicity Testing in Animals: Challenges and Opportunities. Environmental Health Perspectives - ENVIRON HEALTH PERSPECT, doi: 10.1289/ehp.7723 (2005). [DOI] [Google Scholar]
- 48.Webb-Robertson B-JM, Metz TO, Waters KM, Zhang Q & Rewers M in Statistical Analysis of Proteomics, Metabolomics, and Lipidomics Data Using Mass Spectrometry (eds Susmita Datta & Mertens Bart J. A.) 203–211 (Springer International Publishing, 2017). [Google Scholar]
- 49.Williams A et al. A predictive toxicogenomics signature to classify genotoxic versus non-genotoxic chemicals in human TK6 cells. Data in Brief 5, 77–83, doi: 10.1016/j.dib.2015.08.013 (2015). [DOI] [PMC free article] [PubMed] [Google Scholar]
- 50.Eun JW et al. Discriminating the molecular basis of hepatotoxicity using the large-scale characteristic molecular signatures of toxicants by expression profiling analysis. Toxicology 249, 176–183, doi: 10.1016/j.tox.2008.05.001 (2008). [DOI] [PubMed] [Google Scholar]
- 51.Burczynski ME et al. Toxicogenomics-Based Discrimination of Toxic Mechanism in HepG2 Human Hepatoma Cells. Toxicological Sciences 58, 399–415, doi: 10.1093/toxsci/58.2.399 (2000). [DOI] [PubMed] [Google Scholar]
- 52.Plíšková M, Vondráček J, Vojtěšek B, Kozubík A & Machala M Deregulation of Cell Proliferation by Polycyclic Aromatic Hydrocarbons in Human Breast Carcinoma MCF-7 Cells Reflects Both Genotoxic and Nongenotoxic Events. Toxicological Sciences 83, 246–256, doi: 10.1093/toxsci/kfi040 (2004). [DOI] [PubMed] [Google Scholar]
- 53.Sigal A & Rotter V Oncogenic Mutations of the p53 Tumor Suppressor: The Demons of the Guardian of the Genome. Cancer research 60, 6788 (2000). [PubMed] [Google Scholar]
- 54.Samuels-Lev Y et al. ASPP proteins specifically stimulate the apoptotic function of p53. Molecular cell 8, 781–794 (2001). [DOI] [PubMed] [Google Scholar]
- 55.Sullivan A & Lu X ASPP: a new family of oncogenes and tumour suppressor genes. British Journal of Cancer 96, 196–200, doi: 10.1038/sj.bjc.6603525 (2007). [DOI] [PMC free article] [PubMed] [Google Scholar]
- 56.Iwabuchi K, Bartel PL, Li B, Marraccino R & Fields S Two cellular proteins that bind to wild-type but not mutant p53. Proceedings of the National Academy of Sciences of the United States of America 91, 6098–6102, doi: 10.1073/pnas.91.13.6098 (1994). [DOI] [PMC free article] [PubMed] [Google Scholar]
- 57.Schwermer M et al. Sensitivity to cdk1-inhibition is modulated by p53 status in preclinical models of embryonal tumors. Oncotarget 6, 15425–15435, doi: 10.18632/oncotarget.3908 (2015). [DOI] [PMC free article] [PubMed] [Google Scholar]
- 58.Alexandrov K, Rojas M & Satarug S The critical DNA damage by benzo(a)pyrene in lung tissues of smokers and approaches to preventing its formation. Toxicology letters 198, 63–68, doi: 10.1016/j.toxlet.2010.04.009 (2010). [DOI] [PubMed] [Google Scholar]
- 59.Piberger AL, Krüger CT, Strauch BM, Schneider B & Hartwig A BPDE-induced genotoxicity: relationship between DNA adducts, mutagenicity in the in vitro PIG-A assay, and the transcriptional response to DNA damage in TK6 cells. Archives of toxicology 92, 541–551, doi: 10.1007/s00204-017-2003-0 (2018). [DOI] [PMC free article] [PubMed] [Google Scholar]
- 60.Tarantini A et al. Polycyclic aromatic hydrocarbons in binary mixtures modulate the efficiency of benzo[a]pyrene to form DNA adducts in human cells. Toxicology 279, 36–44, doi: 10.1016/j.tox.2010.09.002 (2011). [DOI] [PubMed] [Google Scholar]
- 61.Tung EW, Philbrook NA, Belanger CL, Ansari S & Winn LM Benzo[a]pyrene increases DNA double strand break repair in vitro and in vivo: a possible mechanism for benzo[a]pyrene-induced toxicity. Mutation research. Genetic toxicology and environmental mutagenesis 760, 64–69, doi: 10.1016/j.mrgentox.2013.12.003 (2014). [DOI] [PubMed] [Google Scholar]
- 62.Alam S et al. Downregulation of Cdc2/CDK1 Kinase Activity Induces the Synthesis of Noninfectious Human Papillomavirus Type 31b Virions in Organotypic Tissues Exposed to Benzo[a]pyrene. Journal of virology 84, 4630, doi: 10.1128/JVI.02431-09 (2010). [DOI] [PMC free article] [PubMed] [Google Scholar]
- 63.Xiao H & Singh SV Cellular response to benzo[a]pyrene-7,8-diol-9,10-epoxide exposure in human lung cancer cells. Cancer research 65, 275 (2005). [Google Scholar]
- 64.Chen X et al. Enrichment of Cdk1-cyclins at DNA double-strand breaks stimulates Fun30 phosphorylation and DNA end resection. Nucleic acids research 44, 2742–2753, doi: 10.1093/nar/gkv1544 (2016). [DOI] [PMC free article] [PubMed] [Google Scholar]
- 65.Fan X & Chen JJ Role of Cdk1 in DNA damage-induced G1 checkpoint abrogation by the human papillomavirus E7 oncogene. Cell Cycle 13, 3249–3259, doi: 10.4161/15384101.2014.953879 (2014). [DOI] [PMC free article] [PubMed] [Google Scholar]
- 66.Müllers E, Silva Cascales H, Burdova K, Macurek L & Lindqvist A Residual Cdk1/2 activity after DNA damage promotes senescence. Aging Cell 16, 575–584, doi: 10.1111/acel.12588 (2017). [DOI] [PMC free article] [PubMed] [Google Scholar]
- 67.Fei L & Xu H Role of MCM2–7 protein phosphorylation in human cancer cells. Cell & Bioscience 8, 43, doi: 10.1186/s13578-018-0242-2 (2018). [DOI] [PMC free article] [PubMed] [Google Scholar]
- 68.Huang T-H et al. Epidermal growth factor receptor potentiates MCM7-mediated DNA replication through tyrosine phosphorylation of Lyn kinase in human cancers. Cancer Cell 23, 796–810, doi: 10.1016/j.ccr.2013.04.027 (2013). [DOI] [PMC free article] [PubMed] [Google Scholar]
- 69.Fei L et al. RACK1 promotes lung cancer cell growth via an MCM7/RACK1/ Akt signaling complex. Oncotarget 8, 40501–40513, doi: 10.18632/oncotarget.17120 (2017). [DOI] [PMC free article] [PubMed] [Google Scholar]
- 70.Yu CH, Xing FY, Zhang JY, Xu JQ & Li YC A combination of mRNA expression profile and miRNA expression profile identifies detection biomarkers in different tumor stages of laryngeal squamous cell carcinoma. Eur Rev Med Pharmacol Sci 22, 7296–7304, doi: 10.26355/eurrev_201811_16266 (2018). [DOI] [PubMed] [Google Scholar]
- 71.Yang W-X, Pan Y-Y & You C-G CDK1, CCNB1, CDC20, BUB1, MAD2L1, MCM3, BUB1B, MCM2, and RFC4 May Be Potential Therapeutic Targets for Hepatocellular Carcinoma Using Integrated Bioinformatic Analysis. BioMed research international 2019, 1245072, doi: 10.1155/2019/1245072 (2019). [DOI] [PMC free article] [PubMed] [Google Scholar]
- 72.Hsing A, Faller D & Vaziri C DNA-damaging aryl hydrocarbons induce Mdm2 expression via p53-independent post-transcriptional mechanisms. The Journal of biological chemistry 275, 26024–26031, doi: 10.1074/jbc.M002455200 (2000). [DOI] [PubMed] [Google Scholar]
- 73.Labib S et al. Comparative transcriptomic analyses to scrutinize the assumption that genotoxic PAHs exert effects via a common mode of action. Archives of toxicology 90, 2461–2480, doi: 10.1007/s00204-015-1595-5 (2016). [DOI] [PMC free article] [PubMed] [Google Scholar]
- 74.Staal YCM, van Herwijnen MHM, van Schooten FJ & van Delft JHM Modulation of gene expression and DNA adduct formation in HepG2 cells by polycyclic aromatic hydrocarbons with different carcinogenic potencies. Carcinogenesis 27, 646–655, doi: 10.1093/carcin/bgi255 (2006). [DOI] [PubMed] [Google Scholar]
- 75.Siddens LK et al. Polycyclic aromatic hydrocarbons as skin carcinogens: Comparison of benzo[a]pyrene, dibenzo[def,p]chrysene and three environmental mixtures in the FVB/N mouse. Toxicology and applied pharmacology 264, 377–386, doi: 10.1016/j.taap.2012.08.014 (2012). [DOI] [PMC free article] [PubMed] [Google Scholar]
- 76.Libalova H et al. Transcriptional response to organic compounds from diverse gasoline and biogasoline fuel emissions in human lung cells. Toxicology in Vitro 48, 329–341, doi: 10.1016/j.tiv.2018.02.002 (2018). [DOI] [PubMed] [Google Scholar]
- 77.Xuan B, Ghosh D, Cheney EM, Clifton EM & Dawson MR Dysregulation in Actin Cytoskeletal Organization Drives Increased Stiffness and Migratory Persistence in Polyploidal Giant Cancer Cells. Scientific reports 8, 11935, doi: 10.1038/s41598-018-29817-5 (2018). [DOI] [PMC free article] [PubMed] [Google Scholar]
- 78.Olson MF & Sahai E The actin cytoskeleton in cancer cell motility. Clin Exp Metastasis 26, 273–287, doi: 10.1007/s10585-008-9174-2 (2009). [DOI] [PubMed] [Google Scholar]
- 79.Bachir AI, Horwitz AR, Nelson WJ & Bianchini JM Actin-Based Adhesion Modules Mediate Cell Interactions with the Extracellular Matrix and Neighboring Cells. Cold Spring Harb Perspect Biol 9, a023234, doi: 10.1101/cshperspect.a023234 (2017). [DOI] [PMC free article] [PubMed] [Google Scholar]
- 80.IARC. Some non-heterocyclic polycyclic aromatic hydrocarbons and some related exposures. IARC Monographs and the Evaluation of Carcinogenic Risks to Humans 92 (2010). [PMC free article] [PubMed] [Google Scholar]
- 81.IARC. Diesel and Gasoline Engine Exhausts and Some Nitroarenes. IARC Monographs and the Evaluation of Carcinogenic Risks to Humans 105 (2013). [PMC free article] [PubMed] [Google Scholar]
- 82.IARC. Air Pollution and Cancer. IARC Scientific Publication 161 (2013). [PubMed] [Google Scholar]
- 83.Sutherland JJ, Jolly RA, Goldstein KM & Stevens JL Assessing Concordance of Drug-Induced Transcriptional Response in Rodent Liver and Cultured Hepatocytes. PLOS Computational Biology 12, e1004847, doi: 10.1371/journal.pcbi.1004847 (2016). [DOI] [PMC free article] [PubMed] [Google Scholar]
- 84.Sutherland JJ et al. Toxicogenomic module associations with pathogenesis: a network-based approach to understanding drug toxicity. The Pharmacogenomics Journal 18, 377–390, doi: 10.1038/tpj.2017.17 (2018). [DOI] [PubMed] [Google Scholar]
Associated Data
This section collects any data citations, data availability statements, or supplementary materials included in this article.
Supplementary Materials
Supplemental File S1. Chemical composition of the artificial air mixture.
Supplemental File S2. Summary of risk regulatory values (RPF, RfC, RfD, OSF, IUR, IARC, IRIS).
Supplemental File S3. List of genes in the MEturquoise module.
Supplemental File S4. List of genes in the MEred module.