

Summary
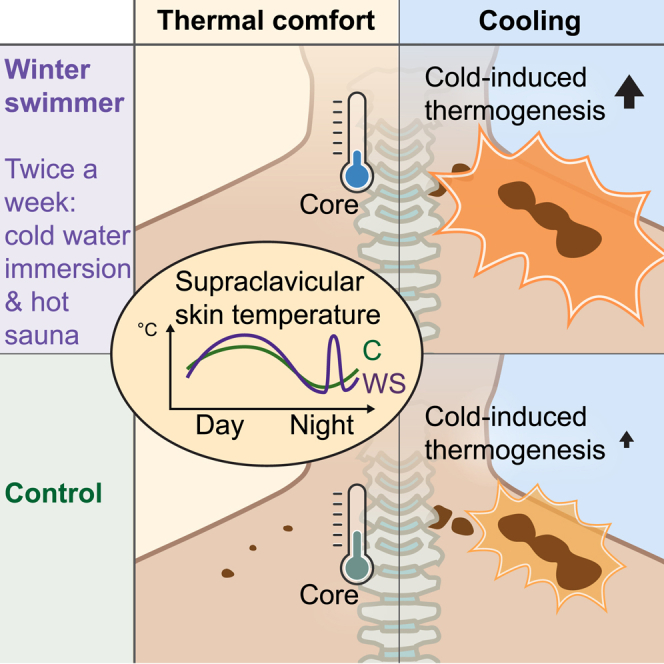
The Scandinavian winter-swimming culture combines brief dips in cold water with hot sauna sessions, with conceivable effects on body temperature. We study thermogenic brown adipose tissue (BAT) in experienced winter-swimming men performing this activity 2–3 times per week. Our data suggest a lower thermal comfort state in the winter swimmers compared with controls, with a lower core temperature and absence of BAT activity. In response to cold, we observe greater increases in cold-induced thermogenesis and supraclavicular skin temperature in the winter swimmers, whereas BAT glucose uptake and muscle activity increase similarly to those of the controls. All subjects demonstrate nocturnal reduction in supraclavicular skin temperature, whereas a distinct peak occurs at 4:30–5:30 a.m. in the winter swimmers. Our data leverage understanding of BAT in adult human thermoregulation, suggest both heat and cold acclimation in winter swimmers, and propose winter swimming as a potential strategy for increasing energy expenditure.
Keywords: human brown fat, cold acclimation, heat acclimation, energy expenditure, cold water immersion, sauna, adipose tissue, thermal comfort, core temperature, human circadian rhythm
Graphical abstract
Highlights
Winter swimmers have a lower core temperature at a thermal comfort state than controls
Winter swimmers had no BAT glucose uptake at a thermal comfort state
Winter swimmers have higher cold-induced thermogenesis than control subjects
Human supraclavicular skin temperature varies with a diurnal rhythm
Søberg et al. find that winter-swimming men, combining cold-water immersion with hot sauna, burn more calories during cooling than controls, despite similar activation of brown fat. The authors propose a lower thermal set point in winter swimmers, reflected by lower core temperature and inactive brown fat at a thermal comfort state.
Introduction
In adult humans, brown adipose tissue (BAT) is present superficially in the supraclavicular area and in deeper regions close to the sympathetic nervous system, including neck, spine, and perirenal depots.1,2 BAT is a thermogenic tissue that uses free fatty acids to produce heat through mitochondrial uncoupling, making it highly energy consuming in cold environments, where thermogenesis is active. In mice, BAT thermogenic gene expression is also regulated with a diurnal rhythm, which is independent of a cold stimulus.3 In humans, BAT shows a diurnal rhythm in terms of glucose and fatty acid uptake;4,5 however, there are to date no records of diurnal regulation of BAT or supraclavicular skin temperature. BAT is induced by sympathetic activation and norepinephrine-induced adrenergic signaling, which in humans has been shown to occur via the β2-adrenergic receptor instead of, as in mice, the β3-adrenergic receptor.6 In humans, intracellular lipid reservoirs in BAT provide fuel for thermogenesis.7 However, BAT activity is also associated with simultaneous uptake of circulating fatty acids and glucose, in which the latter indicates an active BAT state as monitored by positron emission tomography (PET)/computed tomography (CT) scanning combined with injection of the glucose tracer 2-deoxy-2-[18F]fluoro-D-glucose (FDG). Activation of BAT increases the metabolic rate,8 although repeated cooling interventions or chronic pharmacological treatment with the β-adrenergic agonist mirabegron increases insulin sensitivity in association with an increase in cold-responsive BAT.9, 10, 11, 12 Finally, a recent large-scale retrospective study demonstrated an association with BAT activity and lower prevalence of cardiometabolic diseases.13 Molecular characterization and alternative approaches to analyze FDG-PET/CT data indicate that glucose tracer uptake is not fully proportional to the amount of existing BAT.1,14 Adult human BAT is heterogeneously composed of multilocular and unilocular adipocytes and displays a dormant phenotype,14 with lipid accumulation increasing with age15 and glucose uptake strongly declining with age.13 Moreover, cold-induced glucose tracer uptake in BAT varies depending on body mass index (BMI) and insulin sensitivity.16 Given the previously mentioned metabolic benefits, along with the presence of dormant BAT in humans, an improved regulation of BAT in adults could be a potential strategy to counteract the development of metabolic diseases. Immersion in cold water results in sympathetic activation, and winter swimming for 1 min or less increases norepinephrine plasma levels acutely, whereas regularly practiced winter swimming attenuates this increase.17 This adaptation might be related to the increased innervation that occurs during BAT cold acclimation,18 although this had not yet been explored in winter swimmers. Winter swimming is commonly practiced with dips in cold waters (pools, lakes, or sea/ocean), which are alternated with hot sauna sessions. Therefore, winter swimmers could be expected to be acclimated to both cold and hot challenges. With the thermoregulatory role of BAT, we hypothesized that winter swimmers would have a differential regulation of this tissue compared with a control group matched for age, gender, BMI, and fitness. We assessed this by measuring BAT activity using 2-deoxy-2-[18F]fluoro-D-glucose PET scanning as our primary outcome. In a crossover design with interventions performed in randomized order, subjects performed perception-based cooling and thermal comfort state protocols. Results showed an interaction in glucose uptake in BAT when comparing winter swimmers and controls, motivating us to separate and compare the two groups in thermoregulation, metabolism, and diurnal rhythm.
Results and discussion
Human subjects
Previous studies of human BAT have demonstrated great variation in BAT activity, and during downstream characterization, authors have therefore divided samples into BAT high and BAT low based on UCP1 mRNA expression19 or BAT negative and BAT positive based on glucose tracer uptake in BAT in response to cooling.20 Other studies have shown that contributing determinants for BAT activity include age,21 BMI,22,23 and outdoor temperature.24,25 In the current study, we aimed to keep these factors constant. We studied experienced winter swimmers that had performed 2–3 cold-water swimming/dipping sessions per week and at least started on their second winter-swimming season. As most winter swimmers also use sauna, these subjects could be expected to be acclimated to both cold and hot environments. Based on the massive sympathetic activation occurring in response to cold water,26 we hypothesized that winter swimmers would have cold-adapted BAT with high heat production in response to cold. Therefore, we recruited young, healthy men who were winter swimmers (n = 8) and a control group (n = 8) of subjects matched for age, gender, BMI, and maximal oxygen consumption during exhaustive exercise (VO2max). Among the winter swimmers, all expect one subject were using sauna. Control subjects were not using saunas and were not using cold or heat therapies during the study period. Initial characterization of the subjects demonstrated a higher total fat percentage in the control subjects (p < 0.007), despite no difference in BMI. Furthermore, modest differences were observed in fasting blood biochemistry, including lower thyroxine (T4), alkaline phosphatase, and transferrin, and higher potassium levels in the winter swimmers (Table 1; Table S1).
Table 1.
Subject characterization
| Subject characterization | Winter swimmers (n = 7) | Control group (n = 8) | p |
|---|---|---|---|
| Age (years) | 25 (2.5) | 23.6 (2.0) | 0.25 |
| Weight (kg) | 76.7 | 78.9 | 0.55 |
| Physical training/week (h) | 7 | 6 | 0.32 |
| Vegetarian (n) | 1 | 1 | – |
| BMI (kg/m2) | 23.7 (4.8) | 23.3 (1.8) | 0.87 |
| VO2max (mL O2/kg/min) | 53.1 (4.8) | 51.2 (6.0) | 0.50 |
| Fasting plasma insulin (pmol/L) | 37 (15.5) | 33 (11.4) | 0.60 |
| Fasting plasma glucose (mmol/L) | 4.6 (0.3) | 4.5 (0.5) | 0.58 |
| Total cholesterol (mmol/L) | 4.3 (0.9) | 4.0 (0.4) | 0.48 |
| HDL cholesterol (mmol/L) | 1.5 (0.4) | 1.4 (0.2) | 0.53 |
| LDL cholesterol (mmol/L) | 2.7 (0.9) | 2.5 (0.5) | 0.57 |
| Tissue fat (%) | 12.0 (4.6) | 18.2 (4.3) | 0.01 |
| Gynoid fat (%) | 16.6 (6.1) | 23.3 (5.4) | 0.03 |
| Android fat (%) | 16.8 (8.7) | 23.3 (6.9) | 0.12 |
| Resting energy expenditure thermal comfort state (kcal/24 h) | 2,038 (96.0) | 2,005 (209.6) | 0.69 |
| Resting energy expenditure during 30 min cooling (kcal/24 h) | 3,044 (337.2) | 2,560 (348.1) | 0.01 |
| Winter swimming | |||
| Winter-swimming seasons in total | 1.8 (0.9) | – | – |
| Total swims last month | 10.6 (3.3) | – | – |
| Swims/week the last month before experiments | 2.6 (0.1) | – | – |
| Number of immersions/visit | 2.6 (0.8) | – | – |
| Time in water/immersion (min) | 1.4 (2.6) | – | – |
| Sauna users (yes/no) | (7/1) | – | – |
| Number of sauna visits/visit | 2 | – | – |
| Time in sauna/visit (min) | 11.1 (14.3) | – | – |
| Total time immersed in cold water/week (min) | 11 | – | – |
| Total time in sauna heat/week (min) | 57 | – | – |
HDL, high-density lipoprotein; LDL, low-density lipoprotein. Data are given as mean with the standard deviation (SD) in brackets. Differences between groups are evaluated using Student’s unpaired t test. See also Table S1.
Subject characterization and experimental setup
An oral glucose tolerance test demonstrated that all subjects were normal glucose tolerant, according to the criteria of the American Diabetes Association,27 with the exception of one control subject being impaired glucose tolerant (Figures 1A and 1B). The winter swimmer group had lower plasma glucose levels at 120 min after glucose ingestion (Figure 1B), suggesting greater peripheral glucose disposal than in the control group. Although the current research design did not allow for conclusions on a casual effect, our observations are in line with previous studies demonstrating that insulin sensitivity in middle-aged subjects was improved after a winter-swimming season.28 The improved glucose clearance following cold acclimation in humans is likely mediated, at least partly, by more efficient insulin-mediated glucose uptake by the skeletal muscle.29,30 As expected in a healthy condition, plasma insulin levels followed the pattern of plasma glucose, yet no difference between groups was observed (Figure 1C). Next, we exposed the subjects to a cold pressor test, a frequently used stress protocol in humans for assessing sympathetic reactivity and capability of tolerating cooling.31 Subjects immersed one hand in cold water at 4°C for 3 min. This test provoked increased pulse, systolic blood pressure, and diastolic blood pressure in both groups but with a stronger effect in the control group, suggesting cold acclimation in the winter swimmer group. None of the participants met the criteria of hyperreactivity (Figures 1D–1F). With this initial testing, we judged that the subject groups both responded to cold, albeit with different sensitivity. Subsequently, on separate days, we assessed the responses to perception-based cooling and a thermal comfort state (Figure 1G). The cooling protocol was also performed on a third day, during which abdominal subcutaneous white adipose tissue (WAT) biopsies were obtained and resting energy expenditure (REE) was measured. Importantly, the cooling days included segments of a thermal comfort state as reference periods (Figure 1G). Starting at thermal comfort for 45 min, the subjects were exposed to 195 min of cooling and 45 min of reheating. Supraclavicular skin temperature, in the region where BAT was present close to the skin, was measured in real-time using infrared thermography (IRT) throughout the cooling protocol until subjects were scanned using PET/magnetic resonance imaging (MRI) (Figure 1G). FDG uptake in BAT was our primary outcome, allowing us to separate winter swimmers and controls and analyze them as two distinct groups, as well as exclude one subject as described in Figure 3.
Figure 1.

Subject characterization and experimental design
Subjects (winter swimmers [WS], n = 7; controls [C], n = 8) performed an oral glucose tolerance test (OGTT). n represents the number of human individuals in each group and is consistent throughout this figure unless otherwise stated.
(A) Plasma glucose levels before (time point 0) and following glucose ingestion.
(B) Plasma glucose levels 2 h after glucose ingestion.
(C) Plasma insulin levels before (time point 0) and following glucose ingestion.
(D) Pulse before and during cooling and after reheating.
(E) Systolic blood pressure in response to cooling during a cold pressor test.
(F) Diastolic blood pressure in response to cooling.
(G) Experimental design depicting the measurements performed during the three experimental days.
Data are presented as mean ± SD. Differences were assessed using two-way repeated-measures ANOVA with Sidak’s multiple comparison tests to assess specific differences except in (B), where an unpaired t test was used. ∗p < 0.05, ∗∗p < 0.01, ∗∗∗p < 0.001.
Figure 3.

PET/MRI scanning of subjects in response to perception-based cooling or a thermal comfort state
PET/MRI scanning was part of the perception-based cooling or thermal comfort state protocols described in Figures 1 and 2, and data are shown from WS (n = 7) and C (n = 8). n represents the number of human individuals in each group and is consistent throughout this figure unless otherwise specifically stated.
(A) Representative images of a subject (winter swimmer) at a thermal comfort state (left) and during cooling (right).
(B) Glucose tracer (FDG) uptake in BAT measured as mean standardized uptake value (SUVmean) in the regions shown in (A).
(C) SUVmean uptake multiplied by the volume of BAT with SUV above or equal to 2.0 during a TC state or during cooling as a measure of BAT metabolic volume (BMV).
(D) Representative image showing glucose tracer uptake in the perirenal BAT (left), which was quantified for each subject and compared between groups and in response to a TC state and cooling (right).
(E) Resting energy expenditure (REE) in winter swimmers and controls in response to a thermal comfort state or cooling. The actual analysis was performed for 30 min, and the energy consumption during 24 h represents a calculated value if the energy consumption remains constant during this period.
(F) Cold-induced thermogenesis, calculated as the delta increase in energy expenditure induced by cooling.
(G) Lean body mass as measured by DEXA scan as an estimation of muscle mass.
(H) Electromyography (EMG) measurements recorded during 5 min at a thermal comfort state and during 5 min of cooling. Values are the area under the curve, including negative peaks, calculated per individual.
(I) A subset of subjects displayed glucose tracer uptake in intercostal and/or neck muscles following cooling (left). The signal in intercostal muscles was graded 1–4 depending on intensity, and 0.5 was added if the subject also had a signal in the neck. The scale bars thus represent estimated arbitrary values for cold-induced glucose uptake in the intercostal and neck muscles.
(J) Example of an MRI scan on a cooling day. Delineation of the region of interest (ROI) for calculation of the water percentage in areas with BAT (upper and middle panels), subcutaneous WAT (upper and lower panels), and skeletal muscle (middle panel).
(K) Water percentage in WAT, BAT, and skeletal muscle as calculated from MRI data.
(L) Water percentage in BAT in response to cooling.
(M–O) Gene expression analysis of LIPE, PLIN1, and ELOVL6 in WAT between groups and in response to cooling.
Differences between groups and treatments were assessed using mixed models and subsequent post-tests. Differences in AUC were assessed with an unpaired t test. When not otherwise specified, data are presented as mean ± SD. ∗p < 0.05, ∗∗p < 0.01, ∗∗∗p < 0.001, ∗∗∗∗p < 0.0001. See also Figure S2.
Perception-based cooling increased supraclavicular skin temperature
IRT can be used to perform non-invasive measurements of skin temperature as an estimate of BAT activity when IRT images are obtained close to superficial BAT depots, e.g., the supraclavicular region. To date, heterogeneity in human cooling study design complicates comparability between studies.32, 33, 34, 35 In the current study, we took advantage of the cheap and non-invasive nature of the sampling to perform continuous measurements of heat production during cooling or at a thermal comfort state. An important distinction of IRT compared with the gold standard methods, FDG-PET/CT or PET/MRI,36 is that it measures the endpoint of BAT activity (i.e., heat) rather than glucose tracer uptake, which is quantified with FDG-PET/CT or PET/MRI scans. The supraclavicular skin temperature still represents an indirect measure of BAT activity, because besides heat production from BAT, the temperature is affected by insulation from fat/skin, changes in blood flow, vasodilation/constriction of blood vessels, heat production from nearby muscles, and temperature of supplying blood, which in turn would be affected by heat production from more distant muscles or other organs.
The protocol for perception-based cooling was adapted and modified from previous studies published at the onset of our study.37,38 We found no previous protocols for the perception-based thermal comfort state protocol. Pilot studies were performed in our lab to rehearse and perform a cooling protocol suitable for a prolonged real-time assessment of BAT function using IRT during cooling and a thermal comfort state. We used the Blanketrol III hyperhypothermia system, which was connected to two water-perfused blankets, allowing precise adjustment and recording of the temperature to which the subjects were exposed (Figure S1A). Water temperature was regulated in real time based on cold perception using a customized visual analog scale (VAS). VASs are well-established tools for assessment of perceived degree of, e.g., anxiety.39 A similar method has been used in BAT research to assess cold perception and control for muscle shivering.40 At the cooling day, subjects were initially in a thermal comfort state for 45 min and the water temperature was thereafter gradually decreased during the first hour of cooling (Figure 2A), which corresponded to an increase in the individual cold perception VAS scores (Figure 2B). The core temperature, as measured by rectal thermometers, was initially stable but decreased by the end of the cooling protocol (Figure 2C). These data show that the perception and cooling temperatures were not different between groups. This was reproduced on the second cooling day, when we repeated the perception-based cooling protocols (Figures S1B–S1D). At the thermal comfort day, BAT activity was assessed at a thermal comfort state using the same experimental setup as cooling day 1; however, subjects were kept at a subjective thermal comfort state, i.e., neither cold nor warm, which represented a value of 4 to 5 on VAS (Figures 2D–2F). Both groups increased their supraclavicular skin temperature during cooling, whereas the response was more pronounced in the winter swimmer group, and differences in the thermal state (time point 45 min) were observed for several individual time points during cooling (Figures 2G and 2M). Sternum skin temperature was higher overall in the winter swimmer group but with no difference induced by cooling (Figure 2H). When normalized to sternum temperature and thermal comfort state temperature, supraclavicular skin temperature was higher in the winter swimmer group, a difference reproduced at the second cooling day (Figures S1E and S1F). At the thermal comfort test day, we observed a time-dependent regulation of supraclavicular and sternum skin temperature, whereas no specific time points deviating from the 45-min time point (Figures 2I and 2J). Skin temperature loggers at five peripheral sites of the body suggested a generally higher peripheral temperature for the winter swimmer group (Figures S1F–S1I). This observation might suggest greater heat loss in the winter swimmer group, which would be consistent with previous observations of adaptations to heat exposure,41,42 thus possibly mediated by the sauna sessions experienced in this group only. Because the tissue fat percentage was higher in the control group, we addressed whether supraclavicular skin thickness was different, which could have a confounding effect on IRT measurements. We analyzed the MRI scans to measure the distance between the skin surface and the activated BAT. Our clinical experts concluded that the distance in all subjects was negligible, because active BAT reached all the way out to the skin in the region where BAT temperature was measured by IRT (Figure 2N). Therefore, differences in insulation of supraclavicular BAT could not explain the observed difference in thermogenic response between groups during cooling. However, the temperature at the supraclavicular skin could also be affected by heat generated from nearby musculature or transported via circulation from other organs. In conclusion, measurements of supraclavicular skin temperature, as an estimate of BAT activity, using IRT should be interpreted with caution.
Figure 2.

Infrared thermography of supraclavicular BAT heat production at cooling and a thermal comfort (TC) state
Subjects (WS, n = 7; C, n = 8) were cooled using a Blanketrol III system by controlling the temperature of circulating water in the blanket. n represents the number of human individuals in each group and is consistent throughout this figure unless otherwise specifically stated.
(A) Water temperature in the blanket during cooling.
(B) Estimate of the subjects’ temperature perception using a VAS score.
(C) Core temperature as estimated by rectal thermometers. On a separate day, subjects were observed during the thermal comfort state protocol.
(D) Water temperature during a thermal comfort state.
(E) Estimate of the subjects’ temperature perception using a VAS score.
(F) Core temperature as estimated by rectal thermometers.
(G) Supraclavicular BAT skin temperature during cooling measured by IRT. The effect of the group and cooling were assessed during time points of 45–105 min. Sidak’s post-test was used to assess differences between the time point of 45 min (thermal comfort state) and the time points during cooling.
(H) Sternum skin temperature during cooling as measured by IRT and analyzed as described in (G).
(I) Supraclavicular BAT skin temperature in relation to the temperature at the sternum in response to cooling. Area under the curve (AUC) between groups is displayed to the right.
(J) Supraclavicular BAT skin temperature as measured by IRT during a thermal comfort state and analyzed as described in (G).
(K) Sternum skin temperature during a thermal comfort state as measured by IRT and analyzed as described in (G).
(L) IRT recording of the temperature changes in response to a thermal comfort state in supraclavicular BAT in relation to the temperature at the sternum. Because of experimental error, measurements were not available for all subjects at every time point. The time points at which data from fewer than three subjects were recorded were excluded.
(M) Representative IRT images of a control subject (upper panel) and a winter swimmer (lower panel). The scale bar represents temperature in °C.
(N) MRI assessing the distance between the activated BAT and the surface of the skin in the area where IRT images were obtained.
Relative IRT values in (I) and (L) were calculated as described in the STAR Methods section. Data are presented as mean ± SD. ∗p < 0.05, ∗∗p < 0.01, ∗∗∗p < 0.001. See also Figure S1.
Higher cold-induced thermogenesis in winter swimmers
After they were 60 min into the cooling or thermal comfort state protocols, subjects were injected with FDG tracer and 60 min later subjected to a PET/MRI scanning protocol for around 60 min on an integrated PET/magnetic resonance (MR) system (Biograph mMR, Siemens, Erlangen, Germany) with a 3 T magnet using a combination of spine and flexible body coils. All subjects except one of the winter swimmers (Figure S2A) demonstrated cold-activated glucose tracer uptake in the BAT regions as measured in the neck area and down to the level of the diaphragm. With the aim of detecting BAT-associated physiological variations between subjects, we decided to exclude this one BAT-negative subject from all analyses. Based on FDG-PET scanning, the metabolically active BAT was semi-automatically outlined from the base of the skull to the top of the diaphragm using a standardized uptake value (SUV) threshold of 2.0. We calculated SUV as FDG uptake (injected dose/patient weight) in units of grams per milliliter. Physiological uptake in structures other than BAT was manually excluded, such as uptake in the mouth, nose, and thyroid. From this outlined volume of interest (VOI), we defined BAT volume as the volume of the VOI, maximal SUV (SUVmax) as the signal in the most FDG-avid voxel within the VOI, and mean SUV (SUVmean) as the average SUV within the VOI. This method is one of the most frequently published methods in BAT research using PET/CT scans for determine BAT activity and is independent of CT data.43 Whereas no differences in plasma glucose levels was observed between groups (Figure S2B), winter swimmers had overall lower insulin levels (Figure S2C). There were no differences between groups in blood pressure (Figures S2D–S2F) and heart rate (Figures S2G–S2I). Glucose tracer uptake in the liver was estimated by analyzing SUVmean in a 3-cm sphere in the right lobe of the liver. Two-way ANOVA analysis showed no difference between groups or treatments, although there was a trend toward a less uptake in the winter swimmer group (mean of controls of 1.7 g/mL versus mean of winter swimmers of 1.5 g/mL, p = 0.06) (Figure S2J). All subjects regardless of group demonstrated comparable levels of BAT SUVmean in response to the cooling protocol (Figures 3A and 3B; Video S1). In contrast, at a thermal comfort state, we observed an intriguing difference between the winter swimmer group and the control group: the latter demonstrated a modest uptake of glucose tracer in BAT of most subjects, whereas the winter swimmers had no uptake in any subject (Figures 3A and 3B; Video S2). The reason for this absence of glucose tracer uptake in the winter swimmer group is intriguing and might be related to the individual perception-based thermal comfort protocol, with a possibly altered experience of cold in relation to physiological response in the winter swimmer group. Alternatively, our data could reflect heat acclimation because of frequent sauna exposure. Heat acclimation has previously been suggested to cause a reduction in core temperature set point,41 which would in turn be reflected by decreased heat production and/or increased heat loss. Our results further show that BAT is metabolically active without cold perception in many young, healthy males. These observations are consistent with early detection of FDG uptake in clinical studies in which it was discussed that subjects could have been subjected to mild cold in relation to the scanning procedure.2 It is also consistent with a more recent study demonstrating that glucose uptake, as well as lactate secretion of BAT, occurs during warm conditions.44 Together with these previous findings in the literature, our data support the idea of BAT maintaining body temperature at a thermal comfort state in adult humans. Although cold challenges clearly lead to BAT recruitment, this activity of BAT at a thermal comfort state could be important to consider when discussing modern lifestyle-caused reduction of BAT function. Importantly, when adjusting for volume of active uptake analyzing BAT metabolic volume (BMV), there was no longer any difference between groups, although post-tests showed a significant effect of cooling in the control group only (Figure 3C). A previous study, performing a three-week chronic pharmacological stimulation of BAT by mirabegron supplementation,12 demonstrated increased glucose tracer uptake specifically in the abdominal BAT. We therefore quantified the perirenal BAT separately. We found a similar pattern during a thermal comfort state, with ablation of glucose tracer uptake in the winter swimmer group but modest uptake in the control group (Figure 3D). In contrast to the upper BAT, although no overall difference was observed between groups, and only the winter swimmer group demonstrated a significant increase in glucose uptake in response to cooling in the perirenal BAT (Figure 3D).
REE during cooling has been shown to positively correlate with BAT activity.23 Here, we found that REE was higher in the winter swimmer group during cooling (Figure 3E), in concordance with the higher supraclavicular skin temperature observed in Figure 2. Cold-induced thermogenesis is calculated by the delta increase in REE. We here observed a substantially higher cold-induced thermogenesis in the winter swimmer group (Figure 3F). Intriguingly, energy expenditure increased by 500–1,000 kcal/24 h, whereas a previous study reported that human BAT would approximately generate 20 kcal/24 h.45 The subjects in that study were around 10 years older (in their thirties) than our subjects (who were in their twenties). Therefore, considering the strong correlation between age and declining BAT activity,13 it is likely that the subjects in our study had a greater energy expenditure in their BAT than the subjects from the previous study. Nevertheless, the difference in cold-induced energy expenditure could not be explained by differential glucose tracer uptake in BAT between groups, also arguing for additional contributors in cold-induced thermogenesis.
We next addressed the potential contribution of muscle. Based on dual energy X-ray absorption (DEXA) scan analysis, we found no difference between groups in lean body mass, representing an estimation of skeletal muscle mass (Figure 3G). To assess the possibility for muscular thermogenesis during the cooling protocol, we monitored muscle activity using electromyography (EMG). This method included constant recording and generation of a large dataset. We analyzed the muscle activity during the last 5 min of the 45-min-long thermal comfort state and compared this with a 5-min-long period following 30 min of cooling. This resulted in 300,000 data points per subject and time point. We assessed the differences in muscle activity between thermal comfort state and cooling by calculating the area under the curve (including negative peaks) for each subject and subsequently compared the effect of cooling in groups. Using this approach, we observed an effect of cooling that was only significant in the winter swimmer group when assessed by post-test; no difference between the groups was detected with the two-way ANOVA analysis (Figure 3H). Finally, we observed that some subjects had glucose tracer uptake in their intercostal muscles in response to cooling. Due to lack of CT data, we were unable to quantify this signal. However, our clinical PET expert performed a blinded grading of the scans, which gives the impression of a generally greater uptake in the intercostal muscles of winter swimmers compared with controls (Figure 3I). There was no positive or negative correlation between glucose tracer uptake in BAT and muscle. In conclusion, whereas both BAT and muscle were activated in response to cold, there was no clear difference in glucose uptake between the groups that could explain the higher cold-induced thermogenesis observed in the winter swimmer group and be supported by the higher supraclavicular skin temperature observed by IRT. These observations raise the idea that BAT glucose tracer uptake might not always be proportional to BAT activity. BAT thermogenesis in adult humans is fueled predominantly by fatty acids hydrolyzed from intracellular triglycerides (TGs) in healthy, lean subjects,7 whereas glucose uptake is likely to occur for replenishing intracellular lipid storages. Enhanced fatty acid utilization and turnover in cold-acclimated mice has been reported previously.46 A possible explanation is therefore that long-term cold-adapted BAT exhibits altered fuel uptake with decreased glucose utilization, increased free fatty acid uptake, and/or utilization of fatty acids derived from hydrolyzed intracellular TGs.
We performed MRI scans in direct relation to the PET scans (Figure 3J). Although scans overlapped, it was not possible to use MRI to set the limits for PET signal detection, as further discussed in the Limitations of study section. However, we also aimed use MRI to assess water percentage in BAT. Water percentage has previously been described as a surrogate measure of mitochondrial activity,47 a key property of BAT.18 Thus, a higher water percentage might be expected in BAT compared with WAT. Moreover, BAT might be distinguished from WAT by assuming a comparably low BAT-fat fraction due to less intra-cellular lipid content and a denser capillary network.48 In accordance, we found that BAT had a higher water percentage than WAT in the control subjects, whereas skeletal muscle, as expected, had a substantially higher water percentage than both WAT and BAT (Figure 3K). In the winter swimmer group, the water percentage in skeletal muscle was also higher than in WAT and BAT; however, no difference in water percentage was observed between WAT and BAT (Figure 3K). This could potentially suggest increased vascularization and mitochondrial biogenesis in WAT of the winter swimmer group. Along the same lines, cold-adapted subjects have been observed to have increased vasodilation in WAT.49 Another possibility could be alterations in lipid storage and metabolism in the winter swimmer group. No acute effect of cooling on BAT water percentage was observed in any of the groups (Figure 3L).
We next investigated whether markers of thermogenic differentiation and lipid metabolism were differentially regulated in WAT by assessing gene expression in abdominal subcutaneous adipose tissue biopsies collected before and after acute cold stimulation. Markers for thermogenic differentiation, including PPARGC1A, TBX1, TMEM26, and CKMT2, were regulated neither by group nor by acute cooling, which excluded that browning occurred, at least in the subcutaneous abdominal depot (Figures S2K–S2N). Long-term cooling in mice showed that expression of genes involved in lipolysis, glyceroneogenesis, fatty acid reesterification, fatty acid oxidation, and mitochondrial biogenesis in WAT was induced, which suggest that lipogenesis in WAT contributes to a lean phenotype.46 As might be expected based on the cold-induced sympathetic onset, some lipolytic markers either were regulated by acute cooling or were different between the two subject groups. LIPE, encoding hormone sensitive lipase, was acutely induced by cooling (Figure 3M). PLIN1, encoding Perilipin 1, which protects lipid droplets from breakdown by hormone-sensitive lipase,50 had lower expression in the winter swimmer group (Figure 3N). Finally, ELOVL6 (elongation of long-chain fatty acids family member 6), a marker for de novo lipogenesis (DNL),51 had higher expression in WAT in the winter swimmer group (Figure 3O). Altogether, these modest differences and regulations in gene expression support a differential lipid metabolism in WAT in the winter swimmer group. Although we cannot conclude from our current data whether BAT lipid turnover is enhanced in the winter swimmer group, it has previously been demonstrated that markers for de novo lipogenesis correlate with the BAT activity marker UCP1.52 In summary, we demonstrate that the two groups were different in terms of glucose tracer uptake at a thermal comfort state: BAT of most control subjects was metabolically active, whereas winter swimmers had no glucose uptake. Nevertheless, winter swimmers had substantially higher cold-induced thermogenesis than controls. The source of this differential energy expenditure between groups could not be clearly identified with our current measurements. However, it is clear that both BAT and skeletal muscle are involved, possibly with altered lipid metabolism.
A lower core temperature and a distinct diurnal rhythm of supraclavicular skin temperature in winter swimmers
Our current data, in line with previous observations,44 suggest that BAT is active at a thermal comfort state, at least in the control group. Previous studies have demonstrated a diurnal rhythm of BAT glucose and lipid metabolism.4,5 Therefore, we next examined the diurnal thermoregulation between winter swimmers and controls during a thermal comfort state. We investigated BAT temperature variation over 24 h and whether there was any difference between groups because of the presumable cold adaptation in the winter swimmers. We included a subgroup of our subjects (winter swimmers, n = 5; control subjects, n = 6). These subjects had already been characterized by FDG-PET/MRI and IRT in response to cooling. To obtain a constant measure of BAT thermogenesis during day and night, we used iButtons as a primary measure of supraclavicular skin temperature. IRT, which was used in the earlier cooling experiment, was not ideal to measure during sleep, because the tool require an upright sitting position and precisely fixed distance. Images obtained in the cooling experiment (as described earlier) in each subject, served as a guide to determine placement of the iButtons to target competent superficial BAT (Figure S3A). The familiarization and acclimation started when the subjects checked in at the lab at 4:00 p.m. the day before the experiment. Lights were out at 10:30 p.m. and the experiment started the next morning at 7:00 a.m. with placement of iButtons, meals, and blood sampling according to the schematic summary (Figure 4A). All subjects were familiar with the body temperature perception VAS and were instructed to aim for a thermal comfort state as represented by 4–5 on the VAS. This was rated throughout the day and subjects were told to use blankets, socks, and slippers to adjust temperature perception to reach a thermal comfort state. The subjects were allowed to use their computers but were asked to remain in bed as much as possible and were only allowed light activity such as bathroom visits. Number of steps was recorded with step counters, demonstrating no difference between groups (Figure 4B). Neither diastolic nor systolic blood pressure was different between groups (Figures 4C and 4D). As expected, core temperature showed a diurnal rhythm with a temperature reduction throughout the night while subjects were resting in bed53 (Figure 4E). Winter swimmers had a lower core temperature than did control subjects over the 24-h protocol (Figure 4E). This might be an effect of heat acclimation because of the regular sauna visits performed by the winter swimmer group, but not the controls. Heat acclimation has indeed been reported to cause a reduction of core body temperature and increase in blood volume.42 This acclimation occurs by increasing the peripheral blood flow, as well as sweat rate,41 suggesting that heat acclimation can even decrease the core body temperature set point. The skin temperature at the sternum demonstrated no diurnal rhythm, but here, winter swimmers also displayed a lower temperature than the control subjects, likely driven largely by differences during nighttime (Figure 4F). In contrast, we found that winter swimmers had higher supraclavicular skin temperature compared with control subjects (Figure 4G). Furthermore, the skin by the left temple revealed a higher temperature in winter swimmers compared with controls, possibly reflecting greater heat loss in the winter swimmers (Figure S3C). Thus, we observed a lower core temperature and potentially increased heat loss in the winter swimmers, possibly explaining the absence of glucose uptake at a thermal comfort state in this group.
Figure 4.

Diurnal thermoregulation and circulating hormones in adult humans
A subset of the subjects included in the preceding experiments were invited for a subsequent experiment to study diurnal thermoregulation at a thermal comfort state (winter swimmers, n = 5; controls, n = 6). n represents the number of human individuals in each group and is consistent throughout the figure unless otherwise specifically stated.
(A) Experimental setup. Subjects entered and spent the night at the laboratory before the recordings started and were then followed for 24 h.
(B) Number of steps by the two groups.
(C) Systolic blood pressure.
(D) Diastolic blood pressure.
(E) Core temperature recorded by an ingested temperature pill. Means without SD are shown. Area under the curve between groups is shown to the right.
(F) Sternum temperature recorded by iButtons. Means without SD are shown. Area under the curve between groups is shown to the right.
(G) BAT temperature recorded by using iButtons placed over supraclavicular BAT as detected from the IRT images during cooling. Means without SD are shown. Area under the curve between groups is shown to the right.
(H) BAT temperature comparing the average during the day (1:01–2:01 p.m.), nightlow (4:01–4:11 a.m.), and nighthigh (4:49–4:59 a.m.).
(I) Plasma cortisol over 24 h. Because of lack of samples, n for cortisol analysis was n = 3 winter swimmers and n = 3 control subjects.
(J) Plasma IL-6 over 24 h.
(K) Plasma leptin over 24 h.
(L) Plasma adiponectin over 24 h.
Differences between groups and treatments were assessed using two-way ANOVA or mixed models and subsequent post-tests. Differences in AUC was assessed with an unpaired t test. Data are presented as mean ± SD. ∗p < 0.05, ∗∗p < 0.01, ∗∗∗p < 0.001. See also Figure S3.
We next investigated whether there were consistent patterns of fluctuations. Not only is BAT activity regulated by cold, but postprandial induction at the same magnitude observed in response to mild cold has been observed in adult humans.54 Therefore, we were intrigued that only minor fluctuations in supraclavicular skin temperature were observed following meals (Figure 4G). This apparent discrepancy with the results of Din et al.54 might reflect that the regulation of supraclavicular skin temperature is highly affected by blood flow and heat contribution from other organs, dampening the expected increases in supraclavicular skin temperature. Moreover, the room temperature during the day was not stable and thus likely affected individual thermoregulation. In contrast, a striking regulation pattern occurred during the night. Here, the supraclavicular skin temperature was substantially downregulated in a pattern concordant with the core temperature rhythm. When zooming in on the supraclavicular skin temperature in winter swimmers, a pattern of temperature peaks was observed. The largest peak occurred just before 5 a.m. and preceded an increase in body temperature before awakening at 7 a.m. (Figure 4G). Although it cannot be ruled out that the magnitude of the peak is affected by the blood sampling at 5 a.m., only two subjects reported in the morning that they had woken up during the 5 a.m. blood sampling. Moreover, because this temperature peak had already started to increase around 4.30 a.m., i.e., before the blood sampling at 5 a.m., we find it unlikely that this peak reflected a disturbance caused by blood sampling. Finally, blood was also sampled at 2 a.m. using the same procedure; however, no temperature peak was observed at this time point. Altogether, we find it unlikely that disturbance from the blood sampling would be the explanation for the peak in temperature. Importantly, both the winter swimmers and the control group reduced their BAT temperature at night compared with daytime (nightlow), whereas in winter swimmers, the peak in temperature during early morning (nighthigh) was not different from the daytime temperature (Figure 4H). Room temperature was stable during the night but higher during the day (Figure S3B). This might have an effect on skin temperature during the day; however, it would not explain the differences between groups. These data suggest a diurnal rhythmicity in human BAT activity and heat production observed at rest during a thermal comfort state. The difference between groups is possibly explained by increased maturation and cold adaptation of BAT in the winter swimmer group. A clear advantage of using the iButtons in this setting is the constant logging of temperature directly at the skin and without disturbing the subject. Using the IRT image of thermogenically activated BAT was crucial for accurate placement of the iButtons. An inconsistency between IRT and iButtons measures was observed in a study evaluating these techniques,35 emphasizing that these methods may have advantages for different applications.
The lower core temperature and the regulation of BAT temperature in winter swimmers might affect sleep quality. The sleep and awakening cycle is associated with the hypothalamic-pituitary-adrenal (HPA) axis via secretion of cortisol.55 The stress hormone cortisol has its highest levels in the morning, and the levels thereafter gradually fall during the day. After entering sleep, cortisol generally continues to fall until 2–3 h of sleep, when the levels start to rise again,55 a regulation pattern of cortisol that could be confirmed in our subjects (Figure 4I). In accordance with previous literature, cortisol levels were lower at 10:30 p.m. than at 8:00 a.m. in both groups (Figure 4I). In the winter swimmer group, but not the control group, cortisol levels were also lower at 8:00 pm and 2:00 a.m. compared with 8:00 a.m. (Figure 4I). Low levels of cortisol at nighttime are beneficial for sleep quality.56 Although sleep was not measured in the current study, all subjects reported that they had slept well. At 5:00 a.m., cortisol levels had started to rise in both groups and thus were associated with the rise in BAT thermogenesis observed in winter swimmers (Figure 4I). With the current data, we cannot conclude whether there is a link between the rising cortisol and the rise in supraclavicular skin temperature. Because cortisol has a vasodiluting effect, a cortisol-mediated increase in skin temperature could be the result of increased blood flow heating the skin. However, glucocorticoids has previously been demonstrated to acutely induce both BAT glucose uptake and thermogenesis,57 raising the possibility for a direct activation of BAT by cortisol. From a larger perspective, it is known that sleep disturbances correlate with obesity and other metabolic diseases.56 An important regulator of cortisol release from the adrenal gland is interleukin-6 (IL-6),58 a multifunctional protein that has been previously investigated for its nocturnal association with stage 1–2 sleep and rapid eye movement sleep.59 Here we find higher levels of IL-6 in the winter swimmers, potentially reflecting a differential sleeping pattern (Figure 4J). Finally, we confirm that the satiety hormone leptin is regulated diurnally and peaked around 2–4 a.m., consistent with the lowest temperatures in BAT (Figure 4K). Plasma levels of adiponectin were regulated neither over time nor between groups during a day and night (Figure 4L). There was no difference between groups in blood cell concentration, including erythrocytes, leukocytes, lymphocytes, monocytes, and neutrophils (Figures S3D–S3H; Table S1). However, we observed that the blood cell concentration varied over the 24-h experimental cycle (Figures S3D–S3H). In summary, our data show a lower core temperature and indicate increased heat loss in winter swimmers, whereas supraclavicular skin measurements revealed intriguing preawake temperature peaks in the winter swimmers.
Conclusions
The winter swimmers examined in this study had differential thermoregulation compared with matched controls. Most subjects in the control group demonstrated BAT glucose uptake at a thermal comfort state, indicating that BAT contributes to maintaining a comfortable body temperature in young adults. In contrast, winter swimmers had a lower core temperature accompanied by depleted BAT glucose uptake and a higher peripheral skin temperature at several locations during a thermal comfort state, suggesting potential heat acclimation with a reduced core temperature caused by increased heat loss and decreased heat production. These differences might also explain the higher cold-induced thermogenesis in winter swimmers compared with controls. Although we did not identify a main source of the enhanced cold-induced heat production in winter swimmers, this was likely a combination of BAT and skeletal muscle. In conclusion, our data underscore that BAT in adult humans is part of the collective human body temperature regulation system in collaboration with skeletal muscle and blood flow. Furthermore, our study raises the idea that BAT could be involved in regulating sleeping patterns in humans, which should be interesting to investigate in future studies. Finally, our findings motivate investigations of winter swimming as a lifestyle intervention for increased energy expenditure in obese subjects as a potential weight loss strategy.
Limitations of study
With the current design, we cannot conclude whether winter swimming per se results in increased cold-induced thermogenesis and altered BAT glucose metabolism, because people with a certain thermophenotype could be more prone to take up winter swimming as a hobby. Although the groups of winter swimmers and controls were matched on several parameters, a higher tissue fat percentage and higher plasma glucose levels were found at 120 min after glucose ingestion in the control group. These differences could indicate a less healthy control group. Although the recruitment process excluded subjects who were dieting, were taking dietary supplements, had recent weight loss, or had a history of eating disorders, there are still potential lifestyle habit differences besides winter swimming that were not measured in the current study. These included food-preferences, preferred meal composition, and type and intensity of physical activity. Importantly, the low sample size provides a risk for type 1 and type 2 errors. We used four methods for estimating BAT activity, all with different limitations. The PET scan measures the uptake of a glucose tracer, which is associated with increased BAT activity, but does not measure thermogenesis per se. MRI measures water percentage, an additionally indirect approach. IRT measures skin temperature; however, precise distances and relating the supraclavicular skin temperature to the sternum skin temperature were required. The third method, iButtons, also provides non-invasive recording of skin temperature, with the advantage of constant logging of skin temperature. However, measurements of BAT temperature here require precise positioning of the iButtons, which we could not have achieved without first localizing BAT by combining the results of the PET and the IRT scans. Confounding factors for both IRT and iButtons include skin perfusion and insulation. Although the subcutaneous fat layer in the targeted region in all our subjects was regarded as negligible, caution should be paid when interpreting the measurements of supraclavicular skin temperature. The reason is that skin temperature could also be affected by circulating blood and thus heat production from both nearby and more distant organs, e.g., skeletal muscle. Another limitation with our study was that in the PET analysis, it is recommended to use a threshold of 1.2 g/mL;60 however, because we did not have CT data, a threshold of 2.0 g/mL was chosen as previously used in studies without CT data.43 This could have resulted in an underestimation of the amount of BAT detected. We could not use the MRI data as a replacement for CT data, because MRI scanning takes 30 min and breathing caused artifacts in the images; thus, it was not possible to perform a direct overlay between PET and MRI scanning.
In the diurnal study, a limitation for interpretation of our data was the lack of measurements of sleep, because disturbances in sleeping patterns could affect the data. Moreover, similar eating and sleep schedules, with a short familiarization period, could have biased the measurement of diurnal rhythms. In relation to the diurnal regulation of temperature, it should be pointed out that room temperature was not constant but was generally higher in the daytime, which might have affected the thermoregulation of our subjects. However, a colder environment is expected to generate greater BAT activity, and because we see a general decrease in supraclavicular skin temperature, we find it unlikely that the diurnal rhythm of BAT that we observed could be explained by changes in room temperature. We did not determine the chronotype, but all subjects reported no sleeping disturbances, and none of the subjects were shift workers. Finally, it should be discussed whether adjusting the temperature for cooling and a thermal comfort state according to a VAS score could be suboptimal considering the suggested adaptation to heat and cold in this group. However, we did not observe differences in thermal perception and accordingly water temperature between groups, suggesting that cold perception was not dramatically modified in the winter swimmer group, whereas the downstream physiological response showed clear differences. Finally, it is a limitation that we only investigated men in the current study. Future intervention studies including both women and men should thus be performed for better understanding of the effects of winter swimming on human metabolism.
STAR★Methods
Key resources table
| REAGENT or RESOURCE | SOURCE | IDENTIFIER |
|---|---|---|
| Biological samples | ||
| Human plasma | Clinical Trial | NCT-03096535 |
| Human abdominal subcutaneous fat biopsies | Clinical Trial | NCT-03096535 |
| Chemicals, peptides, and recombinant proteins | ||
| TaqMan Universal PCR Master Mix | Thermo Fisher Scientific | Cat# 4305719 |
| PowerUp SYBR Green Master Mix | Thermo Fisher Scientific | Cat# A25777 |
| Trizol | Thermo Fisher Scientific | Cat# 15596026 |
| 18-F-FDG- radiotracer | Department of Nuclear Medicine, Rigshospitalet | N/A |
| Critical commercial assays | ||
| R-plex Human adiponectin MSD assays | Meso Scale Discovery, Rockville, Maryland | F21YT |
| Human Cortisol Parameter Assay Kit | RND Systems | KGE008B |
| U-plex human leptin MSD assays | Meso Scale Discovery, Rockville, Maryland | K1515ZK |
| Human V-PLEX IL-6 MESO QuickPlex SQ 120 | Meso Scale Discovery, Rockville, Maryland | K0081460 |
| High-Capacity cDNA Reverse Transcription kit | Thermo Fisher Scientific | Cat# 4374966 |
| Oligonucleotides | ||
| CKMT2 | Thermo Fischer Scientific/Applied Biosystems | Hs00176502_m1 |
| PLIN1 | Thermo Fischer Scientific/Applied Biosystems | Hs00160173_m1 |
| PPARGC1A: forward 5′-caagccaaaccaacaactttatctct-3′; reverse 5′-cacacttaaggtgcgttcaatagtc-3′ | Biosearch Tecnologies | https://eu.biosearchtech.com/ |
| TBX1: forward 5′- acgacaacggcc-3′; reverse 5′- cctcggcatatt | Biosearch Tecnologies | https://eu.biosearchtech.com/ |
| TMEM26: forward 5′- atggagggactg-3′; reverse 5′- cttcacctcggt-3′ | Biosearch Tecnologies | https://eu.biosearchtech.com/ |
| LIPE: forward 5′- ctgctcctccgagacttcc-3′; reverse 5′- gacttgcgcccacttaactc | Biosearch Tecnologies | https://eu.biosearchtech.com/ |
| ELOVL6: forward 5′- caaagcacccgaactaggag-3′; reverse 5′- tggtgataccagtgcaggaa-3′ | Biosearch Tecnologies | https://eu.biosearchtech.com/ |
| Software and algorithms | ||
| ResearchIR 4.2 software | FLIR Software | https://www.flir.com/ |
| SAS 9.1 | SAS Institute | https://www.sas.com/en_us/home.html |
| Electromyography (EMG) | MATLAB | https://www.mathworks.com/ |
| Prism v9.0 | GraphPad | http://www.graphpad.com/ |
| Other | ||
| Dual X-ray absorptiometry (DXA) | Lunar Prodigy Advance; GE Healthcare, Madison, WI, USA | https://www.gehealthcare.com/products/bone-health-and-metabolic-health |
| Indirect calorimetric system | Quark B2, Cosmed, Italy | https://www.cosmed.com/en/products/indirect-calorimetry/quark-rmr |
| FLIR camera | A655sc | FLIR Systems AB, Presicion Nordic, https://www.flir.com/ |
| The Blanketrol III | Cincinnati Sub-Zero Blanketrol III Hyper-Hypothermia System Model: 233 | https://www.cszindustrial.com/ |
| Thermochron iButtons® | Maxim | DS1921H-F50 |
| e-Celsius® Performance capsule | Ingestible pill | https://www.bodycap.us/ |
Resource availability
Lead contact
Further information and requests for resources and reagents should be directed to and will be fulfilled by the lead contact, Camilla Scheele (cs@sund.ku.dk).
Materials availability
This study did not generate new unique reagents.
Experimental model and subject details
Design overview
After an information meeting, all subjects were screened with a health examination and anthropometric measurements. In a crossover design with interventions performed in randomized order, subjects performed a cooling test-day with PET/MRI scan and a thermal comfort test-day with PET/MRI scan. We examined the reproducibility of BAT activity and IRT data, by repeating the perception-based protocols obtained in the first cooling day 3-7 days after on a second cooling day. On the second cooling day, resting energy expenditure and abdominal subcutaneous fat biopsies were obtained, and no PET/MRI scan was performed. The study was performed in the cold months of Denmark from March 2017 to May 2017 and from October 2017 to February 2018. The diurnal study was performed from October 2017 to January 2018.
Recruitment of subjects
Young healthy men between 18-35 years of age that were either winter swimmers (n = 8) or non-winter swimmers (n = 8) with a BMI between 19-25 kg per m2 and without any medical conditions, were matched for age, BMI, and VO2max. Subjects were recruited for participation by advertisement at the University of Copenhagen, a webpage for volunteers for clinical studies (http://www.xn--forsgsperson-yjb.dk/) or advertisement in winter swimmer clubs in different areas of Denmark. Winter swimmers were included in the study if they had practiced winter swimming minimum 2-3 times per week and had at least started up their second winter swimming season from October to May in Denmark. In Copenhagen, outdoor temperatures during October to end of April ranges between 10°C to 2°C in the air and between 9°C to 1°C in the water. Winter swimming was defined as swimming or sitting in open water and only wearing swim pants or nothing. All subjects in the study reported using fitness centers for workout. Individuals with chronic diseases, sleeping disorder, history of alcohol abuse or smoking were excluded. Additionally, individuals dieting, taking dietary supplements, with recent weight loss (> 3 kg within 3 months), a history of eating disorders or use of daily medications (except seasonal users of antihistamines) were excluded for participation. Furthermore, control subjects were excluded if they had a history of winter swimming or taking cold showers as a routine. During the study they were told not to participate in any cold-water activities, cold showering or heat exposure, such as sauna or hot tubes. The study was approved by the Scientific Ethics Committee of the Capital Region of Denmark (H-16038581), The Danish Data Protection Agency (I-suite nr. 05162) and registered at ClinicalTrial.gov: NCT03096535 and NCT03095846. All individuals provided written informed consent prior to participation in the study, which was performed in accordance with the principles embodied in the Declaration of Helsinki II.
Method details
Health examination and clinical characterization
Subjects selected for the study underwent pre-examination that included baseline laboratory tests, medical history and physical examination including ECG. Subjects refrained from alcohol intake for 48 h and fasted for 10-12 h overnight prior to participation. Blood samples obtained on the health examination day was collected via a standard vacucette withdrawal cannula and collected in the fasting state. A two-hour glucose-tolerance test was performed within two days after the health-examination to test for type 2 diabetes. Blood samples were collected in the fasting state, as well as 30, 60, 90 and 120 min after ingestion of a solution containing 83 g monohydrate glucose (equal to 75 g anhydrate glucose) dissolved in 300 mL tap water. Blood was collected via an antecubital intravenous catheter. Body weight and anthropometrics was assessed using standard procedures. A standard dual X-ray absorptiometry (DXA), (Lunar Prodigy Advance; GE Healthcare, Madison, WI, USA) was used. Maximal oxygen consumption during exhaustive exercise (VO2max) was assessed using a cycle-ergometer based protocol with one-minute incremental steps of 20 W starting at 100 W, with a five-minute warm-up. Oxygen consumption was measured via an indirect calorimetric system (Quark B2, Cosmed, Italy), and heart rate was assessed simultaneously (Wireless HR monitor, Cosmed, Italy). A cold pressure test was performed by subjects submersing one hand into ice-water (approx. 4C°) for 3 min preceded and followed by HR and BP measurements for 3 min before, during and after submersion of the hand. This procedure was used as an indicator of sympathetic response. A rise in systolic BP > 25 mmHg or diastolic BP > 20 mmHg is considered indicative of hyperreactivity.
Standardization of behavior prior to test-days
Subjects would eat standardized meals, which corresponded to the individual daily energy requirements and subjects drank only water, followed by a 10-12 h fast. Subjects were told to sleep 8 h before test-days. The standardized meals were provided for the subjects to eat the day before the test-days to minimize an effect of different food intake on BAT activity between days. Subjects restrained from vigorous physical activity, caffeine, spicy food and alcohol during 48 h during prior to test-days, and used passive means of transportations between their homes and the test-laboratory. In cases where subjects had a cold or fever, the test day was re-scheduled.
Blood sample analyses
A pre-examination with routine blood samples was performed in all subjects. Routine blood samples were taken to screen for diseases before they were included in the experiment. Measurements of hemoglobin and glycosylated hemoglobin (Hb1Ac), plasma levels of insulin, C-peptide, glucose, triglycerides, ALAT, ASAT, thyroid hormones, thyrotropin, alkaline phosphatase, carbamide, urea Hemoglobin, Leucocyte count, platelet count, CRP, Basic phosphatase, Carbamide, Creatinine, Sodium, potassium, total cholesterol, LDL cholesterol, HDL and cholesterol were performed using standard techniques at the Department of Clinical Biochemistry, Rigshospitalet University Hospital, Copenhagen, Denmark. Blood samples for insulin, C-peptide, and glucose were immediately spun at 4°C at 2000 rcp for 15 min and were stored at 2–4°C until analysis on the same day. Plasma insulin was analyzed by electrochemiluminescent immunoassay (Cobas, Roche) and C-peptide by sandwich electrochemiluminesence immunoassay (ELISA). Plasma erythrocytes, hemoglobin, leukocytes, and platelets were measured by particle counts using Sysmex XN. Plasma urea, plasma creatinine, and plasma glucose were measured by enzymatic determination – absorption photometry using Cobas 8000, c702 module. Plasma sodium and plasma potassium was measured by Ion-selective electrode Measurement – potentiometry using Radiometer ABL 837. Plasma C-reactive protein was analyzed by latex particle-based immunoassay (LIA) – turbidimetry using Cobas 8000, c702 module. Plasma ALAT, ASAT, and plasma alkaline phosphatase was analyzed by enzymatic determination – absorption photometry using Cobas 8000, c702 module. Glycosylated hemoglobin (HbA1c) was analyzed by liquid chromatography (LC) – absorption photometry using Tosoh G7, Tosoh G8. Plasma thyrotropin (TSH) was analyzed by ECLIA – photon counts using Cobas 8000, e602 module. Plasma cholesterol, HDL, LDL, and triglycerides were analyzed by enzymatic determination – absorption photometry using Cobas 8000, c702 module. Free fatty acids were quantitatively analyzed by a UHPLC 1290 Infinity system (Agilent) coupled to a 6400 Triple Quad mass spectrometry system (Agilent). Plasma levels of Leptin, adiponectin, cortisol, and IL-6 were measured using the Meso Scale Discovery (MSD) ELISA platform. For these analyses, plasma samples were collected in EDTA vacutainers spun at 4°C, 2000 rcp for 15 min and stored at −80 C until further analysis. The analyses were performed at The Center of Inflammation and Metabolism and the Center for Physical Activity Research, Rigshospitalet, University of Copenhagen, Copenhagen Denmark, according to the manufacturer’s recommendations. Briefly, all standards, QC’s and samples were added to the plates in duplicates and the mean signal of the duplicates are reported. The MSD plates were read using the QuickPlex SQ 120 and the data analyzed using the Discovery Workbench software provided by MSD.
Experimental set-up for the cooling day and thermal comfort day
The experiments took place at the Department of Clinical Physiology and Nuclear Medicine, the PET and Cyclotron unit, Rigshospitalet. The subject met fasted in the morning and were provided with light clothing (standard hospital clothes). Our pilot studies showed that prolonged cooling caused contraction of the peripheral blood vessels and compromised withdrawing of blood through an antecubital peripheral-venous-catheter. This can result in hemolysis, which in turn could contaminate downstream analyses. Therefore, a central-venous-catheter (CVK) was placed in the femoral vein, to allow for sampling of blood at nine time points during the first cooling experimental day and the thermal comfort experimental day. An anesthesiologist placed the catheter according to standard procedure at Rigshospitalet. Serial blood samples were obtained at minutes 15, 45, 60, 75, 90, 105, 150, 240 and 285. Blood samples taken at 15, 45 and 285 min during the cooling test were at thermal comfort state.
Infrared thermography
Subjects were sitting in a semi-supine position in the hospital bed, with the IRT camera fixed to an iron-bar, hanging over the bed. The camera was centered to face the sternum anatomical landmark, with a distance of 60 cm. The headboard of the bed was elevated 50 cm from the bedframe. To ensure imaging the same anatomical area throughout the test, the 5 cotton wads represented anatomical landmarks, were assured visual in the imaging frame on the computer screen: Two cotton wads were placed at each end of the supraclavicular bone on right and left side and one cotton wads 10 cm from the jugular notch on sternum (as described above). The sternum landmark was not covered by the water blankets, Later the 5 anatomical landmarks were used to place regions of interest (ROIs) when analyzing the images using FLIR software (see below). Emissivity was set to 0.98 for human skin, as recommended in other IRT studies.61 The hospital room-temperature was 24 C° with a humidity around 50%. IRT images were taken every 5-10 min for 285 min, besides from approximately 90 min during PET/MRI scan and 30 min REE measurement during the second cooling day. Three IRT images were taken: Front with the subject looking up, looking to the right and looking to the left. After placing the IRT and anatomical landmarks, iButtons® were placed at 5 ISO-defined sites on the subject: Forehead, right instep, left shoulder, right hand dorsal and left hand dorsal.62 The data is used for measuring the effect of cooling and thermal comfort state outside the IRT-frame. The sampling rate was set at 2 min. The devices were fixed to the skin with medical tape (Mepore) before the testing started and taken of right before going to the PET/MRI scan.
Measurements of peripheral and core body temperature
An iButton® contains a computer chip with a real-time clock and memory, a battery and a semiconductor temperature sensor. We used the DS1921H-F50, which is a high-resolution iButton® focused on high temperature applications, containing a complete temperature logging system. Applications for iButtons® include tracking and regulating human or animal temperatures. According to the manufacturer the DS1921H-F50 has a temperature range of 15°C to +46°C, with an accuracy of ± 1°C. The resolution of this device is 0.125°C. It can also read up to 2048 values at a logging rate of 1 min to 255 min. Validation studies show that the mean accuracy is – 0.09 C with a precision of 0.05 C and shows a reliable temperature measuring device.62 Every 15 min the subjects measured their core-temperature using a digital rectal thermometer (HOMCA Digital Medical Thermometer).
Blood pressure and pulse
Blood pressure and pulse were registered at the same time points as temperature and blood samples collection. A blood pressure patch was placed on the opposite arm of the antecubital peripheral venous catheter, which was used for injection of the [18F]FDG-tracer. The peripheral venous catheter was placed according to standard procedure.
Cooling and heating
We used two water perfused cooling/heating blankets (The Blanketrol III, Cincinatti Sub-Zero (CSZ) Products, Inc) as previously described.40 After the thermal comfort period for 45 min at 27-33°C, a gradual decrease in temperature was performed, by setting the water temperature at 24°C. When reaching that, the temperature was readjusted to 18°C. When the water reached this temperature and no shivering occurred and further the subjective cold perception rating was under 8, temperature was decreased 2°C at a time. When reaching a stable non-shivering cold perception (VAS, please see below) rating up to 8 for approximately 10- 15 min the temperature was kept at this level. After placement of the CVK, the cooling/heating blankets (The Blanketroll III) were placed covering the anterior and posterior side of the body from the feet to 15 cm under the jugular notch on the chest. Using a tape measure an anatomical landmark at sternum on the chest was marked with a small cotton wad 10 cm from the jugular notch, in the center of the chest. To avoid direct cooling of the skin within the frame, thus leading to bias in the IRT measures, the top cooling blanket was placed 5 cm under the sternum anatomical landmark. This anatomic landmark was later used to measure and analyze the sternum temperature using IRT and FLIR software program. The subject and investigators continuously secured the placement of the blankets to ensure the anatomical landmark was not covered by the blanket on the anterior side.
Temperature perception using VAS
Cold perception was assessed by asking the subject to rate temperature perception using a 1-10-point scale. 1: very hot (so hot that I am sweating and in stress); 5: thermal comfort (not warm nor cold, I feel comfortable) and 10: shivering from cold (so cold that I am not able to stop the muscle shivering). The rating of the scale was explained to the subject before starting the test. Subjects were asked to rate their perception of temperature every 10-15 min during testing. During the cooling experiments the investigator and subject aimed at a rating between 8 and 9 and avoiding a 10 on the scale.
The thermal comfort test day was based on subjective thermal comfort state self-reports (VAS). It was defined as a temperature between 27-33°C water temperature in the blankets, however the temperature seemed stable at 32°C in both groups.
During thermal comfort testing day, the investigator and subject aimed at a rating of 4-5, to ensure the subject not feeling cold (a 6 on the scale). The water-temperature was increased/decreased accordingly. If the subject rated 9 or 10 on the cooling day, or shivering occurred the temperature was increased 2°C to avoid/stop shivering (VAS 10). The aim was to avoid shivering and instead achieve a steady-cooling temperature (8-9 on the VAS scale) before the FDG- injection (after 60 min of cooling). The pace for finding the individual temperature was comparable between subjects, as the water was cooled at the same speed.
Electromyography (EMG)
EMG was used as a continuous live monitoring tool using a custom MATLAB-based program developed for this project. The EMG-signal was sampled at 2000Hz, band pass filtered at 20Hz and 200Hz to remove baseline drift and unwanted signal content. A notch filter was applied at 50Hz to reduce powerline interference. To get a clear overview of both short-term and long-term changes in EMG activity three trend curves were plotted and continuously updated. The trend curves were calculated as root-mean-square (RMS) values from the raw EMG signal over windows with 50% overlap of length 1, 10, and 300 s, respectively. Two muscles were recorded: Pectoralis major and quadriceps. Pectoralis major signal was used for further analysis since we achieved the most reliable signal from this muscle. This is because the electrode was better protected from mechanical stress from putting on the cold blanket. To further analyze the shivering activity two 5-min segments were selected and RMS values were calculated: One during the last five minutes of 45 min exposure of the thermal comfort state, and one following 30 min from start of cold exposure. The pectoralis major channel also picked up an ECG signal. This had a high amplitude and was removed by calculating the trimmed RMS value, i.e., the 10% most extreme values were removed from the raw EMG before the RMS value was calculated. Due to the frequent sampling, five minutes resulted in 300,000 data points per time point and subject. For quantitative analysis, area under the curve (including negative peaks) were calculated for each individual and each of the five minute sequences. The area was then used for assess effects of group and cooling using two way ANOVA, with subsequent post-tests.
PET/MRI scanning procedure
Brown fat activity was measured by 2-deoxy-2-[18F]fluoro-D-glucose (FDG) Positron Emission Tomography (PET) scanning, and Magnetic Resonance Imaging. The MRI included a DIXON sequence for PET attenuation correction and axial T2 weighted turbo spin echo sequences [echo time: 12.0 s, repetition time: 9.7 ms, voxel size: 1.3 × 1.3 mm2, 40 slices of 4.0 mm thickness with 1.0 mm gap] with and without water suppression, the latter for calculation of water percentage (W%).37,38,47 PET was acquired over 3 bed positions and reconstructed with 3D OP-OSEM using 3 iterations, 21 subsets and 4 mm post-filtering. A dose of 100 MBq FDG was injected in an antecubital vein 60 min before scanning. Subjects rested after the injection to avoid uptake of the tracer in skeletal muscle, as described above. The PET/MRI (Biograph mMR; Siemens, Erlangen, Germany) consists of two integrated scanner systems, a 3 Tesla MR scanner, and a PET scanner. The scans are simultaneous, so that images can be easily fused. Immediately before the injection, subjects were asked to urinate in a urine flask to avoid stress-shivering from a full bladder and muscle activity during the FDG uptake. After 60 min of cooling the FDG-tracer was injected into an antecubital peripheral vein. Investigators distracted the subjects from the cold-pressure pain by talking to them, until the end of the cooling where the subject’s attention to sensation of cold was the main strategy to adjust temperature to avoid shivering. This strategy for avoiding cold pressure pain was described earlier.63 Just before transfer to the PET/MRI room, all skin electrodes, skin temperature probes and devices were removed. Hereafter (50 min after FDG injection), the subject placed with the cooling blankets in the scanner. The water-temperature was set at the same temperature as in the experimental room, or 1-2°C higher to decrease shivering during scan. To obtain high-quality PET/MRI images, it was essential that subjects did not move, sleep, or talk. The integrated PET/MRI scan procedure lasted between 50 min to 70 min. The investigator was present in the scanning room, observing shivering and adjusting the temperature according to the subject’s VAS ratings. After the PET/MRI scan the subject was moved back to the experimental room, where the cooling ended after a total length of 195 min. Subjects were reheated for 45 min at 32°C.
Second cooling day with REE measures
The second cooling day (without PET/MRI scan) was performed approximately a week after the first cooling day. The aim of this cooling day was to test the reproducibility of the perception-based cooling protocol from the first cooling day and IRT measures for each subject. Thus, the registered perception-based cooling protocol for the PET/MRI cooling day was repeated on this second cooling day. The set-up of the study day was the same as mentioned in the above described cooling day, however without the PET/MRI scan and the blood-samples. Additionally, subjects meet an hour earlier to rest and measure REE for 30 min at thermal comfort state and hereafter following the protocol as the first cooling day: 45 min of thermal comfort state, 195 min cooling and 45 min re-heating. At the same time during cooling as we performed PET/MRI scanning during cooling day 1 we measured REE for 30 min on cooling day 2. Moreover, two abdominal subcutaneous fat biopsies were taken: The first one at thermal comfort state after REE measures and the second at the end of the cooling after REE measures. The aim was to analyze potential browning factors in WAT, due to acute cooling and/or repeated cold-shock and cold adaptation (winter swimming). A total of 32 fat biopsies were collected, from winter swimmers N = 16 (of which one subject, thus two samples were excluded) and from control subjects N = 16.
Subcutaneous adipose tissue biopsies
The procedure for taking the subcutaneous abdominal adipose tissue biopsies were according to standard procedures at the hospital department: Bergström’s percutaneous needle technique was used after administering subcutaneously 2 to 5 mL of simple Lidocaine at 2% in a small area of 8 to 10 mm at the level of the umbilicus, in either the right or left flank, under sterile conditions. When the subject confirmed verbally numbness of the area, a small incision with a scalpel was performed in the skin horizontally and 1 to 2 cm in depth. The cutting needle was introduced through this incision and fat biopsies were obtained after applying suction. The fat biopsy was immediately rinsed with saline water, and snap-frozen into liquid nitrogen. Biopsies were immediately stored at −80°C until purification of RNA was performed. Following the biopsy procedure, compression with a gauze was made for approximately 1 min and the wound was closed using Steri Strips ® bands and a medical band on top.
RNA isolation, cDNA synthesis and quantitative real-time PCR
Snap-frozen subcutaneous fat biopsies were stored at −80°C until the day for RNA isolation. TRizol (Invitrogen) was added, tissue was disrupted using a QIAGEN TissueLyser II and RNA was isolated according to the manufacturer’s protocol. RNA was dissolved in RNase-free water and the concentration was measured with a Nanodrop ND 1000 (Saveen Biotech). cDNA was synthesized using 250 ng RNA using High Capacity cDNA Reverse Transcription Kit (Thermo Fisher Scientific). Quantitative real-time PCR (qPCR) was performed by loading samples in triplicates in a 383 well plate, for thermocycling using the ViiA™ 7 platform (Applied Biosystems). Relative transcript abundance was measured using SYBRgreen fluorescent dye (Applied Biosystems) or pre-designed TaqMan Gene Expression Assays (Applied Biosystems/Thermo Fisher Scientific). Relative gene expression levels were normalized to the expression levels of housekeeping gene PPIA and calculated using the ddCT method (User bulletin 2, Applied Biosystems). Primer sequences are available in the Key resources table.
Indirect calorimetry
Indirect calorimetry was performed in all subjects. Resting energy expenditure (REE) was measured during thermal comfort state and cooling conditions in all subject on the second cooling day. REE was measured by an indirect metabolic cart system using a Canopy with a ventilated hood (Quark B2, Cosmed). To improve indirect calorimeter measurements, the subjects, were instructed to be fasted. The subjects were kept undisturbed during the test, which included no talking, no tv, and no sleeping during the test. The subject was lying in a bed, with the ventilated hood covering the head. The calculation for REE was based on oxygen consumption and the RER value (the ratio between the number of liters of carbon dioxide (VCO2) and the number of liters of oxygen (VO2) in one breath).
Diurnal rhythmicity study
Diurnal rhythmicity of supraclavicular BAT skin temperature was measured across the day and night in a resting state in healthy humans. N = 11 subjects (n = 5 winter swimmers and n = 6 controls) reported for two days/nights sojourn to our laboratory facilities after the initial pre-examination and completing the experiments described above. One winter swimmer was sent home during experiments due to illness, thus excluded in the final data analysis. Three subjects at a time, mixed winter swimmers and controls, completed the experiments and resided in the same room. To avoid room temperature fluctuations and cold sensation, windows were kept closed. The subject avoided feeling cold and aimed at a thermal comfort temperature at 4-5 on the VAS described above. Subjects were familiar with the scale from previous test days and reported their temperature sensation rating to the investigator throughout the day. Subjects arrived at 4:00 p.m. on the first day. They were not fasted but had refrained from physical activity for 48 h and had avoided coffee, tea and spicy food for 24 h. The first day and night allowed for familiarization and acclimation with the facilities. After arrival, all subjects changed to light pants, shirt and socks provided from the hospital. If feeling hot during the day or night (rating < 4 on VAS), subjects were instructed to take of their socks while remaining sitting in the hospital bed. Subjects were told to rest and only walk to the bathroom and kitchen at the scheduled meals. They were asked to study or watch movies on a computer in their hospital bed, thus limit their physical activity levels as much as possible. Physical activity was monitored with step counters (Yamax SW200).
Subjects were in bed and lights were out from 11:00 p.m. to 7:00 a.m. They slept wearing a hospital shirt and light pants. Two investigators were in a room next to the experimental room, with the subjects sleeping. About 30-45 min after the light were out, an investigator went silently to the room to listen to their breathing. When subjects had heavier and/or slow breathing, they were assumed to be asleep, a method applied at hospitals to check whether patients are sleeping. The experiments were performed wintertime in Denmark thus, the room was entirely dark and there was no disturbing noise in the building. The subjects had no coffee the last 48 h which, according to the subjects, made them more tired.
The second day, the experiments started at 7:00 p.m.: A peripheral antecubital intravenous catheter was placed, and a fasting blood sample taken before breakfast. To ensure correct placement of iButtons, at least 2 investigators secured the correct placement. The investigators used a printed IRT image from the cooling day showing the area with the highest activation of BAT during cooling. This represented the place to put the iButtons on the skin above the supraclavicular BAT depot. The Infrared camera was placed 70 cm from the subjects and the live imaging was used for live comparison of the printed image and direct placement of iButtons (Figure S3A). In the laboratory facilities, air temperature was controlled centrally by the hospital at approximately 24°C. As a control measure for room temperature, an iButton was taped to the surface of a table (Cotton was attached between the table and the iButton). 13 blood samples were taken during day and night: At 8:00 a.m.(fasting), 8:30 a.m. (right after breakfast), 9:00 a.m., 11:00 a.m. (before lunch), 1:00 p.m. (after lunch), 3:00 p.m. (before a snack), 5:00 p.m., 18:00 p.m. (before dinner), 8:00 p.m. (before snack), 22:30 p.m. (before going to bed) and 2:00 a.m. and 5:00 a.m. while sleeping. After the 10:30 p.m. blood-sample, a small extended blood-sample tube (10 cm) was connected to the antecubital intravenous catheter. This was to ensure easier blood drawing in the night and avoiding touching the subjects’ hand, thus consequently awaking the subject.
The second night, light was out right after the blood-sample at 10:30 p.m. Like the first night, investigators listened to their breathing to confirm they were sleeping. All subjects were sleeping when the investigators came to the room at 2:00 a.m. and 5:00 a.m. The investigators checked that subjects were asleep during the night. Two subjects noticed the investigators during one of the blood-sampling during the night, but quickly fell asleep again (two subjects from the control group). Most subject were surprised that they did not awake during blood-sampling. According to the subjects, they slept well, but felt tired as they had no coffee the last 60 h.
Meals comprised standardized food in the amount corresponding to energy need/day. As subjects were matched for BMI and subjects equally fit (measured by VO2max), all subjects had the same meal size and served at the same time in the kitchen in the next room. Subjects were told to drink 2 l of water during the day. Core temperatures were continuously recorded throughout the day and night by an ingestible telemetric pill from e-Celsius® Performance, which logged data at 2 min sampling rate. e-Celsius® Performance capsule from BodyCap allowed for continuous core temperature monitoring, with an accuracy of 0.2°C (https://www.bodycap-medical.com/). The pills monitor the core temperature over a time period corresponding to the transit time of the stomach (24 h on average).
Quantification and statistical analysis
The statistical analyses of blood samples in the subject characterization were performed using the Statistical Package for SAS 9.1 (SAS Institute, Cary NC, USA) or GraphPad Prism v8.0 (GraphPad Software, La Jolla, CA). A sample-size calculation was performed to estimate the number of subjects in the study. For our primary outcome we expected to find a cold induced SUVmean uptake of 4.1 (±0.1) as previously observed in healthy lean subjects64. For our secondary outcome we expected a difference in supraclavicular temperature from thermal comfort state to cooling condition between 0.6 and 0.9 with a standard deviation of ± 0.6, based on a previous study. Therefore, we included n = 16 healthy, young male subjects (n = 8 winter swimmers, n = 8 controls in each group) and in case of a few drop-outs or no activated BAT, we still expected to maintain a power of 80% with this group. When comparing groups at basal level without including the effects of cooling and thermal comfort, unpaired t tests were used. When assessing the differences between groups during cooling and thermal comfort, matched samples (i.e., cooling versus thermal comfort) were stacked within groups and effect of cooling was analyzed with repeated-measures two-way ANOVA, or mixed models if any sample was missing (this is then further specified in the figure legends). Assumptions for both parametric t tests and ANOVA includes normal distribution of the datasets. In this case, our current dataset of n = 7 winter swimmers and n = 8 control subjects was judged too small to t test for normality by the statistical software that we used (GraphPad Prism 9). We however assessed the assumption of ANOVA that the residuals from this model were sampled from a Gaussion distribution. We estimated this with a QQ plot, a method plotting the actual residuals versus predicted residuals, computed from the percentile of the residual (among all residuals) and assuming sampling from a Gaussian distribution. We concluded that this assumption of our statistical approach was met. Data are presented as individual values with mean and standard deviations. Statistical test, significance level, n-numbers and meaning of n-numbers for each analysis are stated in figure legends. P values below 0.05 were considered statistically significant and are in this case shown in the figures.
Infrared thermography images analysis
IRT was performed using a high-resolution infrared camera: FLIR A655sc camera (FLIR Systems AB, Presicion Nordic) and analyzed in ResearchIR 4.2 software. Thermal images acquired by IRT at 5-10 min intervals were analyzed for each period of thermal comfort state and cooling. Images from the front, right and left side were taken. Data and graphs in this paper is based on the images taken from the front. IRT images were given numbers and randomized by an investigator for another investigator to do an assessor-blinded analysis. Mean and max skin temperatures were extracted for analysis after identifying the supraclavicular regions of interest (ROIs). The analysis was undertaken by measuring the distance between the anatomic landmarks to assure overlap of ROIs. The sequence of images was processed with ResearchIR 4.2 Software. The software’s “area tool” was used to define an area box encompassing the upper thorax and neck, using anatomic landmarks of the shoulder tips laterally, the mandible superiorly, and the nipple line inferiorly, as previously described.65 To define regions of thermogenic BAT activity, we performed a two rounds of analysis. In the first round, ROIs were drawn in the supraclavicular left and right area in known locations of BAT, using the anatomic landmarks to transfer to each thermal image. The warmest 10% of points within each ROI were identified and means calculated.65 A reference region consisting of a circle 10 pixels in diameter just above the sternum anatomic landmark was analyzed for comparison of potential body temperature difference. The image with the highest temperature at the supraclavicular BAT region (TSCR) and no temperature difference at the sternum anatomic landmark (TCHEST) was identified. This image was considered the reference image. Next, an adjusted and more precise drawing of ROIs were applied to all images. This included only the area with a positive TSCR relative to the TCHEST. A second round of analysis was initiated, and the new ROIs were applied to all images, including the images at 45 min thermal comfort state pre and post cooling. With this two-round analysis, we identified the image with the possible highest BAT activation and used this as the reference for drawing the most precise ROIs to use in all the images in the same subject. The method decreased the risk of analyzing a too narrow BAT region, thus overlook a temperature difference, or analyzing to wide ROIs, thus analyzing a region with no BAT and consequently seeing a too small temperature difference. Radiometric temperature data from the defined area were exported to Microsoft Excel 2007 (Microsoft Corporation, Redmond, Washington) and analyzed. The algorithm calculated the change in mean temperature between regions of thermal activity. Data were divided into left and right anatomic positions, overlying the known locations of BAT, and using the described two-round analysis.
5-9 images at thermal comfort state (before cooling) served as a baseline by calculations of the mean BAT temperature (baseline TSCR). To adjust for potential body-temperature increase, due to long-term cooling and potential shivering, mean body temperature was calculated for the 45 min thermal comfort state (baseline TCHEST): 5-9 images at thermal comfort state (before cooling) served as a baseline by calculations of the mean chest temperature (baseline TCHEST). Change in TSCR during cooling, relative to the baseline TSCR were calculated for each subject throughout the experiment. This calculation revealed a change in temperature from baseline (ΔTSCR). Same calculation was performed for TCHEST. Due to shivering, ΔTCHEST, could be a confounding factor for increased temperature in TSCR, thus wrongly attribute this increase in body temperature to activity in BAT. Consequently ΔTSCR was subtracted ΔTCHEST to adjust for these factors. The main outcome measures for IRT were: Baseline TSCR and TCHEST (mean of 45 min thermal comfort state) and mean change in TSCR and TCHEST during 195 min perception-based cooling stimulation. Images obtained at the thermal comfort experimental day were analyzed after the images on the cooling day. The size and shape of ROIs were defined on the cooling day where thermogenic active BAT was visualized, thus individual ROIs (TSCR and TCHEST) were extracted to the thermal comfort test day images.
The aim for the second cooling day was to test the repeatability for the perception-based cooling protocol on BAT activity and estimate sensitivity of IRT as a continuous monetarizing tool for BAT activation. In the data-analysis the two-round analysis was re-done for comparison between the two cooling days. The data-analysis was as described for the first cooling day.
Analysis of PET/MRI
PET: The analyses were performed according to the recommendations in Chen et al.36 The standardized uptake value (SUV) was calculated and BAT with a value higher to or equal with 2.0 was included in the volume of interest (VOI) of each scan. 2.0 g/ml minimal SUV threshold was chosen as CT data was not available for our study to define different fat depots (HU between different values). 1.2 g/ml is used in BARCIST 1.0 (BARCIST 1.0 recommends using a HU range between −190 and −10). Earlier studies without CT data have chosen 2.0 as a threshold.43 Studies using a lower limit have combined PET and CT data to avoid including tissue that is not fat. We have not done PET / CT but instead PET / MR and therefore do not have the opportunity to use HU to delimit BAT. The MR signal was not used for this calculation as the 30-minute-long MRI scan makes it impossible for the subjects to hold their breath during the scan and breathing cause artifacts which disturbs the overlay with PET. Currently, to our knowledge no standardized methods are available to circumvent these limitations. We therefore choose to analyze the PET signal without MRI adjustment.
Physiological uptake in salivary glands, skeletal muscle, vocal cord muscles, heart, thyroid gland and mediastinum were manually excluded. BAT volume is the total volume of the VOI and SUVmean (shown in Figure 3) is the mean SUV of all voxels in the VOI. A 3 cm sphere in the right lobe of the liver was used as a reference region to confirm stable SUV measurements between scans.
MRI: BAT data was obtained using a 6x6x6 cm3 cube centered at the lower end plate of corpus vertebrae C6, applied at the exact same position on the T2 sequence without water saturation and the T2 sequence with water saturation. Outline of visible BAT in this cube on the latter sequence was performed semi automatically with a threshold drawing tool in Mirada (Mirada Medical, Oxford, United Kingdom), setting the threshold to 40%. Calculation of water % in the outlined ROIs were performed automatically in the software using the differences of intensity in non-water saturated versus water-saturated voxels. Muscle data was obtained by dropping two spheres of 3 cm3 each. The spheres were placed within the skeletal musculature. WAT ROIs were outlined manually choosing subcutaneous fat tissue on the dorsum and drawing an ellipsoid ROI as big as possible avoiding muscle tissue. Water % for these regions were calculated in the same way as the BAT ROIs. Data were analyzed by an MRI specialist and assessor blinded to examination dates to avoid bias in the analysis.
Additional resources
This study is registered at ClinicalTrials.gov, with the title “Cold Induced Activation of Brown Adipose Tissue in Humans (COLDBAT),” ClinicalTrials.gov: NCT03096535. A direct link to the study is provided here: https://clinicaltrials.gov/ct2/show/NCT03096535.
Acknowledgments
We thank Ida Holm, Emilia Pierini Lüders, and Laetitia Stafania Grieco for their great help and positive spirit during long experimental test days. We thank Anne Christine Lundby and Lene Foged for their help with ELISA assays and Electra Schéele Pinnetti for her help with primer design. The Centre for Physical Activity Research (CFAS) is supported by TrygFonden (grants 101390 and 20045). The Novo Nordisk Foundation Center for Basic Metabolic Research is an independent research center based at the University of Copenhagen, Denmark, and partially funded by an unconditional donation from the Novo Nordisk Foundation (https://cbmr.ku.dk/) (grant NNF18CC0034900). Z.G.-H. was supported by the European Research Council (ERC) under the European Union’s Horizon 2020 Research and Innovation Programme (grant 639382). S.S. was supported by a 1-year scholarship from Rigshospitalet, the university hospital of Copenhagen (project E-22793-05). C. Scheele and S.S. were supported by a research grant from the Novo Nordisk Foundation (grant NNF17OC0029918).
Author contributions
C. Scheele, K.K., and B.K.P. supervised the study. S.S., C. Scheele, K.K., B.K.P., J.L., H.H.J., Z.G.-H., A.K., A.L., and M.B. performed hypothesis generation, conceptual design, data analysis, and manuscript preparation. S.S., J.L., F.E.P., M.J., A.E.H., E.A., K.B.N., R.D.N., C. Sølling, and A.-S.W.-N. conducted experiments and data analysis. All authors edited and approved the final manuscript.
Declaration of interests
C. Scheele is a consultant for Novo Nordisk A/S on human brown adipose tissue biology. Z.G.-H. works, in some capacity, for Embark Biotech ApS, a company developing therapeutics for the treatment of diabetes and obesity. All other authors declare no competing interests associated with this manuscript.
Published: October 11, 2021
Footnotes
Supplemental information can be found online at https://doi.org/10.1016/j.xcrm.2021.100408.
Supplemental information
Data and code availability
All data reported in this paper will be shared by the lead contact upon request. Any data transfer will occur with adherence to the European General Data Protection Regulation (GDPR), and MTA documents might therefore be required. This study did not generate any new code. Any additional information required to reanalyze the data reported in this work paper is available from the Lead Contact upon request.
References
- 1.Leitner B.P., Huang S., Brychta R.J., Duckworth C.J., Baskin A.S., McGehee S., Tal I., Dieckmann W., Gupta G., Kolodny G.M. Mapping of human brown adipose tissue in lean and obese young men. Proc. Natl. Acad. Sci. USA. 2017;114:8649–8654. doi: 10.1073/pnas.1705287114. [DOI] [PMC free article] [PubMed] [Google Scholar]
- 2.Nedergaard J., Bengtsson T., Cannon B. Unexpected evidence for active brown adipose tissue in adult humans. Am. J. Physiol. Endocrinol. Metab. 2007;293:E444–E452. doi: 10.1152/ajpendo.00691.2006. [DOI] [PubMed] [Google Scholar]
- 3.Gerhart-Hines Z., Feng D., Emmett M.J., Everett L.J., Loro E., Briggs E.R., Bugge A., Hou C., Ferrara C., Seale P. The nuclear receptor Rev-erbα controls circadian thermogenic plasticity. Nature. 2013;503:410–413. doi: 10.1038/nature12642. [DOI] [PMC free article] [PubMed] [Google Scholar]
- 4.Lee P., Bova R., Schofield L., Bryant W., Dieckmann W., Slattery A., Govendir M.A., Emmett L., Greenfield J.R. Brown Adipose Tissue Exhibits a Glucose-Responsive Thermogenic Biorhythm in Humans. Cell Metab. 2016;23:602–609. doi: 10.1016/j.cmet.2016.02.007. [DOI] [PubMed] [Google Scholar]
- 5.van den Berg R., Kooijman S., Noordam R., Ramkisoensing A., Abreu-Vieira G., Tambyrajah L.L., Dijk W., Ruppert P., Mol I.M., Kramar B. A Diurnal Rhythm in Brown Adipose Tissue Causes Rapid Clearance and Combustion of Plasma Lipids at Wakening. Cell Rep. 2018;22:3521–3533. doi: 10.1016/j.celrep.2018.03.004. [DOI] [PubMed] [Google Scholar]
- 6.Blondin D.P., Nielsen S., Kuipers E.N., Severinsen M.C., Jensen V.H., Miard S., Jespersen N.Z., Kooijman S., Boon M.R., Fortin M. Human Brown Adipocyte Thermogenesis Is Driven by β2-AR Stimulation. Cell Metab. 2020;32:287–300.e7. doi: 10.1016/j.cmet.2020.07.005. [DOI] [PubMed] [Google Scholar]
- 7.Blondin D.P., Frisch F., Phoenix S., Guérin B., Turcotte É.E., Haman F., Richard D., Carpentier A.C. Inhibition of Intracellular Triglyceride Lipolysis Suppresses Cold-Induced Brown Adipose Tissue Metabolism and Increases Shivering in Humans. Cell Metab. 2017;25:438–447. doi: 10.1016/j.cmet.2016.12.005. [DOI] [PubMed] [Google Scholar]
- 8.Cypess A.M., Weiner L.S., Roberts-Toler C., Franquet Elía E., Kessler S.H., Kahn P.A., English J., Chatman K., Trauger S.A., Doria A., Kolodny G.M. Activation of human brown adipose tissue by a β3-adrenergic receptor agonist. Cell Metab. 2015;21:33–38. doi: 10.1016/j.cmet.2014.12.009. [DOI] [PMC free article] [PubMed] [Google Scholar]
- 9.Hanssen M.J.W., Hoeks J., Brans B., van der Lans A.A.J.J., Schaart G., van den Driessche J.J., Jörgensen J.A., Boekschoten M.V., Hesselink M.K.C., Havekes B. Short-term cold acclimation improves insulin sensitivity in patients with type 2 diabetes mellitus. Nat. Med. 2015;21:863–865. doi: 10.1038/nm.3891. [DOI] [PubMed] [Google Scholar]
- 10.Hanssen M.J.W., van der Lans A.A.J.J., Brans B., Hoeks J., Jardon K.M.C., Schaart G., Mottaghy F.M., Schrauwen P., van Marken Lichtenbelt W.D. Short-term cold acclimation recruits brown adipose tissue in obese humans. Diabetes. 2016;65:1179–1189. doi: 10.2337/db15-1372. [DOI] [PubMed] [Google Scholar]
- 11.Lee P., Smith S., Linderman J., Courville A.B., Brychta R.J., Dieckmann W., Werner C.D., Chen K.Y., Celi F.S. Temperature-acclimated brown adipose tissue modulates insulin sensitivity in humans. Diabetes. 2014;63:3686–3698. doi: 10.2337/db14-0513. [DOI] [PMC free article] [PubMed] [Google Scholar]
- 12.O’Mara A.E., Johnson J.W., Linderman J.D., Brychta R.J., McGehee S., Fletcher L.A., Fink Y.A., Kapuria D., Cassimatis T.M., Kelsey N. Chronic mirabegron treatment increases human brown fat, HDL cholesterol, and insulin sensitivity. J. Clin. Invest. 2020;130:2209–2219. doi: 10.1172/JCI131126. [DOI] [PMC free article] [PubMed] [Google Scholar]
- 13.Becher T., Palanisamy S., Kramer D.J., Eljalby M., Marx S.J., Wibmer A.G., Butler S.D., Jiang C.S., Vaughan R., Schöder H. Brown adipose tissue is associated with cardiometabolic health. Nat. Med. 2021;27:58–65. doi: 10.1038/s41591-020-1126-7. [DOI] [PMC free article] [PubMed] [Google Scholar]
- 14.Jespersen N.Z., Feizi A., Andersen E.S., Heywood S., Hattel H.B., Daugaard S., Peijs L., Bagi P., Feldt-Rasmussen B., Schultz H.S. Heterogeneity in the perirenal region of humans suggests presence of dormant brown adipose tissue that contains brown fat precursor cells. Mol. Metab. 2019;24:30–43. doi: 10.1016/j.molmet.2019.03.005. [DOI] [PMC free article] [PubMed] [Google Scholar]
- 15.Heaton J.M. The distribution of brown adipose tissue in the human. J. Anat. 1972;112:35–39. [PMC free article] [PubMed] [Google Scholar]
- 16.Carpentier A.C., Blondin D.P., Virtanen K.A., Richard D., Haman F., Turcotte É.E. Brown adipose tissue energy metabolism in humans. Front. Endocrinol. (Lausanne) 2018;9:447. doi: 10.3389/fendo.2018.00447. [DOI] [PMC free article] [PubMed] [Google Scholar]
- 17.Huttunen P., Rintamäki H., Hirvonen J. Effect of regular winter swimming on the activity of the sympathoadrenal system before and after a single cold water immersion. Int. J. Circumpolar Health. 2001;60:400–406. [PubMed] [Google Scholar]
- 18.Cannon B., Nedergaard J. Brown adipose tissue: function and physiological significance. Physiol. Rev. 2004;84:277–359. doi: 10.1152/physrev.00015.2003. [DOI] [PubMed] [Google Scholar]
- 19.Jespersen N.Z., Larsen T.J., Peijs L., Daugaard S., Homøe P., Loft A., de Jong J., Mathur N., Cannon B., Nedergaard J. A classical brown adipose tissue mRNA signature partly overlaps with brite in the supraclavicular region of adult humans. Cell Metab. 2013;17:798–805. doi: 10.1016/j.cmet.2013.04.011. [DOI] [PubMed] [Google Scholar]
- 20.Chondronikola M., Volpi E., Børsheim E., Porter C., Annamalai P., Enerbäck S., Lidell M.E., Saraf M.K., Labbe S.M., Hurren N.M. Brown adipose tissue improves whole-body glucose homeostasis and insulin sensitivity in humans. Diabetes. 2014;63:4089–4099. doi: 10.2337/db14-0746. [DOI] [PMC free article] [PubMed] [Google Scholar]
- 21.Yoneshiro T., Aita S., Matsushita M., Okamatsu-Ogura Y., Kameya T., Kawai Y., Miyagawa M., Tsujisaki M., Saito M. Age-related decrease in cold-activated brown adipose tissue and accumulation of body fat in healthy humans. Obesity (Silver Spring) 2011;19:1755–1760. doi: 10.1038/oby.2011.125. [DOI] [PubMed] [Google Scholar]
- 22.Saito M., Okamatsu-ogura Y., Matsushita M., Watanabe K., Yoneshiro T., Nio-kobayashi J., Iwanaga T., Miyagawa M., Kameya T., Nakada K. High incidence of metabolically active brown adipose tissue in healthy adult humans: effects of cold exposure and adiposity. Diabetes. 2009;58:1526–1531. doi: 10.2337/db09-0530. [DOI] [PMC free article] [PubMed] [Google Scholar]
- 23.van Marken Lichtenbelt W.D., Vanhommerig J.W., Smulders N.M., Drossaerts J.M., Kemerink G.J., Bouvy N.D., Schrauwen P., Teule G.J.J. Cold-activated brown adipose tissue in healthy men. N. Engl. J. Med. 2009;360:1500–1508. doi: 10.1056/NEJMoa0808718. [DOI] [PubMed] [Google Scholar]
- 24.Senn J.R., Maushart C.I., Gashi G., Michel R., Lalive d’Epinay M., Vogt R., Becker A.S., Müller J., Baláz M., Wolfrum C. Outdoor temperature influences cold induced thermogenesis in humans. Front. Physiol. 2018;9:1184. doi: 10.3389/fphys.2018.01184. [DOI] [PMC free article] [PubMed] [Google Scholar]
- 25.Yoneshiro T., Matsushita M., Nakae S., Kameya T., Sugie H., Tanaka S., Saito M. Brown adipose tissue is involved in the seasonal variation of cold-induced thermogenesis in humans. Am. J. Physiol. Regul. Integr. Comp. Physiol. 2016;310:R999–R1009. doi: 10.1152/ajpregu.00057.2015. [DOI] [PubMed] [Google Scholar]
- 26.Johnson D.G., Hayward J.S., Jacobs T.P., Collis M.L., Eckerson J.D., Williams R.H. Plasma norepinephrine responses of man in cold water. J. Appl. Physiol. 1977;43:216–220. doi: 10.1152/jappl.1977.43.2.216. [DOI] [PubMed] [Google Scholar]
- 27.Association A.D., American Diabetes Association Standards of medical care in diabetes—2010. Diabetes Care. 2010;33(Suppl 1):S11–S61. doi: 10.2337/dc10-S011. [DOI] [PMC free article] [PubMed] [Google Scholar]
- 28.Gibas-Dorna M., Chęcińska Z., Korek E., Kupsz J., Sowińska A., Krauss H. Cold Water Swimming Beneficially Modulates Insulin Sensitivity in Middle-Aged Individuals. J. Aging Phys. Act. 2016;24:547–554. doi: 10.1123/japa.2015-0222. [DOI] [PubMed] [Google Scholar]
- 29.Blondin D.P., Labbé S.M., Phoenix S., Guérin B., Turcotte É.E., Richard D., Carpentier A.C., Haman F. Contributions of white and brown adipose tissues and skeletal muscles to acute cold-induced metabolic responses in healthy men. J. Physiol. 2015;593:701–714. doi: 10.1113/jphysiol.2014.283598. [DOI] [PMC free article] [PubMed] [Google Scholar]
- 30.Hanssen M.J.W., Wierts R., Hoeks J., Gemmink A., Brans B., Mottaghy F.M., Schrauwen P., van Marken Lichtenbelt W.D. Glucose uptake in human brown adipose tissue is impaired upon fasting-induced insulin resistance. Diabetologia. 2015;58:586–595. doi: 10.1007/s00125-014-3465-8. [DOI] [PubMed] [Google Scholar]
- 31.Victor R.G., Leimbach W.N., Jr., Seals D.R., Wallin B.G., Mark A.L. Effects of the cold pressor test on muscle sympathetic nerve activity in humans. Hypertension. 1987;9:429–436. doi: 10.1161/01.hyp.9.5.429. [DOI] [PubMed] [Google Scholar]
- 32.Brasil S., Renck A.C., de Meneck F., Brioschi M.L., Costa E.F., Teixeira M.J. A systematic review on the role of infrared thermography in the Brown adipose tissue assessment. Rev. Endocr. Metab. Disord. 2020;21:37–44. doi: 10.1007/s11154-020-09539-8. [DOI] [PubMed] [Google Scholar]
- 33.Jimenez-Pavon D., Corral-Perez J., Sánchez-Infantes D., Villarroya F., Ruiz J.R., Martinez-Tellez B. Infrared Thermography for Estimating Supraclavicular Skin Temperature and BAT Activity in Humans: A Systematic Review. Obesity (Silver Spring) 2019;27:1932–1949. doi: 10.1002/oby.22635. [DOI] [PMC free article] [PubMed] [Google Scholar]
- 34.Law J., Chalmers J., Morris D.E., Robinson L., Budge H., Symonds M.E. The use of infrared thermography in the measurement and characterization of brown adipose tissue activation. Temperature. 2018;5:147–161. doi: 10.1080/23328940.2017.1397085. [DOI] [PMC free article] [PubMed] [Google Scholar]
- 35.Martinez-Tellez B., Perez-Bey A., Sanchez-Delgado G., Acosta F.M., Corral-Perez J., Amaro-Gahete F.J., Alcantara J.M.A., Castro-Piñero J., Jimenez-Pavon D., Llamas-Elvira J.M., Ruiz J.R. Concurrent validity of supraclavicular skin temperature measured with iButtons and infrared thermography as a surrogate marker of brown adipose tissue. J. Therm. Biol. 2019;82:186–196. doi: 10.1016/j.jtherbio.2019.04.009. [DOI] [PubMed] [Google Scholar]
- 36.Chen K.Y., Cypess A.M., Laughlin M.R., Haft C.R., Hu H.H., Bredella M.A., Enerbäck S., Kinahan P.E., van Marken Lichtenbelt W., Lin F.I. Brown Adipose Reporting Criteria in Imaging STudies (BARCIST 1.0): Recommendations for Standardized FDG-PET/CT Experiments in Humans. Cell Metab. 2016;24:210–222. doi: 10.1016/j.cmet.2016.07.014. [DOI] [PMC free article] [PubMed] [Google Scholar]
- 37.van der Lans A.A., Vosselman M.J., Hanssen M.J., Brans B., van Marken Lichtenbelt W.D. Supraclavicular skin temperature and BAT activity in lean healthy adults. J. Physiol. Sci. 2016;66:77–83. doi: 10.1007/s12576-015-0398-z. [DOI] [PMC free article] [PubMed] [Google Scholar]
- 38.van Rooijen B.D., van der Lans A.A., Brans B., Wildberger J.E., Mottaghy F.M., Schrauwen P., Backes W.H., van Marken Lichtenbelt W.D. Imaging cold-activated brown adipose tissue using dynamic T2∗-weighted magnetic resonance imaging and 2-deoxy-2-[18F]fluoro-D-glucose positron emission tomography. Invest. Radiol. 2013;48:708–714. doi: 10.1097/RLI.0b013e31829363b8. [DOI] [PubMed] [Google Scholar]
- 39.Abend R., Dan O., Maoz K., Raz S., Bar-Haim Y. Reliability, validity and sensitivity of a computerized visual analog scale measuring state anxiety. J. Behav. Ther. Exp. Psychiatry. 2014;45:447–453. doi: 10.1016/j.jbtep.2014.06.004. [DOI] [PubMed] [Google Scholar]
- 40.Coolbaugh C.L., Bush E.C., Galenti E.S., Welch E.B., Towse T.F. An individualized, perception-based protocol to investigate human physiological responses to cooling. Front. Physiol. 2018;9:195. doi: 10.3389/fphys.2018.00195. [DOI] [PMC free article] [PubMed] [Google Scholar]
- 41.Costa R.J.S., Crockford M.J., Moore J.P., Walsh N.P. Heat acclimation responses of an ultra-endurance running group preparing for hot desert-based competition. Eur. J. Sport Sci. 2014;14(Suppl 1):S131–S141. doi: 10.1080/17461391.2012.660506. [DOI] [PubMed] [Google Scholar]
- 42.Taylor N.A.S. Human heat adaptation. Compr. Physiol. 2014;4:325–365. doi: 10.1002/cphy.c130022. [DOI] [PubMed] [Google Scholar]
- 43.Martinez-Tellez B., Nahon K.J., Sanchez-Delgado G., Abreu-Vieira G., Llamas-Elvira J.M., van Velden F.H.P., Pereira Arias-Bouda L.M., Rensen P.C.N., Boon M.R., Ruiz J.R. The impact of using BARCIST 1.0 criteria on quantification of BAT volume and activity in three independent cohorts of adults. Sci. Rep. 2018;8:8567. doi: 10.1038/s41598-018-26878-4. [DOI] [PMC free article] [PubMed] [Google Scholar]
- 44.Weir G., Ramage L.E., Akyol M., Rhodes J.K., Kyle C.J., Fletcher A.M., Craven T.H., Wakelin S.J., Drake A.J., Gregoriades M.L. Substantial Metabolic Activity of Human Brown Adipose Tissue during Warm Conditions and Cold-Induced Lipolysis of Local Triglycerides. Cell Metab. 2018;27:1348–1355.e4. doi: 10.1016/j.cmet.2018.04.020. [DOI] [PMC free article] [PubMed] [Google Scholar]
- 45.Muzik O., Mangner T.J., Leonard W.R., Kumar A., Granneman J.G. Sympathetic Innervation of Cold-Activated Brown and White Fat in Lean Young Adults. J. Nucl. Med. 2017;58:799–806. doi: 10.2967/jnumed.116.180992. [DOI] [PMC free article] [PubMed] [Google Scholar]
- 46.Flachs P., Adamcova K., Zouhar P., Marques C., Janovska P., Viegas I., Jones J.G., Bardova K., Svobodova M., Hansikova J. Induction of lipogenesis in white fat during cold exposure in mice: link to lean phenotype. Int. J. Obes. 2017;41:372–380. doi: 10.1038/ijo.2016.228. [DOI] [PubMed] [Google Scholar]
- 47.Johannesen H.H., Löfgren J., Donkin I., Hansen A.E., Loft A., Højgaard L., Kjær A. Identification and characterization of human brown adipose tissue (BAT) content and metabolism in adults using [(18)F]-FDG PET/MR—a pilot study. EJNMMI Phys. 2014;1(Suppl 1):A68. doi: 10.1186/2197-7364-1-S1-A68. [DOI] [PMC free article] [PubMed] [Google Scholar]
- 48.Cinti S. The role of brown adipose tissue in human obesity. Nutr. Metab. Cardiovasc. Dis. 2006;16:569–574. doi: 10.1016/j.numecd.2006.07.009. [DOI] [PubMed] [Google Scholar]
- 49.Daanen H.A.M., Van Marken Lichtenbelt W.D. Human whole body cold adaptation. Temperature. 2016;3:104–118. doi: 10.1080/23328940.2015.1135688. [DOI] [PMC free article] [PubMed] [Google Scholar]
- 50.Brasaemle D.L. Thematic review series: adipocyte biology. The perilipin family of structural lipid droplet proteins: stabilization of lipid droplets and control of lipolysis. J. Lipid Res. 2007;48:2547–2559. doi: 10.1194/jlr.R700014-JLR200. [DOI] [PubMed] [Google Scholar]
- 51.Matsuzaka T., Shimano H. Elovl6: a new player in fatty acid metabolism and insulin sensitivity. J. Mol. Med. (Berl.) 2009;87:379–384. doi: 10.1007/s00109-009-0449-0. [DOI] [PubMed] [Google Scholar]
- 52.Sanchez-Gurmaches J., Tang Y., Jespersen N.Z., Wallace M., Martinez Calejman C., Gujja S., Li H., Edwards Y.J.K., Wolfrum C., Metallo C.M. Brown Fat AKT2 Is a Cold-Induced Kinase that Stimulates ChREBP-Mediated De Novo Lipogenesis to Optimize Fuel Storage and Thermogenesis. Cell Metab. 2018;27:195–209.e6. doi: 10.1016/j.cmet.2017.10.008. [DOI] [PMC free article] [PubMed] [Google Scholar]
- 53.Kräuchi K., Cajochen C., Möri D., Graw P., Wirz-Justice A. Early evening melatonin and S-20098 advance circadian phase and nocturnal regulation of core body temperature. Am. J. Physiol. 1997;272:R1178–R1188. doi: 10.1152/ajpregu.1997.272.4.R1178. [DOI] [PubMed] [Google Scholar]
- 54.Din M.U., Saari T., Raiko J., Kudomi N., Maurer S.F., Lahesmaa M., Fromme T., Amri E.Z., Klingenspor M., Solin O. Postprandial Oxidative Metabolism of Human Brown Fat Indicates Thermogenesis. Cell Metab. 2018;28:207–216. doi: 10.1016/j.cmet.2018.05.020. [DOI] [PubMed] [Google Scholar]
- 55.Weitzman E.D., Fukushima D., Nogeire C., Roffwarg H., Gallagher T.F., Hellman L. Twenty-four hour pattern of the episodic secretion of cortisol in normal subjects. J. Clin. Endocrinol. Metab. 1971;33:14–22. doi: 10.1210/jcem-33-1-14. [DOI] [PubMed] [Google Scholar]
- 56.Hirotsu C., Tufik S., Andersen M.L. Interactions between sleep, stress, and metabolism: From physiological to pathological conditions. Sleep Sci. 2015;8:143–152. doi: 10.1016/j.slsci.2015.09.002. [DOI] [PMC free article] [PubMed] [Google Scholar]
- 57.Ramage L.E., Akyol M., Fletcher A.M., Forsythe J., Nixon M., Carter R.N., van Beek E.J.R., Morton N.M., Walker B.R., Stimson R.H. Glucocorticoids Acutely Increase Brown Adipose Tissue Activity in Humans, Revealing Species-Specific Differences in UCP-1 Regulation. Cell Metab. 2016;24:130–141. doi: 10.1016/j.cmet.2016.06.011. [DOI] [PMC free article] [PubMed] [Google Scholar]
- 58.Päth G., Scherbaum W.A., Bornstein S.R. The role of interleukin-6 in the human adrenal gland. Eur. J. Clin. Invest. 2000;30(Suppl 3):91–95. doi: 10.1046/j.1365-2362.2000.0300s3091.x. [DOI] [PubMed] [Google Scholar]
- 59.Redwine L., Hauger R.L., Gillin J.C., Irwin M. Effects of sleep and sleep deprivation on interleukin-6, growth hormone, cortisol, and melatonin levels in humans. J. Clin. Endocrinol. Metab. 2000;85:3597–3603. doi: 10.1210/jcem.85.10.6871. [DOI] [PubMed] [Google Scholar]
- 60.Martinez-Tellez B., Sanchez-Delgado G., Garcia-Rivero Y., Alcantara J.M.A., Martinez-Avila W.D., Muñoz-Hernandez M.V., Olza J., Boon M.R., Rensen P.C.N., Llamas-Elvira J.M., Ruiz J.R. A new personalized cooling protocol to activate brown adipose tissue in young adults. Front. Physiol. 2017;8:863. doi: 10.3389/fphys.2017.00863. [DOI] [PMC free article] [PubMed] [Google Scholar]
- 61.Harrap M.J.M., Hempel de Ibarra N., Whitney H.M., Rands S.A. Reporting of thermography parameters in biology: a systematic review of thermal imaging literature. R. Soc. Open Sci. 2018;5:181281. doi: 10.1098/rsos.181281. [DOI] [PMC free article] [PubMed] [Google Scholar]
- 62.van Marken Lichtenbelt W.D., Daanen H.A., Wouters L., Fronczek R., Raymann R.J., Severens N.M., Van Someren E.J. Evaluation of wireless determination of skin temperature using iButtons. Physiol. Behav. 2006;88:489–497. doi: 10.1016/j.physbeh.2006.04.026. [DOI] [PubMed] [Google Scholar]
- 63.McCaul K.D., Haugtvedt C. Attention, distraction, and cold-pressor pain. J. Pers. Soc. Psychol. 1982;43:154–162. doi: 10.1037//0022-3514.43.1.154. [DOI] [PubMed] [Google Scholar]
- 64.Boon Mariëtte R., Bakker Leontine E.H., van der Linden Rianne A.D., Arias-Bouda Lenka Pereira, Smit Frits, Verberne Hein J. Supraclavicular skin temperature as a measure of 18F-FDG uptake by BAT in human subjects. Plos One. 2014;Jun 12 9 doi: 10.1371/journal.pone.0098822. e98822. [DOI] [PMC free article] [PubMed] [Google Scholar]
- 65.Symonds M.E., Henderson K., Elvidge L., Bosman C., Sharkey D., Perkins A.C., Budge H. Thermal imaging to assess age-related changes of skin temperature within the supraclavicular region co-locating with brown adipose tissue in healthy children. J. Pediatr. 2012;161:892–898. doi: 10.1016/j.jpeds.2012.04.056. [DOI] [PubMed] [Google Scholar]
Associated Data
This section collects any data citations, data availability statements, or supplementary materials included in this article.
Supplementary Materials
Data Availability Statement
All data reported in this paper will be shared by the lead contact upon request. Any data transfer will occur with adherence to the European General Data Protection Regulation (GDPR), and MTA documents might therefore be required. This study did not generate any new code. Any additional information required to reanalyze the data reported in this work paper is available from the Lead Contact upon request.