FIG 4.
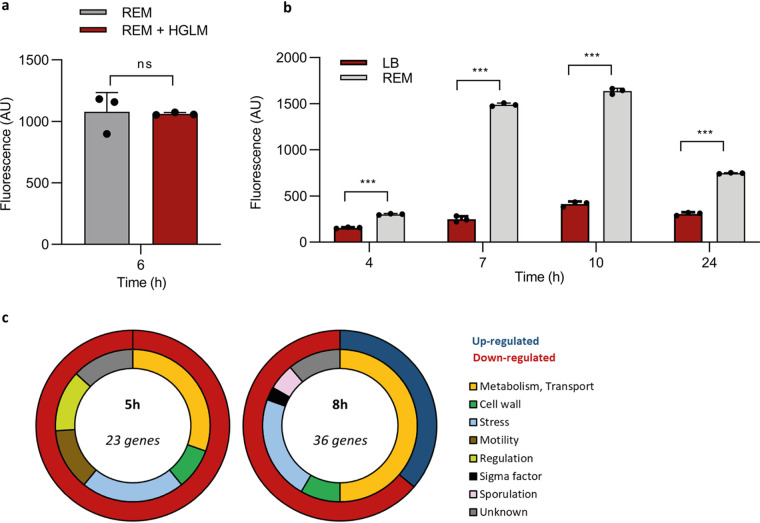
Impact of plant trigger perception on Bacillus transcriptome. (a) Surfactin expression measured by fluorescence in the GA1 PsrfA_gfp reporter strain at early-exponential phase in REM (gray bars) compared with that of REM supplemented with HGLM (red bars). Means ± SE from three biological replicates of one representative experiment are shown; ns, nonsignificant. (b) Surfactin expression measured by fluorescence in the GA1 PsrfAp::gfp reporter strain in a 24-h time course study in EM (gray bars) compared with that in LB medium (red bars). Means ± SE from three biological replicates of one representative experiment are shown. ***, P < 0.001. (c) Classification of the different genes carrying a significant fold change (1.5 log2) 5 and 8 h after addition of HGLM compared with that of the control condition. The outer circle represents the proportion of upregulated (dark blue) and downregulated (red) genes. The inner circle represents the proportion of genes belonging to the different functional family described in the legend.

