FIG 6.
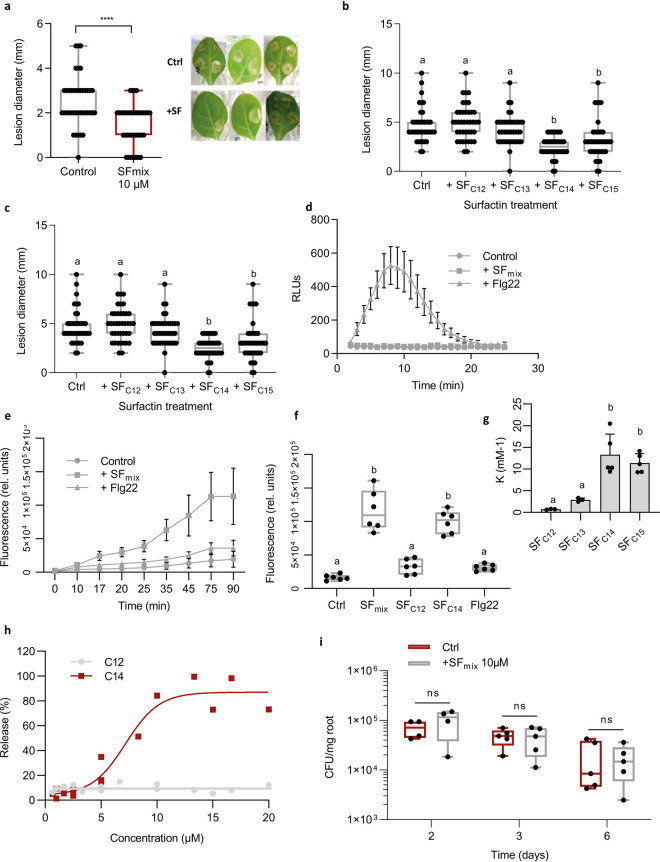
Impact of surfactin homologues on Solanaceae plant immunity. (a to c) Systemic resistance induced in hydroponically grown tobacco by surfactin and expressed as reduction of B. cinerea infection (illustration of the reduction in the diameter of spreading lesions on infected leaves) in plants treated at the root level prior to pathogen inoculation on leaves compared with that of control plants. Data represent results grouped from 2 independent experiments with similar results and each involving 5 plants with 4 lesions on the second leaf (n = 40). The box plots encompass the 1st and 3rd quartiles, the whiskers extend to the minimum and maximum points, and the midline indicates the median (n = 7 biological replicates of one experiment). (a) Effect of surfactin homologues (SF mix) as naturally coproduced by the bacterium (C12/C13/C14/C15 in relative proportions of 8%/17%/33%/42%); ****, P <0.0001. (b) Effect of HPLC-purified surfactin homologues applied at 10 μM with fatty acid chains from C12 to C15. Significant difference between each condition is indicated by different letters; P < 0.05. (c) Effect of the most active C14 homologue tested at various concentrations. The significant difference between each condition is indicated by different letters; P < 0.05. (d and e) Stimulation of oxidative burst in root tissues upon treatment with an SF mix and to the response observed by treating roots with flagellin (flg22; 1 μM) used as a positive control. (d) Stimulation of apoplastic ROS accumulation (DCFH-DA fluorescent probe) in root tissues upon treatment with a surfactin mix applied at 15 μM. Means and standard deviations are shown for one representative experiment performed on nine samples per treatment, with each containing three root segments (approximately 100 mg FW) collected from different plants (n = 9). A similar trend was obtained in an independent assay. (e) Stimulation of cytoplasmic hydrogen peroxide production in root cells. Means and SDs were calculated from measurements performed on three samples per treatment, with each containing three root segments (approximately 100 mg FW) collected from different plants. Data represent values obtained from two independent experiments (n = 6 per treatment). (f) Stimulation of cytoplasmic hydrogen peroxide production in root cells after treatment with C12 and C14 surfactin homologues as a representative of short and long fatty acid chains, respectively. Flg22 was used as a control. The box plots encompass the 1st and 3rd quartiles, the whiskers extend to the minimum and maximum points, and the midline indicates the median (n = 6 biological replicates of one experiment). The significant difference between each condition is indicated by different letters; P < 0.0001. (g) Binding coefficient (K) of surfactin homologues (C12 to C15) to large unilamellar vesicles (LUV) composed by PLPC-sitosterol-glucosylceramide (60:20:20 molar ratio). Means ± SE from three to five biological replicates of one representative experiment are shown. The significant difference between each condition is indicated by different letters; P < 0.05. (h) Release of 8-hydroxypyrene-1,3,6 trisulfonic acid (HPTS) from PLPC-sitosterol-glucosylceramide (60:20:20 molar ratio) LUV, upon addition of surfactin C12 or C14 at different concentrations. The ordinate shows the amount of HPTS released after 15 min in the presence of the C12 or C14 as a percentage of the total amount released by Triton X-100. (i) Influence of roots pretreatment with 10 μM surfactin (blue boxes) compared with that of nontreated roots (red boxes) on B. velezensis GA1 root colonization. The box plots encompass the 1st and 3rd quartiles, the whiskers extend to the minimum and maximum points, and the midline indicates the median (n = 5 biological replicates of one experiment). Ns, nonsignificant.

