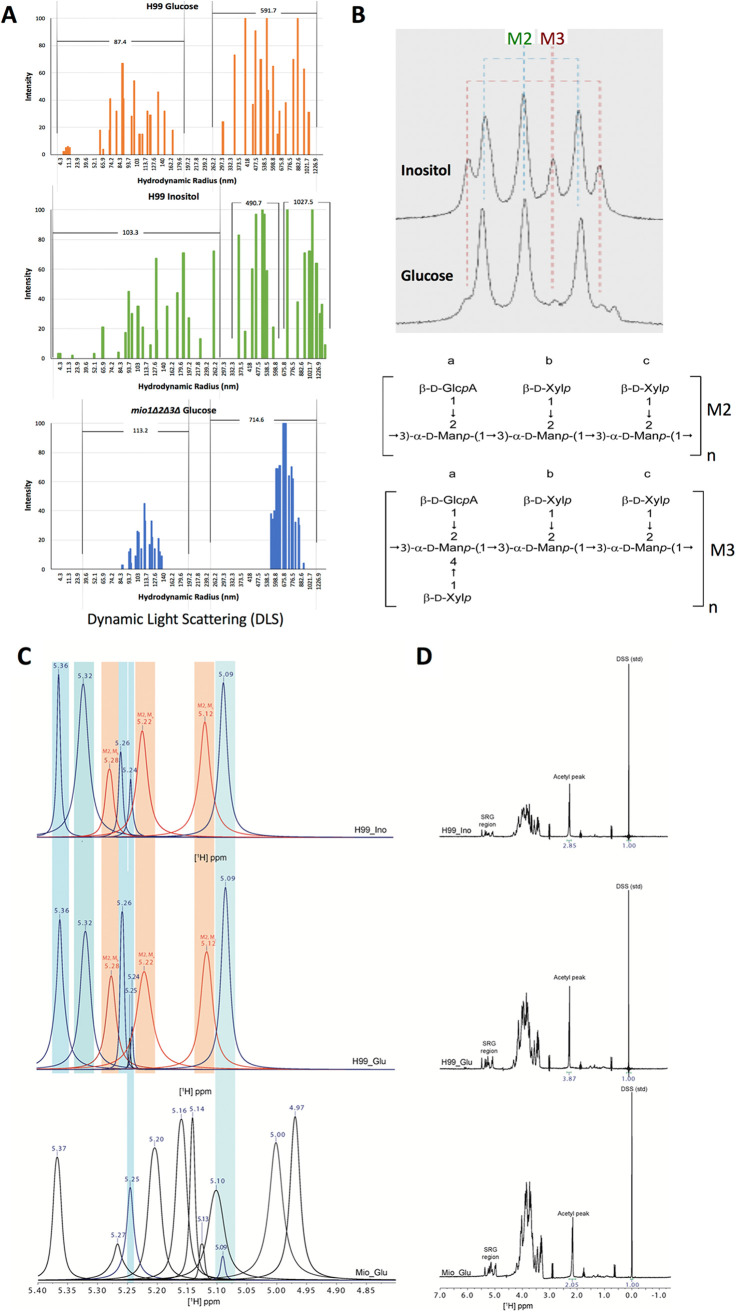
FIG 4.
The inositol catabolic pathway effects overall polysaccharide capsular structure. (A) Dynamic light scattering (DLS) reveals distinct polysaccharide characteristics in H99 and its mio1Δ2Δ3Δ mutant cultured with glucose or inositol as the carbon source. Three samples of extracellular polysaccharide (EPS) were examined by DLS; H99 cultured in glucose (top) or in inositol (middle) and the mio1Δ2Δ3Δ mutant cultured in glucose (bottom). Data for two biological replicates were averaged. While mio1Δ2Δ3Δ and H99 cultured in glucose show two size populations, H99 cultured in inositol shows three size populations, one larger than the others. (B) 1D-NMR analysis of GXM structure for samples isolated using the CTAB method from H99 culture in YPD medium with 1% glucose or 1% inositol as the carbon source. The SRG region peaks are shown. Peaks indicating M2 and M3 mannose triad structure are labeled. The basal molecular structure units of M2 and M3 structure are shown at the bottom. (C) Native-form GXM from H99 grown in glucose or inositol shows similar SRG peaks, and both contain the M2 motif of GXM. However, the mio1Δ2Δ3Δ triple mutant shows a completely different SRG peak set and does not contain the M2 motif. (D) Analysis of the full 1H 1D-NMR spectrum shows that the acetylation of the polysaccharides differs. Each acetyl peak was integrated and compared to the internally consistent D6 DSS standard. While H99 grown in glucose shows a peak area of 3.87 Hz compared to the DSS control, H99 grown in inositol shows decreased acetylation at a peak area of 2.85 Hz, while the mio1Δ2Δ3Δ triple mutant shows the smallest acetylation peak area at 2.05 Hz.

