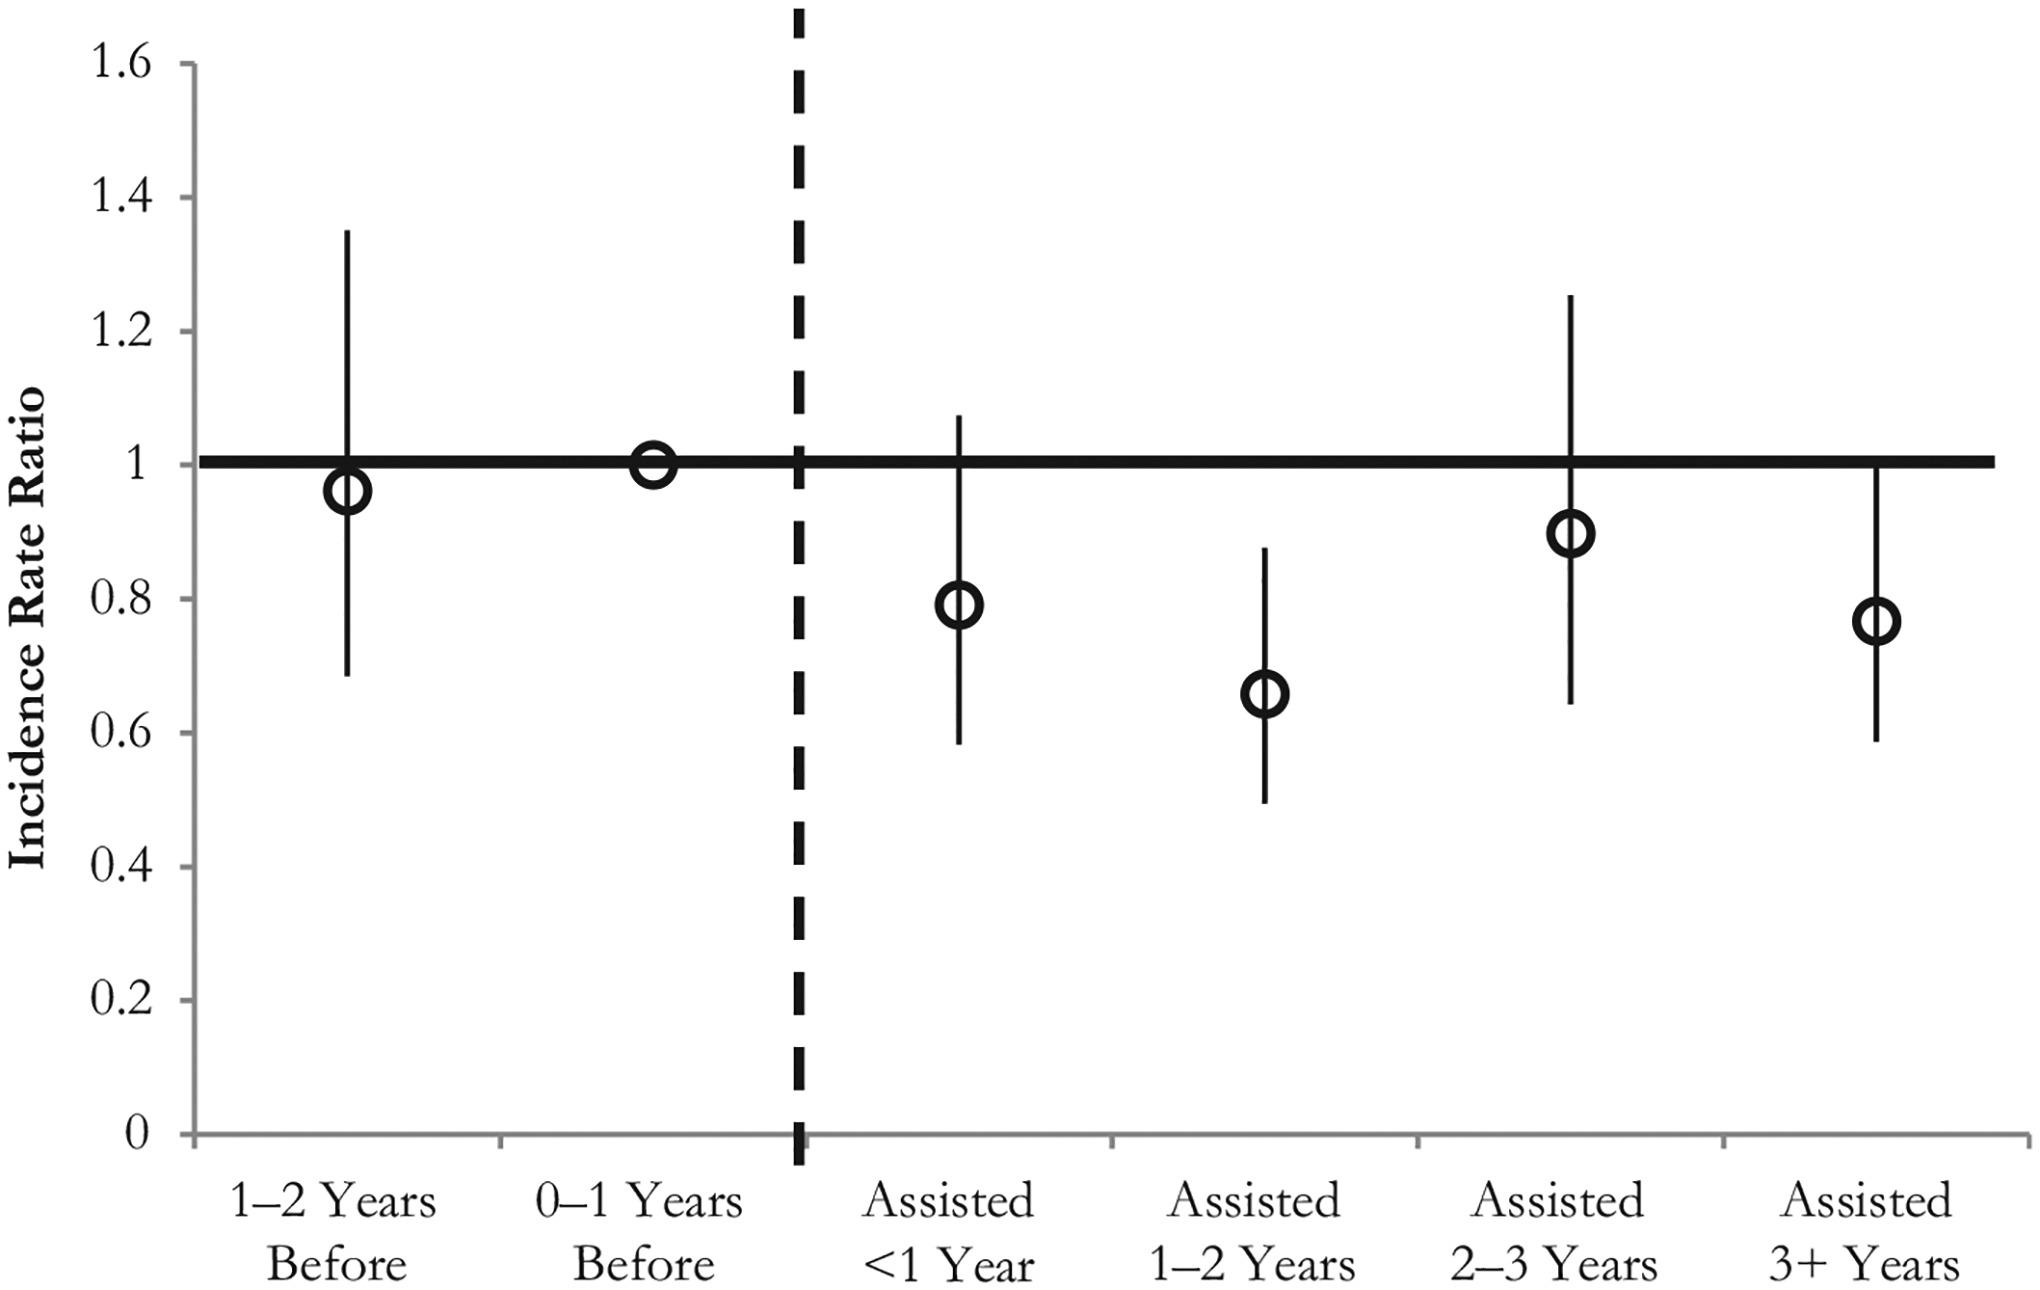
Fig. 1.

Event study model examining missed school days as a function of time relative to entrance into rental assistance. The graph shows coefficients from negative binomial models by timing relative to entry into rental assistance. “Before” refers to the number of years from the interview to entry into rental assistance. “Assisted” refers to the number of years since entering rental assistance, according to the data linkage. The reference category is children in the year before entry. Models adjust for individual, family, and neighborhood characteristics in Table 3 and the year of interview. The error bars represent 95% confidence intervals.
