

Abstract
Synaptic refinement is a critical physiological process that removes excess synapses to establish and maintain functional neuronal circuits. Recent studies have shown that focal exposure of phosphatidylserine (PS) on synapses acts as an “eat me” signal to mediate synaptic pruning. However, the molecular mechanism underlying PS externalization at synapses remains elusive. Here, we find that murine CDC50A, a chaperone of phospholipid flippases, localizes to synapses, and that its expression depends on neuronal activity. Cdc50a knockdown leads to phosphatidylserine exposure at synapses and subsequent erroneous synapse removal by microglia partly via the GPR56 pathway. Taken together, our data support that CDC50A safeguards synapse maintenance by regulating focal phosphatidylserine exposure at synapses.
Keywords: CDC50A, GPR56, microglia, phosphatidylserine, synapse elimination
Subject Categories: Neuroscience
Neuronal activity‐dependent downregulation of CDC50A leads to phosphatidylserine exposure and aberrant synaptic removal by microglia.

Introduction
A healthy and functional brain requires precise neuronal connections that are achieved via proper synapse formation and elimination. Microglia, the resident immune cells in the brain, contribute to the refinement of brain circuitry by engulfing synaptic elements in early postnatal life (Stevens et al, 2007; Tremblay et al, 2010; Paolicelli et al, 2011; Schafer et al, 2012). Improper synapse removal contributes to neuropsychiatric disorders such as autism spectrum disorder and schizophrenia (Tang et al, 2014; Sekar et al, 2016; Sellgren et al, 2019), whereas aberrant re‐activation of synaptic elimination later in life may underlie Alzheimer’s disease pathology (Hong et al, 2016). Immune molecules such as classical complement components, CX3CL1/CX3CR1, MHC class I, and PirB mediate developmental synapse removal (Huh et al, 2000; Stevens et al, 2007; Datwani et al, 2009; Paolicelli et al, 2011; Schafer et al, 2012; Tang et al, 2014; Sekar et al, 2016; Djurisic et al, 2018; Sellgren et al, 2019). However, it is unclear how specific synapses are targeted.
Phosphatidylserine (PS) is the most abundant anion phospholipid in eukaryotic membrane. It is mainly sequestered to the inner leaflet of the plasma membrane in healthy cells. When a cell undergoes apoptosis, PS is exposed to the cell surface and works as an “eat me” signal to phagocytes for clearance (Feng et al, 2002; Segawa et al, 2011; Neher et al, 2013; Tufail et al, 2017). Recently, our laboratory and others uncovered that PS performs a similar function in synapse elimination in the central nervous system (CNS), where presynaptic PS exposure mediates GPR56‐, complement‐, or TREM2‐dependent microglial synapse elimination (Li et al, 2020; Peet et al, 2020; Scott‐Hewitt et al, 2020). However, the molecular mechanism underlying PS exposure at synapses remains unknown.
The externalization and internalization of PS are dynamic processes that are regulated by phospholipid scramblases and flippases, respectively (Verhoven, Schlegel et al, 1995; Leventis & Grinstein, 2010; Sharom, 2011). Transmembrane protein 16F (TMEM16F) and Xk‐related protein 8 (Xkr8) are scramblases to be responsible for nonspecific and bidirectional translocation of PS between inner and outer leaflets of the plasma membrane (Suzuki et al, 2010, 2013). Type IV P‐type ATPases are a family of flippases including 14 human and 15 murine members (Palmgren & Nissen, 2011). CDC50A, also known as TMEM30A, functions as a chaperone for the proper localization of flippases to the plasma membrane and is crucial for their lipid transport activity (Lenoir et al, 2009; Segawa et al, 2014). CDC50A deficiency leads to constitutive PS exposure on the membrane surface of KBM7 and WR19L cells (Segawa et al, 2014; Segawa & Nagata, 2015).
In this study, we tested the hypothesis that CDC50A plays a role in synaptic elimination by regulating PS exposure at synapses. We demonstrated that CDC50A localized at retinal ganglion cell (RGC) synaptic inputs in the dorsal lateral geniculate nucleus (dLGN) and that its expression correlated with the rise and fall of synaptic numbers during brain development and homeostasis. Cdc50a expression was downregulated during neuronal inactivation. Cdc50a knockdown induced PS exposure at synapses and resulted in aberrant synapse elimination in vivo. Finally, Cdc50a knockdown‐induced synapse loss was partially attenuated in microglial Gpr56 conditional knockout mice, supporting GPR56/PS interaction in part mediates synapse removal by microglia.
Results
CDC50A is present at synapses
To investigate whether CDC50A is present at synapses, we first examined CDC50A expression in mouse brain synaptosomes, which have been used as a model system to study synaptic protein components and synaptic structure (Hebb & Whittaker, 1958; Evans, 2015). We found dynamic expression of CDC50A in synaptosomes with a sharp increase of synaptic CDC50A protein from postnatal day 1 (P1) to P14 followed by a steady gradual increase until 6 months of age and a significant reduction at 2‐year‐old aged mice (Figs 1A and EV1A and B). Interestingly, this expression curve matches the rise and fall of synapse numbers across the mouse lifespan (Cizeron et al, 2020), suggesting CDC50A may play a role in regulating synaptic density.
Figure 1. CDC50A is expressed at synapses.

- Western blot shows developmental expression of CDC50A in isolated synaptosomes from mouse brains. The quantification was normalized to the CDC50A expression of P7. GAPDH was used as an internal control. P1, postnatal day 1; 1 M, 1 month; 1Y, 1 year. N = 3–4, biological replicates.
- IHC for CDC50A and RIM1 on cultured neurons at DIV21. The left panel shows CDC50A is expressed in both neuronal soma and processes. The right panel exhibits CDC50A colocalize to pre‐synapses alongside neuronal processes. MAP2, Microtubule‐associated protein 2, was used to identify neuronal cells and trace dendritic processes. RIM1 is an active zone protein, which marks pre‐synapses. Left scale bar = 50 µm; right scale bar = 2 µm.
- Quantification of the percentage of RIM1+ pre‐synapses colocalizing to CDC50A. N = 3 for biological replicates.
- Single‐cell RNAseq in the retina revealed the percentage of RGCs that express the members of flippase family and their chaperon gene Cdc50a in mice (Macosko et al, 2015).
- IHC for CDC50A and vGluT2 in the developmental dLGN at P14, P21, and P30. The left panels show the overview of immunostaining in the dLGN, scale bar = 200 µm. The right panels are the zoomed‐in images, scale bar = 5 µm. Arrows indicate the colocalized CDC50A and vGluT2.
- Quantification of the percentage of CDC50A+/vGlut2+ synapses. The result shows that a significantly higher percentage of CDC50A+/vGlut2+ synapses at P21 and P30 than P14. N = 6 for biological replicates.
Data information: All data are presented as mean ± SD, * P < 0.05, ** P < 0.01, *** P < 0.001, **** P < 0.0001 by one‐way ANOVA with Tukey’s multiple comparisons test.Source data are available online for this figure.
Figure EV1. CDC50A is present at both pre‐ and post‐synapses.

- IHC for presynaptic synaptophysin and post‐synaptic PSD95 on isolated synaptosomes, suggesting synaptosomes are successfully isolated from mouse brains.
- Western blot of brain homogenate and synaptosomes from P30 mice. The results show synaptosomes contain more CDC50A than homogenate. H, homogenate. S, synaptosome.
- IHC for CDC50A and various synaptic markers on cultured neurons at DIV21. CDC50A colocalized with different synapse subtypes, including vGlutT1, vGluT2 excitatory presynapse, GluR1 excitatory postsynapse, VGAT inhibitory presynapse, and Gephyrin inhibitory postsynapse.
- Quantification of the percentage of different synapse subtypes colocalizing to CDC50A. N = 4 for biological replicates.
To further confirm CDC50A is present at synapses, we performed double immunostaining of CDC50A and various synaptic markers on cultured primary neurons. We revealed that CDC50A colocalized with presynaptic active zone protein RIM1 (Fig 1B and C) as well as excitatory presynaptic marker vGluT1 and vGluT2, excitatory post‐synaptic marker GluR1, inhibitory presynaptic and post‐synaptic marker VGAT, and Gephyrin (Fig EV1C and D).
To investigate the function of CDC50A in the formation of developmental circuits, we utilized the mouse visual system, a well‐established model of developmental synaptic refinement. During the early postnatal stage, RGCs project axons to the dLGN and form excessive synaptic connections with relay neurons (Shatz, 1983; Guido, 2008). Later, these excessive synapses undergo spontaneous activity‐dependent synaptic refinement, leading to the formation of stable visual circuits (Penn et al, 1998; Chen & Regehr, 2000; Hooks & Chen, 2006; Guido, 2008). We first mined a published single‐cell RNA sequencing database and discovered that Cdc50a is the highest expressed gene in the RGCs comparing to flippase genes (Fig 1D) (Macosko et al, 2015). To determine whether CDC50A is developmentally present at synapses and thus play a possible role in synapse refinement, we examined the localization of CDC50A in the dLGN. We observed that CDC50A was expressed in only 20% vGluT2+, a marker specific for RGC inputs (Land et al, 2004), synapses after eye opening (P14) (Hooks & Chen, 2006). On the other hand, CDC50A colocalized with ˜ 60% of RGC projected synapses in the dLGN at P21 and P30 (Fig 1E and F), time points when synaptic pruning is significantly decreased and sensory‐dependent synapse strengthening and maintenance dominate (Hooks & Chen, 2006; Guido, 2008; Cheadle et al, 2018, 2020). Taken together, our data demonstrate a dynamic presence of CDC50A corresponding to the rise and fall of developmental synaptic density.
Cdc50a expression is regulated by neuronal activity
Neuronal connections in the CNS are dynamically regulated. Neuronal activity modulates synaptic development by promoting the formation and stabilization of certain synapses and eliminating weak ones (Katz & Shatz, 1996; Sanes & Lichtman, 1999; Hua & Smith, 2004; Schafer et al, 2012). Activity‐dependent synaptic pruning is mediated in part by microglia. Inactivation of RGC activity by a sodium channel blocker TTX in the early development increased microglia‐mediated pruning of RGC presynaptic terminals in the dLGN, whereas increasing RGC activity by forskolin reduced RGC synaptic removal (Schafer et al, 2012). We hypothesized that the expression of Cdc50a is regulated by neuronal activity. To test this hypothesis, we inhibited neuronal activity in culture with a cocktail of TTX, D‐AP5 (NMDA receptor antagonist, which inhibits NMDA receptor‐mediated synaptic activity), and NBQX (AMPA receptor antagonist) (Fig 2A). Cdc50a mRNA was decreased promptly after one‐day treatment and continued downward trending to a sustained level of ˜ 50% after 4‐ and 7‐day treatment (Fig 2B). CDC50A immunohistochemistry (IHC) confirmed a reduced CDC50A protein level upon neuronal inactivation (Fig 2C and D). To determine whether Cdc50a expression would increase toward baseline upon the recovery of neuronal activity, we removed the inhibitor cocktail from the culture medium on day 7 and allowed the cells to recover in the normal medium. Indeed, Cdc50a mRNA gradually increased to ˜ 80% of baseline level on day 6 of recovery (Fig 2B). Consistently, CDC50A protein level was also increased by ˜ 20% (Fig 2C and D). To test whether this phenomenon holds true in vivo, we examined CDC50A localization at RGC synaptic inputs after intravitreal injection of TTX. Indeed, we found the percentage of CDC50A+ RGC inputs was significantly decreased after inactivating RGC (Fig 2E and F). Taken together, our data support the hypothesis that Cdc50a expression is regulated by neuronal activity.
Figure 2. CDC50A expression is dependent on neuronal activity.

- A scheme showing experimental timeline when neuronal inhibitors were added to and removed from the cultured neurons. A cocktail of TTX, D‐AP5, and NBQX was added to neurons at DIV 21.
- Quantitative PCR of Cdc50a during neuronal inactivation and recovery. Neurons without any treatment were used as controls. N = 4 for biological replicates, mean ± SEM, ** P < 0.01. **** P < 0.0001 by two‐way ANOVA with Sidak’s multiple comparisons test.
- IHC for CDC50A. CDC50A protein intensities were reduced after neuronal inactivation (day 7) and were recovered after removing neuronal inhibitors (day 13). Scale bar, 10 µm.
- Relative CDC50A intensities of neurons. N = 5 for biological replicates, mean ± SD, * P < 0.5, **** P < 0.0001 by one‐way ANOVA with Holm‐Sidak’s multiple comparisons test.
- CDC50A expression at RGC inputs after 5‐day consecutive TTX treatment. Scale bar, 10 µm.
- Quantification of the percentage of CDC50A+/vGlut2+ synapses. N = 5 for biological replicates, mean ± SD, **** P < 0.0001 by Student’s t‐test.
CDC50A knockdown causes PS exposure at synapses
CDC50A assists flippases to internalize PS from the outer leaflet to the inner leaflet of the plasma membrane by chaperoning them to their proper subcellular location (Suzuki et al, 2010, 2013). Deficiency in CDC50A causes PS exposure on cell surface (Segawa & Nagata, 2015). To determine whether a similar mechanism regulates PS exposure at synapses, we first downregulated CDC50A expression in primary cultured neurons using siRNA knockdown technology. We were able to deliver Cdc50a‐siRNAs into primary neurons effectively (Fig EV2A and B). Cdc50a mRNA was dramatically decreased to near zero after 4‐day silencing (Fig EV2C). Similarly, CDC50A protein expression was also significantly decreased (Figs 3A and B, and EV2D and E). To test whether Cdc50a‐siRNAs can induce PS exposure at synapses in vitro, we employed a polarity sensitive indicator of viability and apoptosis (pSIVA) (Kim, Chen et al, 2010a, 2010b), which fluoresces only upon binding to PS. As a confirmation of our staining method, we observed massively exposed PS on both soma and dendrites of apoptotic neurons (Fig EV2F). In the controls, only sparse pSIVA signals were detected on control neurons. In contrast, we detected significantly more pSIVA signals on the dendrites of Cdc50a‐RNAi‐treated live neurons (Fig 3C). Furthermore, some of the pSIVA signals were colocalized with synapsin I, a synapse marker (Fig 3D). Taken together, our results suggest that CDC50A control PS exposure at synapses.
Figure EV2. CDC50A expression is efficiently reduced after Cdc50a‐siRNA treatment.

- IHC of cultured neurons showed a majority of cells was transfected by Accell siRNA. Cy5 dye‐conjugated Cdc50a‐siRNA was used to visualize siRNA.
- Quantification of transfected neurons showed a ˜ 95% transfection efficiency. N = 9 for experimental replicates, mean ± SD.
- Quantification of relative Cdc50a mRNA between Cdc50a RNAi neurons and controls. Neurons were treated with Cdc50a‐siRNA pool for 4 days. Two different pairs of primers targeting to 408‐477bp and 438‐529bp of Cdc50a cDNA were used. N = 4 for biological replicates, data are plotted as 10‐90 percentile, **** P < 0.0001 by two‐way ANOVA with Sidak’s multiple comparisons test.
- IHC of Cdc50a RNAi neurons and controls for CDC50A. Neurons were treated with Cdc50a‐siRNA poo for 7 days.
- Quantification of neuronal CDC50A fluorescence intensity. Neuronal CDC50A was significantly decreased after Cdc50a knockdown. N = 5 for biological replicates, mean ± SD, ** P < 0.05 by Student’s t‐test.
- Dead or apoptotic cells were identified by PI. Exposed PS was detected by pSIVA on both soma and processes.
Figure 3. Cdc50a knockdown induces PS exposure at synapses.
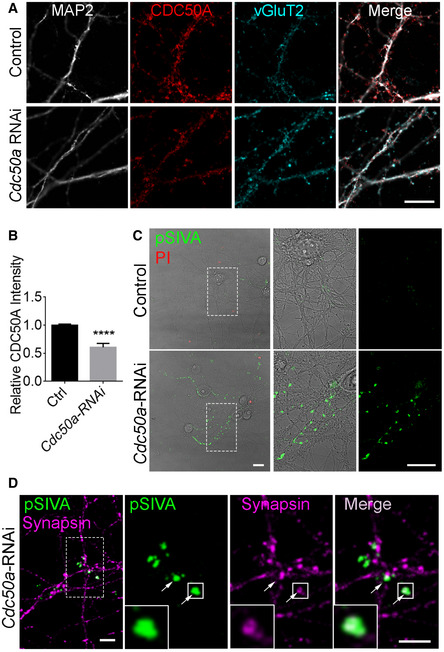
- Immunostaining of CDC50A on Cdc50a knockdown neurons and controls. Accell Cdc50a‐siRNA pool was used to knock down Cdc50a in neurons for 7 days. CDC50A expression alongside neuronal processed was reduced after Cdc50a‐siRNA treatment. Scale bar, 10 µm.
- Quantification of relative CDC50A fluorescence intensity in Cdc50a‐RNAi and controls. N = 4 for biological replicates, mean ± SD, **** P < 0.0001 by Student’s t‐test.
- Live neurons were imaged with or without Cdc50a‐siRNA treatment under a confocal microscope. Propidium iodide (PI) was used to label dead cells. In controls, live neurons exhibit a few weak pSIVA signals. However, in Cdc50a‐RNAi neurons, more and stronger pSIVA signals were observed alongside neuronal processes. Scale bar, 20 µm.
- IHC of Cdc50a‐RNAi neurons exhibited pSIVA colocalized with synapsin I, a general synapse marker. The dotted square was zoomed‐in shown on the right side. Arrows indicated where pSIVA colocalized with synapsin I. Scale bar, 5 µm.
CDC50A knockdown induces aberrant synapse elimination by microglia in vivo
Given the role of PS in regulating synapse removal, we hypothesized that downregulating CDC50A leads to synaptic elimination. To test this hypothesis, we generated an adeno‐associated virus (AAV2) carrying either scrambled or Cdc50a shRNA. A membrane fluorescent reporter hChR2‐mCherry was included in the virus vector to label the infected cells (Fig 4A). We intravitreally injected Cdc50a shRNA or control AAV2 into wild‐type BL6 mice at P30. We chose P30 because naturally occurring developmental synapse elimination is mostly completed in the retinogeniculate system at this time point, thus unequivocally confirming the role of DCD50A in focal PS exposure and synaptic elimination. Mouse brains were collected 17 days later (Fig 4B). IHC for mCherry and vGluT2 in the dLGN showed that AAV2 successfully infected some RGCs and made it to RGC axons and terminals in the dLGN (Fig 4C). Importantly, Cdc50a shRNA AAV2 virus infection significantly downregulated CDC50A protein expression at RGC presynaptic terminals (Fig 4D and E). To further test whether knocking down Cdc50a induces PS exposure at synapses, we performed pSIVA staining on brain slices containing dLGN. Only minimal pSIVA signals were detected in the dLGN of mice that received control viruses. In contrast, we observed significantly more pSIVA signals in the infected area of mice who received the Cdc50a shRNA virus compared to non‐infected area as well as controls (Fig 4F and G, and Appendix Fig S1), supporting that Cdc50a knockdown induced PS exposure at synapses in vivo.
Figure 4. Cdc50a depletion causes PS exposure at synapses.

- AAV2 constructs containing 5’‐inverted terminal repeats (ITR), U6 promoter, shRNA sequences, CMV promoter, hChR2‐mCherry, and 3’‐ITR. Cdc50a shRNA was used to knock down Cdc50a. Scrambled shRNA was used as controls.
- An experimental diagram showing 1‐month‐old mice were intravitreally injected with AAV2 control and shRNA viruses and collected 17 days later.
- Confocal images of dLGN after AAV2 injection. The dLGN was outlined with the dotted line. MCherry reveals axons and synapses of AAV2‐infected RGCs. Left scale bar, 50 µm. Right scale bar, 5 µm.
- Representative IHC images of CDC50A expression at synapses. Scale bar, 5 µm. Arrows indicate VGluT2+ RGC inputs.
- Relative CDC50A expression at mCherry+ synapses in Cdc50a RNAi mice and controls. N = 3 for biological replicates, mean ± SD, * P < 0.05 by Student’s t‐test.
- PSIVA staining in the dLGN. Exposed PS was detected by pSIVA on RGC inputs in Cdc50a‐RNAi mice. Scale bar, 5 µm. Arrows indicate pSIVA+/mCherry+ RGC inputs.
- Quantification of the percentage of pSIVA+/mCherry+ RGC inputs in total mCherry+ RGC inputs. N = 4 for biological replicates, mean ± SEM, ** P < 0.01 by Student’s t‐test.
Very recently, we and others showed that PS acted as an “eat me” signal for microglia‐mediated synaptic elimination (Li et al, 2020; Scott‐Hewitt et al, 2020). We hypothesized that downregulating Cdc50a would lead to synaptic removal. To this end, we intravitreally injected control and shRNA viruses at P30 and collected the brains one month later (Fig 5A). As expected, we observed minimal, if any, changes in the density of Tuj1+ RGCs (Fig EV3A–C), cleaved caspase 3+ apoptotic RGCs in the retina (Fig EV3D–F), the density of neurofilament+ axons (Fig EV3G and H), and amyloid precursor protein (APP) accumulations in the dLGN (Fig EV3I and J), supporting Cdc50a‐shRNA viruses did not affect the overall health of RGC cells.
Figure 5. Cdc50a depletion causes aberrant synapse loss.

- An experimental diagram showing 1‐month‐old mice was intravitreally injected with AAV2, and their brains were collected 1 month later.
- IHC images showed vGluT2+ signal was dramatically reduced in the outlined area of mice received Cdc50a shRNA viruses, but not in controls. Scale bar, 100 µm. d: dorsal, m: medial.
- Single‐plane confocal images of vGluT2+ synapses in the dLGN. Dotted line divided the mCherry+ and mCherry− areas. Scale bar, 20 µm.
- Quantification of vGlut2+ synapse density in the AAV‐infected areas and the neighboring non‐infected areas of Cdc50a RNAi mice and controls. N = 5 for biological replicates, mean ± SD, **** P < 0.0001 by one‐way ANOVA with Holm‐Sidak’s multiple comparisons test.
- IHC for vGluT2 and mCherry in the shell and core regions of the dLGN. Scale bar, 100 µm.
- Maximum intensity z‐projection images of vGluT2+ synapses in the core region of Cdc50a RNAi mice and controls. Right panel showed enlarged synapses in the boxed region. Scale bar, 20 µm.
- Quantification of vGluT2+ synapse density. N = 3 for biological replicates, mean ± SD, * P < 0.05 by Student’s t‐test.
- Maximum intensity z‐projection images of vGluT2+ synapses in the shell region. Enlarged images (right panel) shows large “complex encapsulated” boutons. Scale bar, 20 µm.
- Quantification of vGluT2+ synapse density. N = 3 for biological replicates, mean ± SD, Student’s t‐test.
Figure EV3. The health of RGC cells has no significant change after Cdc50a knockdown.

- IHC for Tuj1 and mCherry in the retina. Tuj1 was used to label RGC. MCherry identified the AAV2‐infected RGC. Scale bar, 50 µm.
- Quantification of RGC density 17 days after AAV injection. N = 4 for biological replicates, mean ± SD, Student’s t‐test.
- Quantification of RGC density 1 month after AAV injection. N = 4 for biological replicates, mean ± SD, Student’s t‐test.
- IHC of whole mount retina 1 month after intravitreal injection of AAV2‐Cdc50a‐shRNA. Apoptotic cells were labeled by cleaved Caspase 3 antibody (cCasp3). No cCasp3+/mCherry+ RGC was found in the retina. Scale bar, 100 µm.
- A retinal cross section of AAV2‐Cdc50a‐shRNA‐injected mice. Brn3, Brain‐specific homeobox/POU domain protein 3, is a marker of RGC in the retina. Scale bar, 200 µm.
- Quantification of the percentage of cCasp3+/mCherry+ RGC. N = 13 for experimental replicates, mean ± SD.
- IHC for neurofilament and mCherry in the dLGN. Scale bar, 50 µm.
- Quantification of neurofilament density in AAV‐infected and non‐infected areas of Cdc50a RNAi mice and controls. N = 3 for biological replicates, mean ± SD. Two‐way ANOVA with Sidak’s multiple comparisons test.
- IHC for APP and mCherry in the dLGN. Scale bar, 5 µm.
- Quantification of APP density. N = 4, for experimental replicates, mean ± SD, Student’s t‐test.
Consistent with partial RGC viral infection, we observed patchy mCherry+ areas in the dLGN (Fig 5B). The dLGN has two regions: the dorsal “shell” that harbors convergent input from direction selective ganglion cells and the superficial layers of the superior colliculus; and the ventromedial “core” that receives input largely from a diverse group of RGC that appear to regulate canonical spatial vision (Dhande & Huberman, 2014; Hong et al, 2014). The “shell” is predominated by large‐sized “complex encapsulated” boutons, while the “core” contains more smaller boutons (Fig 5) (Hammer et al, 2015). Interestingly, we observed different phenotypes in different areas of the dLGN. In the outlined virus‐infected “core” area, we found a dramatic decrease in vGluT2 signal as well as vGluT2+ synaptic density in Cdc50a‐RNAi‐infected area compared to the adjacent non‐infected area as well as those infected with control AAV virus (Fig 5B–D). Similarly, we also observed a significant loss of synapses in the ventral “core” region in Cdc50a‐RNAi mice compared to controls (Fig 5E–G). Interestingly, Cdc50a knockdown did not affect synaptic density in the shell region (Fig 5H and I).
To differentiate whether the reduction of vGluT2 signal is due to reduced vGluT2 expression or physical removal of vGluT2+ synapses, we injected Alexa Fluor™ 488‐conjugated cholera toxin subunit B (CTB488) into the eyes to label all RGC synaptic structures in the dLGN (Fig 6A). If the majority of CTB488+ synapses in the Cdc50a‐RNAi area did not colocalize with vGluT2, it means the synaptic structures are still physically present and vGluT2 protein is reduced. Conversely, it indicates the synapses were physically removed if the majority of CTB488+ synapses colocalize with vGluT2. As shown in Fig 6B and C, ˜ 98% of double‐positive CTB488/mCherry synapses were also vGluT2 positive, which means the change of vGluT2+ density was not due to reduced vGluT2 protein expression but reduced synaptic density. Furthermore, we observed a significant lower CTB+ synaptic density in Cdc50a‐RNAi‐infected area (Fig 6D and E). Taken together, our study results support that Cdc50a knockdown in RGC axonal terminals causes removal of RGC presynaptic structure in the dLGN.
Figure 6. Cdc50a depletion induces synapse loss.

- A schematic diagram of intravitreal AAV2 injection to 1‐month‐old mice followed by CTB488 and CTB647 injection after 29 days. The brains were collected one day later.
- Confocal images of RGC inputs traced by CTB488 and mCherry. CTB488+ RGC inputs in the Cdc50a‐RNAi area overlapped with vGluT2. Scale bar, 20 µm.
- Quantification of colocalization among CTB488, mCherry and vGluT2 described ˜98% CTB488+/mCherry+ RGC inputs were vGluT2+. N = 7 for biological replicates, mean ± SD.
- Images of CTB488 and CTB647 labeling of RGC inputs in the dLGN. Scale bar, 20 µm.
- Quantification of CTB488+ inputs (non‐infected areas) versus CTB647+ inputs (infected areas) in Cdc50a RNAi mice and controls. N = 3 for biological replicates, mean ± SEM, **** P < 0.0001, two‐way ANOVA with Sidak’s multiple comparisons test.
Microglia mediate synaptic pruning by engulfing synapses (Paolicelli et al, 2011; Schafer et al, 2012; Li et al, 2020). To investigate whether the lost vGluT2+ synapses were engulfed by microglia upon Cdc50a knockdown, we measured the volume of vGluT2+ synapses and mCherry+ materials inside microglia 30 days after AAV2 viral infection (at P60). Since there is only little naturally occurring activity‐dependent synapse elimination at P60 (Hong et al, 2014), we found little vGluT2 and mCherry signals inside microglia in the control mice as well as in the non‐infected areas of Cdc50a‐RNAi mice (Fig 7A–C). However, we detected significantly more vGluT2+ and mCherry+ synapses inside microglia of Cdc50a‐RNAi mice (Fig 7A–C). Moreover, the engulfed synapses were partially colocalized with the CD68+ lysosomes (Fig 7A and Appendix Fig S2). Interestingly, only 22% of engulfed vGluT2+ synapses were mCherry positive (Fig 7D), possibly because mCherry protein is more resistant to lysosomal degradation than vGluT2 protein (Doherty et al, 2010; Lee et al, 2021). Taken together, our data demonstrate that CDC50A knockdown results in aberrant synapse elimination by microglia via inducing PS exposure.
Figure 7. CDC50A knockdown results in aberrant synaptic engulfment by microglia.

- The confocal images, 3D‐rendered images, and orthogonal views of microglia engulfing vGluT2+ synapses in controls and Cdc50a‐RNAi mice. Scale bar, 10 µm.
- Quantification of engulfed vGluT2+ synapses in microglia. % Engulfment of vGluT2+ synapse = Volume of vGluT2+ synapse inside microglia / Volume of microglia. N = 5 for biological replicates.
- Quantification of engulfed mCherry+ materials in microglia. N = 5 for biological replicates.
- Quantification of colocalized vGluT2+/mCherry+ synapses within microglia. N = 5 for biological replicates.
Data information: All data are mean ± SD, * P < 0.05, ** P < 0.01, *** P < 0.001, **** P < 0.0001. One‐way ANOVA followed by Tukey’s multiple comparisons test.
Microglial GPR56 in part mediates CDC50A knockdown‐induced synaptic removal
Our recent study showed that microglial GPR56 mediates synaptic pruning by binding to PS (Li et al, 2020). To test whether microglial GPR56 is required for CDC50A knockdown‐induced aberrant synapse elimination, we intravitreally injected Cdc50a‐shRNA AAV2 into both microglial Gpr56 conditional knockout (Gpr56fl/fl; Cx3cr1cre /+) and control (Gpr56 +/+ ; Cx3cr1cre /+) mice. Although vGluT2 signals were reduced after CDC50A knockdown in both microglial Gpr56 conditional knockout mice and controls (Fig 8A), the decrease of synapse density was smaller in the knockout mice compared to controls (Fig 8B and C), supporting that microglial GPR56 is partially required for the aberrant synaptic elimination caused by CDC50A knockdown.
Figure 8. Microglial GPR56 is required for CDC50A knockdown‐induced synapse loss.

- IHC images for vGluT2 staining in the dLGN of microglial Gpr56 conditional knockout mice (Gpr56fl/fl; Cx3cr1cre /+) and controls (Gpr56 +/+ ; Cx3cr1cre /+). Both mice were intravitreally injected with AAV2 carrying Cdc50a shRNA. The yellow squares indicated the AAV2 non‐infected areas and the dotted outlines indicated the AAV2‐infected areas. Scale bar, 200 µm.
- Confocal images of vGluT2+ synapses in the AAV2 non‐infected areas and infected areas of the dLGN. Scale bar, 20 µm.
- Quantification of vGluT2+ synapses in the non‐infected areas and infected areas of microglial GPR56 conditional knockout mice and controls. N = 4 for biological replicates, mean ± SD, * P < 0.05, **** P < 0.0001 by two‐way ANOVA with Sidak’s multiple comparisons test.
Discussion
One fundamental question in neuroscience is how the brain differentiates “good” from “bad” synapses during development. Increasing numbers of players have been identified in the process of synaptic pruning. For example, complement proteins C1q, C3, and complement receptor CR3, MHC class I, PirB, and microglial GPR56 facilitate synaptic removal (Huh et al, 2000; Stevens et al, 2007; Datwani et al, 2009; Paolicelli et al, 2011; Schafer et al, 2012; Djurisic et al, 2018; Li et al, 2020), whereas CD47‐SIRPα signaling pathway protects “good” synapses from inappropriate elimination (Lehrman et al, 2018). Very recently, we and others showed that exposed PS flags synapses destined to be removed (Li et al, 2020; Scott‐Hewitt et al, 2020). However, it is unknown how certain synapses focally expose PS.
Here, we uncover CDC50A, a chaperone protein for flippase, as an important player that negatively affects PS exposure at selective synapses, and thus regulates synaptic removal. CDC50A assists phospholipid flippases translocating PS from the outer to inner leaflet of the plasma membrane (Lenoir et al, 2009; Segawa et al, 2014). We demonstrate that silencing CDC50A by RNAi knockdown results in PS exposure on synapses and aberrant synaptic elimination. Type IV P‐type flippases include 14 human and 15 murine members (Palmgren & Nissen, 2011). Recent work found the expression of flippases varied in different tissues and may play distinct roles. Among these flippases, ATP8A1, ATP11A, and ATP11C were ubiquitously expressed in human and mouse adult tissues, while ATP8A2 and ATP8B2 were present in significant amounts in the brain (Segawa et al, 2016; Wang et al, 2018). Some studies have implied the involvement of flippases in brain functions and neurological disorders. For example, the Atp8a1 −/− mice harbored fewer and weaker excitatory synapses in hippocampal CA1 than wild‐type controls and exhibited an autistic‐like behavior (Kerr et al, 2016). In humans, missense mutations of ATP8A2 are associated with cerebellar ataxia, mental retardation, and disequilibrium (CAMRQ syndrome) (Onat et al, 2013; McMillan et al, 2018). Further studies are needed to identify which member(s) of the flippases is (are) required for PS translocation on synapses.
Many PS recognizing membrane receptors have been discovered in phagocytosis, including GPR56 (Folts et al, 2019; Li et al, 2020), Tim‐4 (Miyanishi et al, 2007), BAI1 (Park et al, 2007), C1q (Païdassi et al, 2008), TREM2 (Shirotani et al, 2019), and indirect receptors Tryo3, Axl, and MerTK (Ohashi et al, 1995; Stitt et al, 1995; Mark et al, 1996; Nagata et al, 1996; Lemke, 2013). The aberrant synapse loss caused by Cdc50a knockdown was reduced but not fully rescued in microglial GPR56 conditional knockout mice (Fig 8), suggesting other molecules are also involved in removing synapses in Cdc50a knockdown mice. Indeed, a recent study found deleting microglial Mertk rescued the loss of inhibitory post‐synapses in Cdc50a conditional knockout mice, indicating MerTK is another PS receptor responsible for synapse elimination (Park et al, 2021). These discoveries inferred that PS‐mediated synapse elimination is a complex mechanism involving different PS receptors.
Synaptic refinement is required for the construction of neural circuitry in the brain. Uncovering the mechanisms of synaptic refinement could lead to novel therapeutics by targeting the synapse‐removal machinery. Our results could be translated to potential therapies by eliminating unwanted synapses in disease‐causing circuits without deleterious effects on neurons.
Materials and Methods
Animals
All male mice were handled according to the guidelines of Animal Care and Use Committee at University of California, San Francisco. Gpr56fl/fl mice were generated as previously described (Giera et al, 2015). The C57BL/6J (#000664) and Cx3Cr1‐cre (B6J.B6N(Cg)‐Cx3cr1tm1.1(cre)Jung /J, #025524) mice were obtained from Jackson Laboratories. Gpr56fl/fl ; Cx3Cr1‐cre +/− was used as microglial Gpr56 conditional knockout mice.
Synaptosome isolation
Purification synaptosomes from mouse brains were carried out as previously described (Luquet et al, 2017). Briefly, mouse brains were perfused with ice‐cold phosphate‐buffered saline (PBS) and collected. Minced brains were homogenized in a glass grinder with Iso‐osmolar buffer (0.32 M sucrose, 4 mM HEPES pH = 7.4). The homogenate was centrifuged at 1,000 g for 8 min at 4°C, and the pellet containing nuclei and large debris was discarded. The supernatant was further centrifuged at 12,500 g for 13 min at 4°C in order to obtain pelleted crude synaptosomes. The synaptosome pellet was then re‐suspended in 1 ml of Iso‐osmolar buffer and layered slowly onto the top of a discontinuous sucrose gradients (5 ml of 1.2 M sucrose buffer on the bottom, 5 ml of 0.8 M sucrose buffer on the top). The final ultracentrifuge was run at 50,000 g for 1 h at 4°C and yielded a synaptosome enriched fraction. For Western blot (Zhu et al, 2019), synaptosomes were mixed with loading buffer and incubated for 10 min at 95°C. Primary antibodies for CDC50A (CDC50‐7F4 hybridoma supernatant diluted at 1:50), PSD95 (1:5,000, monoclonal, abcam, #ab2723), and GAPDH (1:50,000, abcam, #ab181602) were used.
Primary neuron culture
Cortical neurons from E16.5 mouse fetuses were used for culture as described previously (Cicero & Herrup, 2005; Zhu et al, 2020). Briefly, mouse cortex was dissected out in cold PBS supplemented with 1mg/ml glucose (Sigma, #G7021) and cut into small pieces followed by a 12 min 0.25% trypsin‐EDTA (Gibco, #2520056) treatment at 37°C. The tissue was mildly triturated several times and filtered through a 40‐µm cell strainer (BD Biosciences). Isolated neurons were plated at a density of 55,000 per PDL‐coated 24‐well plate or 13‐mm glass coverslips and then incubated at 37°C in a humidified atmosphere of 5% CO2. A half of NeuroBasal medium (Gibco, #21103049) with 2% B‐27 supplement (Gibco, #17504044), 2 mM L‐alanyl‐L‐glutamine (Gibco, GlutaMAX, #35050079), and 1% penicillin‐streptomycin (Gibco, #15140122) were replaced with fresh medium in every 4 days. For neuronal inactivation, a cocktail of 2 µM TTX, 50 µM D‐AP5 and 20 µM NBQX was supplemented to culture medium starting on DIV21.
To silence Cdc50a, 0.5 µM Accell SMARTpool (Dharmacon, # E‐063902‐00) containing four Cdc50a individual siRNAs were directly added to cultured neurons. The four target sequences are as follows: 5′‐GUGAGAUCGAGAUUGAUUA‐3′, 5′‐GGAUGUUAUUUAUUGGAUA‐3′, 5′‐GAUUCAUUUGCAAGUAUU‐3′, 5′‐GUUACUUGAUUUAUGGAUA‐3′.
QPCR
The RNA of cultured neurons was purified using the miRCURYTM RNA isolation kit (EXIQON, Cat. #300110). The RNA was reverse‐transcribed to generate cDNA with a kit of SuperScript™ IV VILO™ Master Mix with ezDNAse (Invitrogen, Cat. # 11766050). Quantitative PCRs were performed with LightCycler® 480 SYBR Green I Master (Roche, Cat. # 04707516001) in a Roche LightCycler® 480 II machine. Forward and reverse primers for Cdc50a (408‐477) are 5′‐CCATCGGCATCGGCATCTTC‐3′ and 5′‐TCTGTTCCAGTGTAATCAATCTCG‐3′, respectively. Forward and reverse primers for Cdc50a (438‐529) are 5′‐ACAACATCCGTGAGATCGAGATTGA‐3′ and 5′‐AGCACAAGATGTCACATTCGGAGA‐3′, respectively.
Immunofluorescence
For tissue immunostaining, mouse brains were perfused with ice‐cold PBS and fixed with 4% PFA at 4°C overnight, and then cryoprotected with 30% sucrose. Brain tissues were cryosectioned at 14 µm or 40 µm. Sections were blocked with the buffer (10% Goat serum, 1% BSA, 0.3% Triton X‐100 in PBS) for 2 h and then incubated with primary antibodies overnight at 4°C. For CDC50A immunostaining, CDC50‐7F4 hybridoma supernatant (Coleman & Molday, 2011) was diluted at 1:2 in PBS containing 2.5% Goat serum and 0.05% Triton X‐100, and incubated with tissues for 48 h at 4°C. Appropriate Alexa Fluor‐conjugated secondary antibodies were used at 1:500 or 1:1,000 dilution and incubated with 14‐µm slices for 1 h or 40‐µm slices for 2 h at room temperature.
For primary neuron staining, cells were fixed with 2% PFA for 20 min. After washing with PBS, the cells were blocked with the buffer (10% Goat serum, 1% BSA, 0.3% Triton X‐100 in PBS) for 1 h and stained overnight with primary antibodies at 4°C and then secondary antibodies at room temperature for 2 h.
The primary antibody dilutions were shown below. Guinea pig anti‐vGlut2, 1:1,000, Millipore Sigma AB2251‐I; guinea pig anti‐vGlut1, 1:1,000, Millipore Sigma AB5905; rabbit anti‐RIM1, 1:1,000, Synaptic Systems 140 003; mouse anti‐Gephyrin, 1:1,000, Synaptic Systems 147 011; rabbit anti‐GluR1, 1:1,000, Cell signaling 13185S; rabbit synaptophysin, 1:500, abcam, ab16659; rabbit anti‐synapsin I, 1:1,000, Millipore Sigma, AB1543P; rabbit anti‐Iba1, 1:250, Wako 019‐19741; guinea pig anti‐Iba1, 1:500, Synaptic Systems 234 004; rat anti‐CD68, 1:250, AbD Serotec MCA1957; chicken anti‐MAP2, 1:5000, abcam ab5392; rabbit anti‐Cleaved Caspase‐3, 1:200, Cell signaling #9661; mouse anti‐APP, 1:200, Millipore MAB348; rabbit anti‐neurofilament, 1:1,000, Sigma N4142; rabbit anti‐Beta III Tubulin (Tuj1), 1:500, Covance PRB‐435P.
PS labeling with pSIVA
To detect PS in cultured neurons, pSIVA (Novus Biologicals, #NBP2‐29382) and PI were added directly to cultures at 10 µl/ml and 5 µl/ml, respectively. Since neurobasal medium contains 1.8 mM Ca2+, no extra Ca2+ was added to the culture. After 10 min, the neurons were observed under an inverted Leica SP5 confocal microscope built with a live‐cell imaging culture chamber maintaining 5% CO2 and 37°C. After 1 h, cells were fixed in 2% PFA for 15 min and followed by the standard immunofluorescence staining.
To detect exposed PS in the dLGN, AAV2 virus intravitreally injected mice were sacrificed and sectioned at 180 µm using a vibratome. The brain slices containing dLGN were immediately immersed in HBSS containing 20 µl/ml pSIVA and 2 mM Ca2+. The dLGN was imaged under microscopes within 30 min ex vivo.
Production of adeno‐associated viruses (AAVs)
Vectors of AAV‐Cdc50a‐shRNA were made by cloning a shRNA targeting to Cdc50a into an AAV plasmid consisting of the U6 promoter (a type III RNA polymerase III promoter) and one cDNA coding a fused membrane protein hChR2‐mCherry driven by the CMV promoter. The target sequence against Cdc50a is 5′‐GCGCTATTGCCAACAGCAT‐3'. The scrambled shRNA sequence is 5′‐CCTAAGGTTAAGTCGCCCTCG‐3′. These pAAV vectors were packaged into AAV2 serotype, and titers are 1.242 × 10¹² and 1.913 × 10¹² genome copies/ml, respectively. AAVs were generated by the Viral Core of Boston Children’s Hospital.
Intravitreal Injection
1‐month‐old mice were anesthetized prior to intravitreal injection with a fine glass pipette attached to the Hamilton syringe via a plastic tube. To block RGC action potential, 0.5 µl of 100 µM TTX was injected into each eye for 5 consecutive days before sacrifice. 0.5 µl of PBS was injected as controls. To knockdown Cdc50a, all mice were injected with 3 µl of AAV2 viruses into one eye, except those who received intravitreal injection into both eyes in Fig 5. For CTB labeling, each eye was injected with 3 µl of 0.2% CTB488 or CTB647 for 24 h before sacrifice. After injection, antibiotic ophthalmic ointment was applied to the eyes. Mice were kept on a warm pad until awoken.
Statistical analysis
All data are shown as mean ± SD or mean ± SEM as indicated in figure legends. Asterisks indicate significance: ****P < 0.0001, ***P < 0.001, **P < 0.01, *P < 0.05. All effects of genotype were analyzed by Student’s t‐test or one‐way ANOVA, or two‐way ANOVA (Graph Pad Software, Inc.).
Author contributions
TL and XP conceived and designed the experiments, performed data analyses, and wrote the manuscript. TL performed most of the experiments. DY and HO contribute to synapse quantification related experiments. BZ helped with primary neuronal culture. LW and AK assisted synaptosome‐related experiments. RSM contributed CDC50A antibodies. XJ contributed to data mining. All authors read and edited the manuscript.
Conflict of interest
These authors declare that they have no conflict of interest.
Supporting information
Appendix
Expanded View Figures PDF
Source Data for Expanded View
Source Data for Figure 1A
Acknowledgments
We thank Dr. Chen Wang, Yu Zhang, and Yaxian Wang at Viral Core of Boston Children’s Hospital for providing plasmid vectors and generating viruses. This research was supported in part by NINDS grants R01 NS094164 (X.P.), R21 NS108312 (X.P.), P01 NS083513 (X.P.), and R01 NS108446 (X.P.).
The EMBO Journal (2021) 40: e107915.
Data availability
This study includes no data deposited in external repositories.
References
- Cheadle L, Rivera SA, Phelps JS, Ennis KA, Stevens B, Burkly LC, Lee WA, Greenberg ME (2020) Sensory experience engages microglia to shape neural connectivity through a non‐phagocytic mechanism. Neuron 108: 451–468.e9 [DOI] [PMC free article] [PubMed] [Google Scholar]
- Cheadle L, Tzeng CP, Kalish BT, Harmin DA, Rivera S, Ling E, Nagy MA, Hrvatin S, Hu L, Stroud H et al (2018) Visual experience‐dependent expression of Fn14 is required for retinogeniculate refinement. Neuron 99: 525–539.e10 [DOI] [PMC free article] [PubMed] [Google Scholar]
- Chen C, Regehr WG (2000) Developmental remodeling of the retinogeniculate synapse. Neuron 28: 955–966 [DOI] [PubMed] [Google Scholar]
- Cicero S, Herrup K (2005) Cyclin‐dependent kinase 5 is essential for neuronal cell cycle arrest and differentiation. J Neurosci 25: 9658–9668 [DOI] [PMC free article] [PubMed] [Google Scholar]
- Cizeron M, Qiu Z, Koniaris B, Gokhale R, Komiyama NH, Fransén E, Grant SGN (2020) A brainwide atlas of synapses across the mouse life span. Science 369: 270–275 [DOI] [PMC free article] [PubMed] [Google Scholar]
- Coleman JA, Molday RS (2011) Critical role of the beta‐subunit CDC50A in the stable expression, assembly, subcellular localization, and lipid transport activity of the P4‐ATPase ATP8A2. J Biol Chem 286: 17205–17216 [DOI] [PMC free article] [PubMed] [Google Scholar]
- Datwani A, McConnell MJ, Kanold PO, Micheva KD, Busse B, Shamloo M, Smith SJ, Shatz CJ (2009) Classical MHCI molecules regulate retinogeniculate refinement and limit ocular dominance plasticity. Neuron 64: 463–470 [DOI] [PMC free article] [PubMed] [Google Scholar]
- Dhande OS, Huberman AD (2014) Retinal ganglion cell maps in the brain: implications for visual processing. Curr Opin Neurobiol 24: 133–142 [DOI] [PMC free article] [PubMed] [Google Scholar]
- Djurisic M, Brott BK, Saw NL, Shamloo M, Shatz CJ (2018) Activity‐dependent modulation of hippocampal synaptic plasticity via PirB and endocannabinoids. Mol Psychiatry 24: 1206–1219 [DOI] [PMC free article] [PubMed] [Google Scholar]
- Doherty GP, Bailey K, Lewis PJ (2010) Stage‐specific fluorescence intensity of GFP and mCherry during sporulation In Bacillus Subtilis . BMC Res Notes 3: 303 [DOI] [PMC free article] [PubMed] [Google Scholar]
- Evans GJ (2015) The synaptosome as a model system for studying synaptic physiology. Cold Spring Harb Protoc 2015: 421–424 [DOI] [PubMed] [Google Scholar]
- Feng W, Yasumura D, Matthes MT, LaVail MM, Vollrath D (2002) Mertk triggers uptake of photoreceptor outer segments during phagocytosis by cultured retinal pigment epithelial cells. J Biol Chem 277: 17016–17022 [DOI] [PubMed] [Google Scholar]
- Folts CJ, Giera S, Li T, Piao X (2019) Adhesion G protein‐coupled receptors as drug targets for neurological diseases. Trends Pharmacol Sci 40: 278–293 [DOI] [PMC free article] [PubMed] [Google Scholar]
- Giera S, Deng Y, Luo R, Ackerman SD, Mogha A, Monk KR, Ying Y, Jeong S‐J, Makinodan M, Bialas AR et al (2015) The adhesion G protein‐coupled receptor GPR56 is a cell‐autonomous regulator of oligodendrocyte development. Nat Commun 6: 6121 [DOI] [PMC free article] [PubMed] [Google Scholar]
- Guido W (2008) Refinement of the retinogeniculate pathway. J Physiol 586: 4357–4362 [DOI] [PMC free article] [PubMed] [Google Scholar]
- Hammer S, Monavarfeshani A, Lemon T, Su J, Fox MA (2015) Multiple retinal axons converge onto relay cells in the adult mouse thalamus. Cell Rep 12: 1575–1583 [DOI] [PMC free article] [PubMed] [Google Scholar]
- Hebb CO, Whittaker VP (1958) Intracellular distributions of acetylcholine and choline acetylase. J Physiol 142: 187–196 [DOI] [PMC free article] [PubMed] [Google Scholar]
- Hong S, Beja‐Glasser VF, Nfonoyim BM, Frouin A, Li S, Ramakrishnan S, Merry KM, Shi Q, Rosenthal A, Barres BA et al (2016) Complement and microglia mediate early synapse loss in Alzheimer mouse models. Science 352: 712–716 [DOI] [PMC free article] [PubMed] [Google Scholar]
- Hong YK, Park S, Litvina EY, Morales J, Sanes JR, Chen C (2014) Refinement of the retinogeniculate synapse by bouton clustering. Neuron 84: 332–339 [DOI] [PMC free article] [PubMed] [Google Scholar]
- Hooks BM, Chen C (2006) Distinct roles for spontaneous and visual activity in remodeling of the retinogeniculate synapse. Neuron 52: 281–291 [DOI] [PubMed] [Google Scholar]
- Hua JY, Smith SJ (2004) Neural activity and the dynamics of central nervous system development. Nat Neurosci 7: 327–332 [DOI] [PubMed] [Google Scholar]
- Huh GS, Boulanger LM, Du H, Riquelme PA, Brotz TM, Shatz CJ (2000) Functional requirement for class I MHC in CNS development and plasticity. Science 290: 2155–2159 [DOI] [PMC free article] [PubMed] [Google Scholar]
- Katz LC, Shatz CJ (1996) Synaptic activity and the construction of cortical circuits. Science 274: 1133–1138 [DOI] [PubMed] [Google Scholar]
- Kerr DJ, Marsillo A, Guariglia SR, Budylin T, Sadek R, Menkes S, Chauhan A, Wen GY, McCloskey DP, Wieraszko A et al (2016) Aberrant hippocampal Atp8a1 levels are associated with altered synaptic strength, electrical activity, and autistic‐like behavior. Biochem Biophys Acta 1862: 1755–1765 [DOI] [PubMed] [Google Scholar]
- Kim YE, Chen J, Chan JR, Langen R (2010a) Engineering a polarity‐sensitive biosensor for time‐lapse imaging of apoptotic processes and degeneration. Nat Methods 7: 67–73 [DOI] [PMC free article] [PubMed] [Google Scholar]
- Kim YE, Chen J, Langen R, Chan JR (2010b) Monitoring apoptosis and neuronal degeneration by real‐time detection of phosphatidylserine externalization using a polarity‐sensitive indicator of viability and apoptosis. Nat Protoc 5: 1396–1405 [DOI] [PMC free article] [PubMed] [Google Scholar]
- Land PW, Kyonka E, Shamalla‐Hannah L (2004) Vesicular glutamate transporters in the lateral geniculate nucleus: expression of VGLUT2 by retinal terminals. Brain Res 996: 251–254 [DOI] [PubMed] [Google Scholar]
- Lee JH, Kim JY, Noh S, Lee H, Lee SY, Mun JY, Park H, Chung WS (2021) Astrocytes phagocytose adult hippocampal synapses for circuit homeostasis. Nature 590: 612–617 [DOI] [PubMed] [Google Scholar]
- Lehrman EK, Wilton DK, Litvina EY, Welsh CA, Chang ST, Frouin A, Walker AJ, Heller MD, Umemori H, Chen C et al (2018) CD47 Protects synapses from excess microglia‐mediated pruning during development. Neuron 100: 120–134.e6 [DOI] [PMC free article] [PubMed] [Google Scholar]
- Lemke G (2013) Biology of the TAM receptors. Cold Spring Harb Perspect Biol 5: a009076 [DOI] [PMC free article] [PubMed] [Google Scholar]
- Lenoir G, Williamson P, Puts CF, Holthuis JC (2009) Cdc50p plays a vital role in the ATPase reaction cycle of the putative aminophospholipid transporter Drs2p. J Biol Chem 284: 17956–17967 [DOI] [PMC free article] [PubMed] [Google Scholar]
- Leventis PA, Grinstein S (2010) The distribution and function of phosphatidylserine in cellular membranes. Annu Rev Biophys 39: 407–427 [DOI] [PubMed] [Google Scholar]
- Li T, Chiou B, Gilman CK, Luo R, Koshi T, Yu D, Oak HC, Giera S, Johnson‐Venkatesh E, Muthukumar AK et al (2020) A splicing isoform of GPR56 mediates microglial synaptic refinement via phosphatidylserine binding. EMBO J 39: e104136 [DOI] [PMC free article] [PubMed] [Google Scholar]
- Luquet E, Biesemann C, Munier A, Herzog E (2017) Purification of synaptosome populations using fluorescence‐activated synaptosome sorting. Methods Mol Biol 1538: 121–134 [DOI] [PubMed] [Google Scholar]
- Macosko E, Basu A, Satija R, Nemesh J, Shekhar K, Goldman M, Tirosh I, Bialas A, Kamitaki N, Martersteck E et al (2015) Highly parallel genome‐wide expression profiling of individual cells using nanoliter droplets. Cell 161: 1202–1214 [DOI] [PMC free article] [PubMed] [Google Scholar]
- Mark MR, Chen J, Hammonds RG, Sadick M, Godowsk PJ (1996) Characterization of Gas6, a member of the superfamily of G domain‐containing proteins, as a ligand for Rse and Axl. J Biol Chem 271: 9785–9789 [DOI] [PubMed] [Google Scholar]
- McMillan HJ, Telegrafi A, Singleton A, Cho MT, Lelli D, Lynn FC, Griffin J, Asamoah A, Rinne T, Erasmus CE et al (2018) Recessive mutations in ATP8A2 cause severe hypotonia, cognitive impairment, hyperkinetic movement disorders and progressive optic atrophy. Orphanet J Rare Dis 13: 86 [DOI] [PMC free article] [PubMed] [Google Scholar]
- Miyanishi M, Tada K, Koike M, Uchiyama Y, Kitamura T, Nagata S (2007) Identification of Tim4 as a phosphatidylserine receptor. Nature 450: 435–439 [DOI] [PubMed] [Google Scholar]
- Nagata K, Ohashi K, Nakano T, Arita H, Zong C, Hanafusa H, Mizuno K (1996) Identification of the product of growth arrest‐specific gene 6 as a common ligand for Axl, Sky, and Mer receptor tyrosine kinases. J Biol Chem 271: 30022–30027 [DOI] [PubMed] [Google Scholar]
- Neher JJ, Emmrich JV, Fricker M, Mander PK, Thery C, Brown GC (2013) Phagocytosis executes delayed neuronal death after focal brain ischemia. Proc Natl Acad Sci U S A 110: E4098–E4107 [DOI] [PMC free article] [PubMed] [Google Scholar]
- Ohashi K, Nagata K, Toshima J, Nakano T, Arita H, Tsuda H, Suzuki K, Mizuno K (1995) Stimulation of sky receptor tyrosine kinase by the product of growth arrest‐specific gene 6. J Biol Chem 270: 22681–22684 [DOI] [PubMed] [Google Scholar]
- Onat OE, Gulsuner S, Bilguvar K, Nazli Basak A, Topaloglu H, Tan M, Tan U, Gunel M, Ozcelik T (2013) Missense mutation in the ATPase, aminophospholipid transporter protein ATP8A2 is associated with cerebellar atrophy and quadrupedal locomotion. Eur J Hum Genet 21: 281–285 [DOI] [PMC free article] [PubMed] [Google Scholar]
- Païdassi H, Tacnet‐Delorme P, Garlatti V, Darnault C, Ghebrehiwet B, Gaboriaud C, Arlaud GJ, Frachet P (2008) C1q binds phosphatidylserine and likely acts as a multiligand‐bridging molecule in apoptotic cell recognition. J Immunol 180: 2329–2338 [DOI] [PMC free article] [PubMed] [Google Scholar]
- Palmgren MG, Nissen P (2011) P‐type ATPases. Annu Rev Biophys 40: 243–266 [DOI] [PubMed] [Google Scholar]
- Paolicelli RC, Bolasco G, Pagani F, Maggi L, Scianni M, Panzanelli P, Giustetto M, Ferreira TA, Guiducci E, Dumas L et al (2011) Synaptic pruning by microglia is necessary for normal brain development. Science 333: 1456–1458 [DOI] [PubMed] [Google Scholar]
- Park D, Tosello‐Trampont AC, Elliott MR, Lu M, Haney LB, Ma Z, Klibanov AL, Mandell JW, Ravichandran KS (2007) BAI1 is an engulfment receptor for apoptotic cells upstream of the ELMO/Dock180/Rac module. Nature 450: 430–434 [DOI] [PubMed] [Google Scholar]
- Park J, Choi Y, Jung E, Lee SH, Sohn JW, Chung WS (2021) Microglial MERTK eliminates phosphatidylserine‐displaying inhibitory post‐synapses. EMBO J 40: e107121 [DOI] [PMC free article] [PubMed] [Google Scholar]
- Peet G, Bennett FC, Bennett ML (2020) Please eat (only part) of me: synaptic phosphatidylserine cues microglia to feast: two new studies identify how a common apoptotic cell flag is used to sculpt neural circuits. EMBO J 39: e105924 [DOI] [PMC free article] [PubMed] [Google Scholar]
- Penn AA, Riquelme PA, Feller MB, Shatz CJ (1998) Competition in retinogeniculate patterning driven by spontaneous activity. Science 279: 2108–2112 [DOI] [PubMed] [Google Scholar]
- Sanes JR, Lichtman JW (1999) Development of the vertebrate neuromuscular junction. Annu Rev Neurosci 22: 389–442 [DOI] [PubMed] [Google Scholar]
- Schafer DP, Lehrman EK, Kautzman AG, Koyama R, Mardinly AR, Yamasaki R, Ransohoff RM, Greenberg ME, Barres BA, Stevens B (2012) Microglia sculpt postnatal neural circuits in an activity and complement‐dependent manner. Neuron 74: 691–705 [DOI] [PMC free article] [PubMed] [Google Scholar]
- Scott‐Hewitt N, Perrucci F, Morini R, Erreni M, Mahoney M, Witkowska A, Carey A, Faggiani E, Schuetz LT, Mason S et al (2020) Local externalization of phosphatidylserine mediates developmental synaptic pruning by microglia. EMBO J 39: e105380 [DOI] [PMC free article] [PubMed] [Google Scholar]
- Segawa K, Kurata S, Yanagihashi Y, Brummelkamp TR, Matsuda F, Nagata S (2014) Caspase‐mediated cleavage of phospholipid flippase for apoptotic phosphatidylserine exposure. Science 344: 1164–1168 [DOI] [PubMed] [Google Scholar]
- Segawa K, Kurata S, Nagata S (2016) Human type IV P‐type ATPases that work as plasma membrane phospholipid flippases and their regulation by caspase and calcium. J Biol Chem 291: 762–772 [DOI] [PMC free article] [PubMed] [Google Scholar]
- Segawa K, Nagata S (2015) An apoptotic 'Eat Me' signal: phosphatidylserine exposure. Trends Cell Biol 25: 639–650 [DOI] [PubMed] [Google Scholar]
- Segawa K, Suzuki J, Nagata S (2011) Constitutive exposure of phosphatidylserine on viable cells. Proc Natl Acad Sci U S A 108: 19246–19251 [DOI] [PMC free article] [PubMed] [Google Scholar]
- Sekar A, Bialas AR, de Rivera H, Davis A, Hammond TR, Kamitaki N, Tooley K, Presumey J, Baum M, Van Doren V et al (2016) Schizophrenia risk from complex variation of complement component 4. Nature 530: 177–183 [DOI] [PMC free article] [PubMed] [Google Scholar]
- Sellgren CM, Gracias J, Watmuff B, Biag JD, Thanos JM, Whittredge PB, Fu T, Worringer K, Brown HE, Wang J et al (2019) Increased synapse elimination by microglia in schizophrenia patient‐derived models of synaptic pruning. Nat Neurosci 22: 374–385 [DOI] [PMC free article] [PubMed] [Google Scholar]
- Sharom FJ (2011) Flipping and flopping–lipids on the move. IUBMB Life 63: 736–746 [DOI] [PubMed] [Google Scholar]
- Shatz CJ (1983) The prenatal development of the cat's retinogeniculate pathway. J Neurosci 3: 482–499 [DOI] [PMC free article] [PubMed] [Google Scholar]
- Shirotani K, Hori Y, Yoshizaki R, Higuchi E, Colonna M, Saito T, Hashimoto S, Saito T, Saido TC, Iwata N (2019) Aminophospholipids are signal‐transducing TREM2 ligands on apoptotic cells. Sci Rep 9: 7508 [DOI] [PMC free article] [PubMed] [Google Scholar]
- Stevens B, Allen NJ, Vazquez LE, Howell GR, Christopherson KS, Nouri N, Micheva KD, Mehalow AK, Huberman AD, Stafford B et al (2007) The classical complement cascade mediates CNS synapse elimination. Cell 131: 1164–1178 [DOI] [PubMed] [Google Scholar]
- Stitt TN, Conn G, Goret M, Lai C, Bruno J, Radzlejewski C, Mattsson K, Fisher J, Gies DR, Jones PF et al (1995) The anticoagulation factor protein S and its relative, Gas6, are ligands for the Tyro 3/Axl family of receptor tyrosine kinases. Cell 80: 661–670 [DOI] [PubMed] [Google Scholar]
- Suzuki J, Fujii T, Imao T, Ishihara K, Kuba H, Nagata S (2013) Calcium‐dependent phospholipid scramblase activity of TMEM16 protein family members. J Biol Chem 288: 13305–13316 [DOI] [PMC free article] [PubMed] [Google Scholar]
- Suzuki J, Umeda M, Sims PJ, Nagata S (2010) Calcium‐dependent phospholipid scrambling by TMEM16F. Nature 468: 834–838 [DOI] [PubMed] [Google Scholar]
- Tang G, Gudsnuk K, Kuo S‐H, Cotrina M, Rosoklija G, Sosunov A, Sonders M, Kanter E, Castagna C, Yamamoto AI et al (2014) Loss of mTOR‐dependent macroautophagy causes autistic‐like synaptic pruning deficits. Neuron 83: 1131–1143 [DOI] [PMC free article] [PubMed] [Google Scholar]
- Tremblay M, Lowery RL, Majewska AK (2010) Microglial interactions with synapses are modulated by visual experience. PLoS Biol 8: e1000527 [DOI] [PMC free article] [PubMed] [Google Scholar]
- Tufail Y, Cook D, Fourgeaud L, Powers CJ, Merten K, Clark CL, Hoffman E, Ngo A, Sekiguchi KJ, O’Shea CC et al (2017) Phosphatidylserine exposure controls viral innate immune responses by microglia. Neuron 93: 574–586.e8 [DOI] [PMC free article] [PubMed] [Google Scholar]
- Verhoven B, Schlegel RA, Williamson P (1995) Mechanisms of phosphatidylserine exposure, a phagocyte recognition signal, on apoptotic T lymphocytes. J Exp Med 182: 1597–1601 [DOI] [PMC free article] [PubMed] [Google Scholar]
- Wang J, Molday LL, Hii T, Coleman JA, Wen T, Andersen JP, Molday RS (2018) Proteomic analysis and functional characterization of P4‐ATPase phospholipid flippases from murine tissues. Sci Rep 8: 10795 [DOI] [PMC free article] [PubMed] [Google Scholar]
- Zhu B, Li Z, Qian PY, Herrup K (2020) Marine bacterial extracts as a new rich source of drugs against Alzheimer's disease. J Neurochem 152: 493–508 [DOI] [PubMed] [Google Scholar]
- Zhu B, Luo R, Jin P, Li T, Oak HC, Giera S, Monk KR, Lak P, Shoichet BK, Piao X (2019) GAIN domain‐mediated cleavage is required for activation of G protein‐coupled receptor 56 (GPR56) by its natural ligands and a small‐molecule agonist. J Biol Chem 294: 19246–19254 [DOI] [PMC free article] [PubMed] [Google Scholar]