

Abstract
While aggregation‐prone proteins are known to accelerate aging and cause age‐related diseases, the cellular mechanisms that drive their cytotoxicity remain unresolved. The orthologous proteins MOAG‐4, SERF1A, and SERF2 have recently been identified as cellular modifiers of such proteotoxicity. Using a peptide array screening approach on human amyloidogenic proteins, we found that SERF2 interacted with protein segments enriched in negatively charged and hydrophobic, aromatic amino acids. The absence of such segments, or the neutralization of the positive charge in SERF2, prevented these interactions and abolished the amyloid‐promoting activity of SERF2. In protein aggregation models in the nematode worm Caenorhabditis elegans, protein aggregation and toxicity were suppressed by mutating the endogenous locus of MOAG‐4 to neutralize charge. Our data indicate that MOAG‐4 and SERF2 drive protein aggregation and toxicity by interactions with negatively charged segments in aggregation‐prone proteins. Such charge interactions might accelerate primary nucleation of amyloid by initiating structural changes and by decreasing colloidal stability. Our study points at charge interactions between cellular modifiers and amyloidogenic proteins as potential targets for interventions to reduce age‐related protein toxicity.
Keywords: amyloid, MOAG‐4, protein aggregation, protein quality control, SERF
Subject Categories: Neuroscience, Translation & Protein Quality
While amyloidogenic proteins are often stabilized by their supercharged segments, the specific interaction with and shielding of these charges by MOAG/SERF2 drives aggregation of amyloidogenic proteins in vitro and in vivo.

Introduction
Protein homeostasis declines with aging (López‐Otín et al, 2013; Walther et al, 2015; Stroo et al, 2017; Klaips et al, 2018). This decline results in an increased accumulation of aggregation‐prone proteins, which accelerates aging and is associated with a wide range of age‐related disorders, including Alzheimer’s and Parkinson’s diseases. Although the different proteins involved in these diseases are usually unrelated in sequence and native structure, they share the tendency to convert into ordered, cross‐ß structures known as amyloid fibrils (Serpell, 2000; DeMarco & Daggett, 2004; Tuttle et al, 2016). Structural conversions early in the aggregation process play an important role in amyloid formation and the associated cellular toxicity (Kayed & Lasagna‐Reeves, 2012; Kim et al, 2016; Sangwan et al, 2017). The cellular mechanisms that drive these early structural conversions, however, are poorly understood, and uncovering them is key for the development of interventions to prevent such toxic structural changes in amyloid‐associated diseases.
For several structurally unrelated amyloidogenic proteins, previous studies have identified proteins that enhance such structural conversions, namely modifier of aggregation‐4 (MOAG‐4) in the nematode worm Caenorhabditis elegans and its human orthologs small EDRK‐rich factors (SERF) 1A and 2 (Van Ham et al, 2010; Falsone et al, 2012; Yoshimura et al, 2017). In vitro studies with purified proteins have shown that SERF1A preferentially promotes the aggregation of amyloidogenic proteins—including alpha‐synuclein, amyloid beta, and prion protein—above the aggregation of non‐amyloidogenic proteins (Falsone et al, 2012). MOAG‐4/SERF1A is involved early on in the aggregation process. In the case of alpha‐synuclein, MOAG‐4 and SERF hinder intermolecular interactions within the protein, through electrostatic interactions (Yoshimura et al, 2017; Merle et al, 2019). This results in a more aggregation‐prone conformation of alpha‐synuclein, which in turn seeds the formation of amyloid fibrils that can eventually form large, insoluble aggregates (Falsone et al, 2012; Yoshimura et al, 2017; Merle et al, 2019). In addition, previous studies have shown that MOAG‐4 and SERF1A act transiently and are not incorporated in amyloid fibrils themselves (Falsone et al, 2012; Yoshimura et al, 2017). The shared mechanism by which MOAG‐4 and SERFs bind to and induce the structural conversion of other amyloidogenic proteins remains nevertheless unknown.
We therefore use a peptide array screening approach to identify interactions between SERF2 and proteins in the hope that this would give us insight into SERF2’s mechanism of action. Our findings suggest that SERF2 affects the earliest steps of the aggregation process by charge complementation on amyloidogenic proteins, thereby inducing structural conversions that accelerate fibril formation.
Results
SERF2 selectively binds to negatively charged peptides
To determine how SERF catalyzes amyloid formation of multiple unrelated amyloidogenic proteins, we first used a peptide microarray‐based approach to screen for SERF2‐interacting amino acid sequences. The microarray contained 12‐mer peptide fragments from 27 full‐length parent proteins and four dipeptide repeat polymers. Of these proteins, 19 have been classified as amyloidogenic, though many proteins can form amyloids under the appropriate conditions (Chiti & Dobson, 2017; Benson et al, 2019) (Appendix Table S1, column A). Four of these amyloidogenic proteins, Abeta, α‐synuclein, huntingtin, and prion protein, have previously been shown to functionally interact with SERF (Appendix Table S1, proteins marked in bold) (Van Ham et al, 2010; Falsone et al, 2012; Merle et al, 2019; Meyer et al, 2020). The other proteins represented on the slide included three other disease‐related aggregation‐prone proteins, four disease‐related dipeptide repeat polymers, a protein for which amyloid formation is part of its physiological function, and four non‐amyloidogenic proteins (Appendix Table S1, columns B, C, D).
The full‐length amino acid sequences for each of these proteins were represented by 12‐mer peptides that overlapped by eight residues, hence producing a sliding window over each protein sequence (Fig 1A). The microarray contained duplicates of each peptide, randomly distributed over the array (Fig 1A and Dataset EV1). Binding of ATTO633‐labeled SERF2 (UniProt identifier P84101‐1, 59 amino acids) was visualized by fluorescent laser scanning and quantified based on fluorescence intensity (Dataset EV1). Peptides were classified as SERF2 binders or non‐binders based on their fluorescence intensity relative to a set of glycine controls (Gly) (Fig 1B and Dataset EV1). Therefore, in each of three repeat experiments, the distribution of fluorescence intensities of the Gly control peptides was assessed (Fig 1B, upper panels). For each experiment, the cutoff was determined as the mean fluorescence of the Gly control peptides plus twice their standard deviation (red dashed lines in Fig 1B). In each separate repeat, peptides were then classified as binders when the RFU (relative fluorescence unit) values of both duplicates on the array were higher than the cutoff value (Fig 1B and Dataset EV1). Eventually, only peptides for which this was the case in all three experiments were classified as actual binders (Dataset EV2). Peptides with RFUs below the threshold in each experiment were defined as non‐binders, and peptides for which the classification varies between repeats were classified as “ambiguous”. In this way, 653 peptides were identified as binders, 2,333 as non‐binders, and 291 as ambiguous.
Figure 1. SERF2‐interacting peptide sequences are enriched for negatively charged amino acids.

-
ASchematic representation of the peptide microarray screen. Green color represents autofluorescence of peptides at 532 nm.
-
BHistograms of the fluorescence intensities of wild‐type ATTO633‐labeled SERF2, bound to the peptides on the microarray in each of three independent repeats. Fluorescence intensities for glycine (Gly) controls are marked in yellow (top panels). Red dashed line indicates cutoff between binders and non‐binders. The numbers of binders and non‐binders identified in each experiment are indicated. Peptides are only classified as binders when both instances of the duplicate have a higher RFU than the cutoff.
-
CEnrichment scores (ln(probability ratio)) of all amino acids in SERF2 binding (n = 653) versus SERF2 non‐binding peptides (n = 2,333). Statistical significance was determined through hypergeometric testing with the Bonferroni correction for multiple comparisons. *P < 0.05, ***P < 0.001, and ****P < 0.0001.
-
D, ECorrelation of the natural logarithm of mean wild‐type SERF2 binding intensities (background‐corrected per experiment) with the cumulative amino acid enrichment scores (D) or net charge (E) of the microarray peptides. Mean RFU was transformed as ln(meanRFU − min(mean RFU) + 1). Linear regression curve, R 2, P‐value as determined through a t‐test, and number of binders, non‐binders, and ambiguous peptides are indicated.
-
FReceiver operating characteristic (ROC) curves of binder prediction based on cumulative score (blue) or net charge (brown). ROC curve shows fractions of true‐positive and false‐positive predictions on y‐ and x‐axes respectively, with increasing cutoff values. The area under the curve (AUC) is indicated for both cumulative score and net charge and constitutes a metric for the predictive power of the statistic (cumulative score or net charge). Optimal cutoffs are indicated.
Next, we determined the relative abundance of each individual amino acid in the group of SERF2 binding peptides compared with non‐binding peptides. For this comparison, the ratio between the abundance of each amino acid in the group of binding peptides and the abundance in the group of non‐binding peptides was taken, yielding a probability ratio (Dataset EV3). We then attributed an enrichment score to each amino acid, by calculating the natural logarithm of the probability ratio (Dataset EV3). This score was positive for amino acids that were more abundant, and negative for amino acids that were depleted in the group of SERF2‐binding peptides (Fig 1C and Dataset EV3). This analysis revealed a more than threefold overrepresentation of the negatively charged amino acids aspartic acid (Asp, D) and glutamic acid (Glu, E) in SERF2‐bound peptides (ln ratios of 1.23 for Asp and 1.50 for Glu; Fig 1C and Dataset EV3). Conversely, when compared to their presence in non‐bound peptides, the positively charged amino acids lysine (Lys, K) and arginine (Arg, R) were underrepresented in SERF2‐bound peptides (ln ratios of −1.09 for Arg and −1.56 for Lys; Fig 1C and Dataset EV3).
To make sure these results were not biased by our choice of (predominantly amyloidogenic) proteins represented on the microarray, we compared the distributions of several general peptide characteristics between the peptides on the microarray and all 12‐mer peptides derived from the human cytoplasmic proteome (Appendix Fig S1). We found that the peptide set on the microarray nicely covers the distributions of secondary structure propensities (α‐helical propensity, β‐sheet propensity, and β‐turn propensity), as well as hydrophobicity and net charge.
Next, we assessed to what extent the cumulative amino acid enrichment scores of the peptides, calculated as the sum of enrichment scores of all amino acids composing that peptide, correlated with their measured SERF2 binding intensities (Fig 1D and Dataset EV2). As shown in Fig 1D, the cumulative enrichment scores correlate linearly to the natural logarithm of the actual binding signals (P‐value < 2e‐16 and R 2 of 0.82). This observation indicates that a simple scoring function based solely on amino acid composition and completely disregarding position‐specific effects is sufficient to predict binding of SERF2 to peptides. This therefore suggests that SERF2 interaction does not require a strict binding motif. Furthermore, given that charged residues had the most extreme scores in our scoring matrix (negatively charged amino acids scored highest and positively charged amino acids scored lowest), SERF2 binding appears to be mainly driven by net charge. To test this, we performed a linear regression of the natural logarithm of the binding signals versus net charge (Fig 1E). This also showed a strong correlation (P‐value < 2e‐16), which confirmed that net charge is indeed a key driver for SERF2 binding. To rule out overfitting of the enrichment scores by basing them on the entire dataset, we recalculated the enrichment scores using just 70 percent of the data, which constitutes our training set (Appendix Fig S2A), and tested the correlations on the remaining 30 percent (Appendix Fig S2B and C), with practically identical results. In both calculation methods, the regression based solely on net charge has a lower R 2 than the regression based on the cumulative enrichment score (0.717 versus 0.82, respectively, in Fig 1E) because of a stronger degree of scatter around the regression line, indicating that the cumulative enrichment is a more accurate predictor of SERF2 binding than net charge alone. To confirm this, we plotted receiver operating characteristic (ROC) curves for both predictors (cumulative score and net charge; Fig 1F). In a ROC curve, the fraction of correct binary classifications or “true‐positive fraction” (SERF2 binder or non‐binder) at each threshold of the predictor (either net charge alone or cumulative enrichment score) is plotted against the fraction of false classifications (“false‐positive fraction”). The area under the curve (AUC) gives an indication of the performance of the predictor at the classification problem, in this case, classifying peptides into SERF2 binders or non‐binders. Although both net charge and cumulative enrichment score show strong predictive power, the cumulative score outperforms net charge (AUC of 0.99 versus 0.96). These results corroborate that net charge seems a key driver of SERF2 interaction, but that likely also non‐charged amino acids affect binding intensity.
To next profile the SERF2 binding sites to each protein on the microarray, we mapped the binding intensities of each peptide to its corresponding position in its full‐length parent protein (Fig 2). Due to the sliding window design of our microarrays, we were able to obtain a SERF2 binding profile by averaging the binding intensities of each of the three peptides that contained a particular residue (Dataset EV4). This yielded a binding profile with a resolution of four amino acids (Fig 2 and Appendix Fig S3A). To further explore the link between net charge and SERF2 binding, we similarly produced net charge profiles for all the proteins under study (Dataset EV4 and Appendix Fig S3B), this time averaging the net charges of the three peptides in which a residue is represented (Fig 2 and Appendix Fig S3B). This analysis again showed a strong association between SERF2 binding and local negative net charge. Strikingly, while both positively and negatively charged regions are present in the majority of the proteins, all of the proteins analyzed here contain at least one strong negatively charged SERF2 binding site, with the exception of one amyloid‐forming protein—human islet amyloid polypeptide (hIAPP); the four dipeptide repeat polymers (poly‐GR, poly‐PR, poly‐GA, and poly‐PA); and SERF2 itself. Interestingly, despite the strong correlation observed between SERF2 binding and local net charge, we also observed strong variations in binding intensities among peptides with identical net charges (Figs 1E and 2). For example, a clear interaction between SERF2 and a negatively charged region in prion protein around position 150 was observed, while the SERF2 binding intensities were much lower for the two similarly charged, neighboring regions in this protein (Fig 2 and Appendix Fig S3A). This again indicated that besides charge, additional sequence properties contributed to the strength of the interactions.
Figure 2. SERF2 binding maps to net negatively charged regions.

Overview of binding sites for SERF2 in proteins represented on the microarray slide. Average net charge and binding of SERF2 (see Dataset EV4 for values) in each protein are indicated.
We therefore asked whether there was an overlap between SERF2 binding sites and regions predicted to drive the aggregation of their parent proteins. These regions were predicted using the Tango and Waltz algorithms, which identify aggregation‐prone and amyloidogenic regions, respectively (Fernandez‐Escamilla et al, 2004; Maurer‐Stroh et al, 2010). However, no clear overlap could be observed (Appendix Fig S4).
To assess whether the relative binding patterns observed in the microarray—in which peptides are physically fixed to the array—hold in solution, we performed microscale thermophoresis (MST) analyses with three peptides derived from alpha‐synuclein, a protein previously shown to interact with SERF2, using peptides that span a range of fluorescence intensities on the microarray: the peptide with the highest fluorescence intensity (Asyn top, YEMPSEEGYQDY), one with intermediate fluorescence intensity (Asyn Med; GKNEEGAPQEGI), and the alpha‐synuclein‐derived peptide with the lowest fluorescence intensity (Asyn worst; MDVFMKGLSKAK). The data in Appendix Fig S5A show that in solution, Asyn med binds with lower affinity than Asyn top and Asyn worst with lower affinity still. These data provide some preliminary evidence that the relative patterns observed on the microarray hold in solution.
SERF2 binding is further enhanced by hydrophobic, aromatic residues
To identify other sequence features that influenced the interactions of the peptides with SERF2, we focused on the subset of binding peptides for which the actual binding intensities differed strongly (more than two standard deviations over the mean difference) from the predicted intensity based on the cumulative enrichment scores (77 peptides; Fig 3A and Dataset EV2). We compared the amino acid composition of these peptides with all other binding peptides (Dataset EV5). This analysis revealed a strong enrichment for the hydrophobic, aromatic residues tyrosine (Tyr, Y) and phenylalanine (Phe, F) and the hydrophobic amino acids valine (Val, V) and leucine (Leu, L), suggesting a role for these amino acids in interactions with SERF2 (Fig 3B). Taken together, these findings indicate that the interaction between charged residues and SERF2 is further enhanced by the presence of hydrophobic residues.
Figure 3. Peptide sequences enriched for hydrophobic, aromatic amino acids show enhanced SERF binding.

- Reiteration of Fig 1D, with peptides for which the transformed fluorescence intensity deviates strongly from the predicted value indicated.
- Enrichment scores (ln(probability ratio)) of all amino acids in SERF2‐binding peptides for which the transformed fluorescence intensity deviates strongly from the predicted value (n = 77), versus the remaining SERF2 binding peptides (n = 4,583). Statistical significance was determined through hypergeometric testing with Bonferroni correction for multiple comparisons. *P < 0.05 and ****P < 0.0001.
The positively charged N‐terminus of SERF2 mediates binding
SERF2 is a highly positively charged protein that has a net charge of +10, mainly due to a region in its N‐terminus that is evolutionarily highly conserved (Appendix Figs S6A and B). To assess the role of this region in the charge‐based interactions between SERF2 and amyloidogenic proteins, we neutralized the net charge of +5 in this region by inducing point mutations in the three positively charged amino acids, Lys16, Lys17, and Lys23 (Fig 4A). To exclude the possibility of the charge mutations resulting in structural changes relative to the wild‐type protein, the secondary structure of both proteins was assessed with Fourier transform infrared spectroscopy (FTIR, Appendix Fig S6C). These measurements revealed the structures of both the wild‐type and charge mutant SERF2 proteins to be largely disordered: Their random coil content was estimated to be over 80% as calculated by peak intensity ratios. This indicates that the charge mutations did not induce major changes in the secondary protein structure (Appendix Fig S6C).
Figure 4. Positively charged N‐terminus of SERF2 mediates binding.
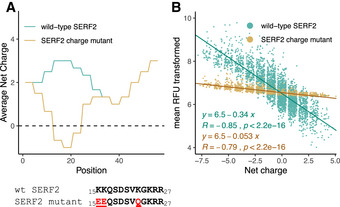
- Mutations and average net charge distribution in the wild‐type SERF2 and SERF2 charge mutant.
- Correlation between wild‐type SERF2 and SERF2 charge mutant binding intensities versus peptide net charge. Mean RFU was transformed as ln(meanRFU – min(mean RFU) + 1). Pearson’s correlation coefficients (R), P‐value as determined through a t‐test, and linear regression equations are indicated.
We then tested the ability of the SERF2 charge mutant protein to interact with the peptides on the microarray, and observed that the number of peptides to which it bound (Fig 1A and Appendix Fig S6D) was lower than the number of peptides bound by wild‐type SERF2 (Fig 1B) in each experiment. Furthermore, the number of peptides to which it bound reproducibly across three experiments (317 peptides) was less than half of the number of wild‐type SERF2‐bound peptides (653 peptides) (Dataset EV2). Although both wild‐type and charge mutant SERF2 binding signals showed a significant correlation with net charge, this correlation was much stronger for wild‐type SERF2 than for the SERF2 charge mutant (regression slopes of −0.34 and −0.053, respectively; Fig 4B and Appendix Fig S6E). The possibility that higher binding intensities were measured for fluorescently labeled wild‐type SERF2 than for charge mutant SERF2 due to the presence of multiple fluorescent labels on wild‐type SERF2 was excluded by mass spectrometry (Appendix Fig S6F–I). We further confirmed the reduced affinity of the SERF2 charge mutant in solution through MST analyses (Appendix Fig S5A and B). These analyses show binding affinity of the SERF2 charge mutant to the alpha‐synuclein peptides is severely reduced compared with wild‐type SERF2.
Altogether, these results are in line with previous biochemical and NMR indications that charge interactions are a major mediator of the interaction between MOAG‐4 or SERF1A and alpha‐synuclein, and that the positively charged N‐terminus of MOAG‐4 or SERF1A is involved in these interactions (Yoshimura et al, 2017; Merle et al, 2019). Furthermore, the finding that hydrophobic, aromatic residues were enriched in the strongest SERF2 binding peptides (Fig 3B) suggests that on top of charge–charge interactions, also cation–pi interactions between positively charged residues in the SERF2 N‐terminus and the aromatic residues of substrate peptides might mediate SERF2–substrate interactions.
SERF2 promotes amyloid formation through its positively charged N‐terminus
Now, our data indicate that charge is an important factor in interactions between amyloidogenic proteins and SERF2, and we next aimed to determine the functional consequences of these interactions for amyloid catalysis. Previous work identified the C‐terminus of alpha‐synuclein as the interaction site for MOAG‐4 and SERF1A (Falsone et al, 2012; Yoshimura et al, 2017; Merle et al, 2019). In line with this observation, our peptide microarray screen revealed that wild‐type SERF2 also interacts with the acidic C‐terminal region of alpha‐synuclein, as well as with the negatively charged N‐terminal region of amyloid beta (Fig 5A and B). Previous reports have shown that both these regions are important for the solubility of these proteins (Bertoncini et al, 2005; Wildburger et al, 2017; Sorrentino et al, 2018). To test whether the binding of SERF2 to the negatively charged regions of alpha‐synuclein and amyloid beta promotes amyloid formation of these proteins, we compared the in vitro aggregation kinetics of purified alpha‐synuclein and amyloid beta in the presence and absence of wild‐type or the charge mutant SERF2 using well‐established thioflavin T (ThT) fluorescence assays. These experiments confirmed previous experiments showing that the formation of both alpha‐synuclein‐ and amyloid beta ThT‐positive species was accelerated in the presence of a wild‐type SERF protein (Fig 5C and D, and Dataset EV6). Equimolar amounts of SERF2 with alpha‐synuclein strongly reduced the initial lag phase, and the half‐time of conversion was reduced by about 60% (Fig 5C and Appendix Fig S7A, and Dataset EV6). In addition, both the initial lag phase and midpoint of amyloid growth for amyloid beta aggregation were reduced by about 30% in the presence of SERF2 (Fig 5D and Appendix Fig S7B and Dataset EV6). In contrast, the SERF2 charge mutant did not accelerate the amyloid formation of alpha‐synuclein and amyloid beta. These results indicate that the positively charged region of SERF2 is required for its amyloid‐promoting effect, which is mediated by the negatively charged regions in amyloidogenic proteins.
Figure 5. SERF2 drives amyloid formation via charge interactions.

-
A, BNet charge distribution (black) of αSyn (A) and Aß (B), plotted together with the binding distribution of wild‐type SERF2 (blue) and the SERF2 charge mutant (red). Blue boxes represent the SERF2‐interacting regions.
-
CThT‐monitored amyloid kinetics of 50 μM alpha‐synuclein in the presence of either wild‐type SERF2 or mutant SERF2 in a 1:1 ratio. The average of three biological replicates is represented, and error bars indicate mean ± SD. Normalized aggregation data in Appendix Fig S7A.
-
DThT‐monitored amyloid kinetics of 1 μM amyloid beta in the presence of either wild‐type SERF2 or mutant SERF2 in a 1:4 ratio. The average of four technical replicates is represented, and error bars indicate mean ± SD. Normalized aggregation data in Appendix Fig S7B.
-
ENet charge distribution of hIAPP (black), plotted together with the binding distribution of wild‐type SERF2 (blue) and the SERF2 charge mutant (red).
-
FThT‐monitored amyloid kinetics of 2 μM human islet amyloid polypeptide in the presence of either wild‐type SERF2 or mutant SERF2 in a 1:4 ratio. The average of five technical replicates is represented, and error bars indicate mean ± SD. Normalized aggregation data in Appendix Fig S7C.
-
GModel and charge distribution graph of HA‐Q74 and muHA‐Q74 constructs.
-
HMutations and charge distribution in the SERF2 control mutant and SERF2 charge mutant proteins.
-
I–KFilter Trap with fivefold serial dilution and quantification of crude protein extract from SERF2 CRISPR deletion mutant cells transiently transfected with HA‐polyQ74 and either wild‐type SERF2, empty vector, or SERF2 charge mutant (I); wild‐type SERF2, empty vector, or SERF2 control mutant (J); or transfected with muHA‐Q74 and either wild‐type SERF2, empty vector, or SERF2 charge mutant. Western blots for HA‐Q74, muHA‐Q74, SERF2, and tubulin expression were included as controls (see Appendix Fig S7L–N for quantification). For all Filter Trap assays, the depicted blots are from one representative experiment of four biological replicates. The average of four biological replicates with each three or four technical replicates is represented in the graphs. Data are represented as mean ± SD, and significance was calculated using a one‐way ANOVA, followed by a post hoc Bonferroni multiple comparisons test. (I) P < 0.0001, (J) P = 0.0003, and (K) P = 0.9130. **P < 0.01 and ***P < 0.001.
Source data are available online for this figure.
To further challenge that SERF2 only has an amyloid‐promoting effect if its positively charged region can interact with the amyloidogenic protein, we turned to our peptide microarray screen and selected a peptide for which no interaction with either wild‐type SERF2 or the SERF2 charge mutant had been identified, namely hIAPP (Figs 2 and 5E). hIAPP is a predominantly positively charged peptide with strong amyloid‐forming properties, which is why we chose this peptide to perform a ThT assay in the presence and absence of wild‐type or charge mutant SERF2. This experiment showed that neither wild‐type SERF2 nor charge mutant SERF2 had an effect on hIAPP amyloid aggregation (Fig 5F and Appendix Fig S7C, and Dataset EV6). Taken together, these data support our finding that electrostatic interactions between SERF and amyloidogenic proteins are required to allow SERF to catalyze amyloid formation.
Charge interactions are required for SERF to drive protein aggregation in cells
Our data suggest a role for SERF2 as an amyloid‐promoting factor through interactions with negatively charged regions on amyloidogenic proteins. Because negatively charged regions are present in a large fraction of the proteome, we wanted to know whether this mechanism also applies in the context of the full proteome of a human cell. Therefore, we generated a SERF2 CRISPR deletion mutant HEK293T cell line (Appendix Fig S7D–H) and tested whether adding wild‐type and charge mutant SERF2 to these cells affected the aggregation of an aggregation‐prone model substrate (Fig 5G). The substrate we chose was an HA‐tagged mutant Huntington exon 1 (HTTex1) fragment protein with 74Q repeats. In previous experiments, HTTex1 HA‐Q74 has shown robust and strong aggregation in cells, which can be modified by several cellular factors, including SERF1A and SERF2 (Narain et al, 1999; Van Ham et al, 2010). The HA‐tag, also found to bind SERF2, adds a net negative charge to the N‐terminal site of the mutant HTTex1 fragment protein (Fig 5G and Appendix Fig S7I and J). The HTTex1 HA‐Q74 fragment protein was therefore a model protein that combined the elements that we had identified as being essential for interactions with SERF2 with an effective aggregation‐prone region. Moreover, this model protein allowed us to determine the contribution of electrostatic interactions between SERF and its client proteins to catalyze protein aggregation in the cell, independent of other cellular factors. Note that we used HTTex1 in this context as a synthetic amyloidogenic polyglutamine peptide, rather than as a model for Huntington’s disease.
We first determined whether the positive charge of SERF2 was required to interact with the HA‐tag. Therefore, a Filter Trap assay was performed using cell lysates from the SERF2 deletion mutant cell lines that expressed wild‐type SERF2, the SERF2 charge mutant, or a SERF2 control mutant, in combination with the HTTex1 HA‐Q74 fragment protein. A SERF2 control mutant, with substitutions in three uncharged amino acids to alanine (Ala) in the same domain, was added to exclude the possibility that mutations in the N‐terminal region of SERF2 other than mutations in charged amino acids might be able to diminish the effect of SERF2 on aggregation (Fig 5H). We found that Q74 aggregation was lower when co‐expressed with the SERF2 charge mutant (Fig 5I and Appendix Fig S7L) than with the wild‐type SERF2 or the SERF2 control mutant protein (Fig 5J and Appendix Fig S7M). The mutations did not change the localization of the SERF2 charge mutant in the cell when compared to the wild‐type protein (Appendix Fig S7K). These results confirmed a role for the positively charged N‐terminal amino acids of SERF2 in driving aggregation in human cells.
To further establish the role of charge interactions between SERF2 and the HA‐Q74 protein, we also generated a mutated version of the HA‐Q74 substrate. Mutations in the HA‐tag were induced by substituting two negatively charged Asp residues for the neutrally charged amino acid Ala, resulting in a net neutral charge for the HA‐tag (Fig 5G). The HA‐Q74 and muHA‐Q74 constructs were overexpressed in SERF2 CRISPR deletion mutant cells in combination with either wild‐type SERF2 or the SERF2 charge mutant, and a Filter Trap assay was performed. This experiment revealed that neither wild‐type SERF2 nor the SERF2 charge mutant could affect the amount of muHA‐Q74 aggregation (Fig 5K and Appendix Fig S7N).
The results obtained using this model suggest that SERF2 can trigger aggregation through specific and direct electrostatic interactions with charged regions of aggregation‐prone proteins, independently of other modifying factors present in the cell.
Charge mutations in MOAG‐4 reduce aggregation in C. elegans
Our in vitro results showed that charge mutations in the positively charged N‐terminal region of SERF2 could abolish the amyloid‐promoting effect of SERF2. We then wanted to determine whether this also applied in the context of a full‐body organism. We therefore introduced charge mutations into the C. elegans ortholog of SERF2, MOAG‐4, to see whether this would suppress aggregation in a C. elegans model of protein aggregation. We used CRISPR to induce point mutations in the endogenous locus of the moag‐4 gene to change the exact same amino acids as previously done for SERF2 (Fig 6A and Appendix Fig S8A). The MOAG‐4 charge mutant and MOAG‐4 control mutant strains were crossed with a polyglutamine (polyQ) worm model (Q40). Cells in the body‐wall muscle of the Q40 worm express a transgene carrying an aggregation‐prone polyQ stretch of 40 residues, fused C‐terminally to yellow fluorescent protein (YFP; Appendix Fig S8B) (Van Ham et al, 2010; Sin et al, 2017). The effect of the point mutations in MOAG‐4 was determined by quantifying the number of aggregates in the worms in the fourth larval stage (L4). As previously reported, genomic deletion of MOAG‐4 (MOAG‐4 del) strongly reduces the number of aggregates (Van Ham et al, 2010). Here, we also saw that the number of aggregates in worms carrying mutations in positively charged amino acids at the N‐terminus of MOAG‐4 was much lower—by about 60%—than the numbers seen in wild‐type Q40 worms or worms expressing the MOAG‐4 control mutant (Fig 6B and C, and Appendix Fig S8C–E). Based on the peptide arrays, we do not expect MOAG‐4 to bind to the polyglutamine part of Q40‐YFP. Whether it interacts with charged residues in flanking regions, as observed for SERF2, or acts indirectly via other molecules in the cell remains to be determined. To corroborate these results, we employed a second amyloid model strain, JKM2, expressing the aggregation‐prone amyloid beta peptide of 42 amino acids length (Aβ1‐42) that is associated with Alzheimer’s disease (Gallrein et al, 2021). Respective crosses with the MOAG‐4 deletion, control, and charge mutant strains were generated to address the in vivo impact of MOAG‐4 on Aβ1‐42 aggregation and toxicity. The Aβ1‐42 aggregation was assessed in live animals employing fluorescence lifetime microscopy (FLIM) (Fig 6D and Dataset EV7). We found that aggregation of Aβ1–42 in the retrovesicular ganglion is significantly reduced in the MOAG‐4 deletion and charge mutant background, but not in the control mutant compared with the parental Aβ1–42 strain (Fig 6E and Dataset EV7). This indicates that MOAG‐4 also affects the aggregation of different amyloid proteins by a charge‐dependent mechanism. Next, we wanted to explore whether the decreased Aβ1–42 aggregation in the MOAG‐4 charge mutant animals translates into a reduced Aβ1–42 toxicity. First, we analyzed the lifespan as read‐out for the general vitality of Aβ1–42 animals that are short‐lived compared with wild‐type animals. We observed a significantly increased lifespan for the MOAG‐4 charge mutant cross compared with the MOAG‐4 control mutant cross (Fig 6F and Dataset EV7). In the absence of Aβ1‐42‐co‐expression, MOAG‐4 control and charge mutant did not change nematode lifespan (Fig 6F and Dataset EV7), indicating that a charge reduction in MOAG‐4 reduced the toxic effect of Aβ1–42 on lifespan. Since MOAG‐4 was observed to be involved in regulating early aggregation steps (Yoshimura et al, 2017; Merle et al, 2019), we wondered whether larval stage nematodes that did not exhibit aggregate formation (Gallrein et al, 2021) would be influenced by charge mutation in MOAG‐4. Interestingly, while expression of Aβ1–42 induced a delay in development, this retardation was partially rescued in the MOAG‐4 charge mutant background, but not by the MOAG‐4 control mutant (Fig 6G and Dataset EV7). In the absence of Aβ1–42, both MOAG‐4 control and charge mutant again did not affect the development. These data would support the idea that MOAG‐4 influences early toxicity of Aβ1–42 as well, even before aggregates become apparent. Finally, we tested the effect of the MOAG‐4 charge mutant in an assay reporting on the neuronal activity of animals. For that, we employed a pathogen avoidance assay that relies on intact URY neurons. As demonstrated previously, URY neurons are compromised in Aβ1–42 animals, resulting in an inability to avoid pathogenic Serratia marcescens bacteria (Gallrein et al, 2021). Notably, we found that the MOAG‐4 charge mutant, but not MOAG‐4 control mutant, could partially rescue pathogen avoidance in Aβ1–42 animals (Fig 6H and Dataset EV7). As expected, the behavior toward non‐pathogenic E. coli bacteria was unaltered in any mutant background. Altogether, our data reveal that the charge of endogenous MOAG‐4 is responsible for its proteotoxic activity in C. elegans.
Figure 6. Neutralizing charge of the endogenous SERF ortholog MOAG‐4 is sufficient to suppress protein aggregation and toxicity in C. elegans .

- Mutations and average net charge distribution of wild‐type MOAG‐4, MOAG‐4 charge mutant, and MOAG‐4 control mutant.
- Representative images of Q40 and Q40; moag‐4 charge mutant animals. Scale bar, 75 mm.
- Representative quantification of the number of aggregates in Q40 worms with moag‐4 deletion or expression of either wild‐type moag‐4, moag‐4 charge mutant, or moag‐4 ctrl mutant. The results shown are representative experiments of three biological replicates of n = 20 worms in L4 stage. Data are represented as mean ± SD, and significance was calculated using a one‐way ANOVA, followed by a post hoc Bonferroni multiple comparisons test. ****P < 0.0001.
- Representative TCSPC‐FLIM images from the indicated strains. The dashed lines mark the retrovesicular ganglion, and arrowheads indicate aggregates. Scale bar is 50 µm.
- Number of aggregates per retrovesicular ganglion from three independent cohorts of the indicated Aβ1–42 strains with moag‐4 deletion mutant (del (tm4909)), n = 11; moag‐4 control mutant (ctrl mutant), n = 12; moag‐4 charge mutant (charge mutant), n = 17; and wild type, n = 15. Data are represented as mean ± SD. Significance was tested by one‐way ANOVA followed by the Bonferroni post hoc test. *P < 0.05 and ****P < 0.0001.
- Cumulative survival probability of the indicated strains (N2: n = 120; Aβ1–42: n = 120; moag‐4 control mutant (ctrl mutant): n = 105; moag‐4 control mutant; Aβ1–42 (ctrl mutant; Aβ1–42): n = 95; moag‐4 charge mutant (charge mutant): n = 100; moag‐4 charge mutant; and Aβ1‐42 (charge mutant; Aβ1‐42): n = 90). Significance was tested by the Mantel–Cox test. **P < 10−4 and ***P < 10−6.
- Fractions of nematodes in the indicated developmental stages after three days at 20°C starting from egg laying. Aβ1–42: ℕ = 6 (analyzed cohorts), n = 16–78 (animals per cohort); ctrl mutant: ℕ = 3, n = 42–191; ctrl mutant; Aβ1‐42: ℕ = 6, n = 34–70; charge mutant: ℕ = 3, n = 46–139; charge mutant; Aβ1‐42: ℕ = 6, n = 26–125. Depicted significance was tested between L4‐stage groups with ANOVA followed by the Bonferroni post hoc test. ***P < 0.001. Depicted is mean ± SD.
- Pathogen avoidance reaction of indicated nematode strains from Serratia marcescens Db11 or Escherichia coli OP50. Dots represent a single cohort (10–15 individual animals/cohort), bars display mean across cohorts ± SD. S. marcescens Db11–N2: ℕ = 11 (cohorts), N = 3 (experimental runs), n = 4 (technical replicates); Aβ1‐42: ℕ = 7, N = 2, n = 4; to l‐1 mutant: ℕ = 9, N = 3, n = 4; ctrl mutant: ℕ = 7, N = 2, n = 4; ctrl mutant; Aβ1–42: ℕ = 7, N = 2, n = 4; charge mutant: ℕ = 8, N = 2, n = 4; charge mutant; Aβ1–42: ℕ = 7, N = 2, n = 4. Significance was tested with ANOVA followed by the Bonferroni post hoc test. ***P < 0.001. E. coli OP50—N2: ℕ = 8, N = 3, n = 4; Aβ1–42: ℕ = 7, N = 2, n = 4; tol‐1 mutant: ℕ = 8, N = 3, n = 4; ctrl mutant: ℕ = 5, N = 2, n = 4; ctrl mutant; Aβ1–42: ℕ = 6, N = 2, n = 4; charge mutant: ℕ = 5, N = 2, n = 4; charge mutant; Aβ1–42: ℕ = 6, N = 2, n = 4.
Charge rather than amino acid composition of MOAG‐4/SERF drives binding to amyloidogenic proteins and aggregation
Our data indicate that the positive charge in the N‐terminus of SERF2 is required for interactions with amyloidogenic proteins and for subsequent acceleration of amyloid formation. To confirm that it is indeed the positively charged nature of Lys16, Lys17, and Lys23 in SERF2 that is responsible for this ability and not any other lysine‐specific characteristic, we created a lysine‐to‐arginine SERF2 mutant (KR mutant; Fig 7A). The K‐to‐R mutations do not alter the charge of the SERF2 protein. To investigate whether the KR mutations change the affinity of SERF2 to previously identified strong binders of SERF2 in alpha‐synuclein and amyloid beta (Dataset EV2, peptide numbers 61 and 0), we measured their binding affinities using microscale thermophoresis (MST). MST can determine the binding affinity of a fluorescently labeled molecule to a potential ligand by monitoring the movement of fluorescent molecules through a microscopic temperature gradient. This revealed that at low ionic strength, wild‐type SERF2 and the SERF2 KR mutant have similar binding affinities for the alpha‐synuclein peptide (KD = 3 μM and 2.6 μM, respectively; Fig 7B and D) and for the amyloid beta peptide (KD = 9.6 μM and 6.6 μM, respectively; Fig 7C and D). Moreover, relative in‐solution binding to the “Asyn med” and “Asyn worst” peptides was confirmed to be nearly identical for the SERF2 KR mutant and wild type (Appendix Fig S5). In contrast, the binding affinities for the SERF2 charge mutant with the alpha‐synuclein and amyloid beta peptides are substantially lower (KD = 56 μM and 182 μM, respectively; Fig 7B–D). These data support our hypothesis that charge complementation drives the interactions between SERF2 and substrate proteins, and indicate that no property of lysine, other than its positive charge, is required for these interactions.
Figure 7. Charge rather than amino acid composition of MOAG‐4/SERF drives binding to amyloidogenic proteins and aggregation.

-
AMutations and average net charge distribution of wild‐type SERF2 (reused from Fig 4A) and SERF2 KR mutant. Wild‐type SERF2 and KR mutant sequences are shown, and mutations are indicated in red.
-
B, CMicroscale thermophoresis (MST) analysis of wtSERF2, SERF2 charge mutant, and KR mutant binding to the strongest identified wild‐type SERF2 binding peptide from alpha‐synuclein (B) and amyloid beta (C). Binding is represented as the ΔFnorm, the normalized difference in relative fluorescence between a specific sample and the baseline (the binding intensity without peptide). Data are represented as mean ± SD, n = 4 biological replicates.
-
DKD values for each interaction quantified from the experiments depicted in (B) and (C). Data are represented as mean ± SD, n = 4 biological replicates. Significance was determined using a two‐way ANOVA followed by Tukey’s multiple comparisons test *P‐value < 0.05 and ****P‐value < 0.0001.
-
EMutations and average net charge distribution of wild‐type MOAG‐4 (reused from Fig 6A) and MOAG‐4 KR mutant, MOAG‐4 sequences are shown, and mutations are indicated in red.
-
FRepresentative quantification of the number of aggregates in Q40 worms with moag‐4 deletion or expression of either wild‐type moag‐4, moag‐4 charge mutant, moag‐4 ctrl mutant, or moag‐4 KR mutant. The results shown are representative experiments of three biological replicates of n = 20 worms in L4 stage. Data are represented as mean ± SD, and significance was calculated using a one‐way ANOVA followed by a Bonferroni post hoc multiple comparisons test. ****P < 0.0001.
Additionally, we tested whether the aggregation‐promoting ability of the KR mutant also remained in our C. elegans model for polyQ aggregation. Therefore, we crossed a CRISPR‐induced moag‐4 KR mutant strain with our Q40 worm model and quantified the number of aggregates in the body‐wall muscle of the worms (Fig 7E and F and Appendix Fig S9A–D). Here, we found that the number of aggregates in the worms expressing the KR mutant was not different from the amount of aggregates found in the body‐wall muscle of worms expressing wild‐type MOAG‐4 (Fig 7F and Appendix Fig S9B–D). In summary, these data show that SERF2 and MOAG‐4 retain their amyloid‐promoting properties when lysines are substituted by arginines and therefore that charge is the driving force for the interactions between SERF2 and amyloidogenic proteins.
Discussion
While SERF has been identified as an enhancer of protein toxicity and amyloid aggregation for a range of unrelated amyloidogenic proteins, a shared underlying mechanism had not yet been investigated (Van Ham et al, 2010; Falsone et al, 2012; Yoshimura et al, 2017). Here, we found that SERF2 binds preferentially to negatively charged amino acids and that this binding and its catalyzing effect on amyloid formation required SERF2’s evolutionarily conserved positively charged N‐terminal domain. We were particularly excited to find that neutralizing the charge in the endogenous locus of MOAG‐4 in C. elegans strongly reduced the aggregation of a reporter substrate, which suggests that neutralizing the charge of a single protein in the cell’s proteome is sufficient to alter proteome stability. In the C. elegans integrated dataset from the PaxDB (Wang et al, 2015), MOAG‐4 is listed at 387 ppm, which puts it in the top 5% most abundant proteins identified. For SERF2, these levels range from 0.54 till 413, depending on the cell lines in which the concentrations have been measured. In comparison, C. elegans small heat‐shock protein 12.1—member of a class of chaperones for which substrate KDs have been reported in the low micromolar range (Bruinsma et al, 2011; Shammas et al, 2011; Freilich et al, 2018)—has an abundance of 380 ppm. These comparable levels support the relevance of the low‐affinity interactions between MOAG/SERF and the substrate proteins that we observed in our cell‐free experiments.
Previous studies have described how the processes involved in guiding unfolded proteins toward their properly folded state—and keeping them in this native state—rely on charged residues (Xiao & Honig, 1999; Gribenko & Makhatadze, 2007; De Baets et al, 2014; Sant’Anna et al, 2014; Houben et al, 2020). The charge of proteins is affected by numerous factors, including mutations, changes in pH, post‐translational modifications, and external stress (Adav et al, 2016; de Graff et al, 2016; Munder et al, 2016). In addition, other modifying factors, such as charged polymers, are known to promote amyloid fibril formation. For example, polyanions such as glucosaminoglycans (i.e., heparin), nucleic acids, and polyphosphate (polyP), as well as positively charged polylysines and polyamines, were recognized to interact with oppositely charged regions, compensating their charge and promoting amyloid formation (Wickramasinghe et al, 2019; Calamai et al, 2006; Nandi et al, 2002; Cohlberg et al, 2002; Goers et al, 2003; Bertoncini et al, 2005). These factors can thereby lead to excessive unfolding and exposure of unprotected aggregation‐prone regions. When the abundance of unfolded proteins exceeds the capacity of the cellular protection mechanisms, these unfolded proteins become susceptible to off‐pathway structural conversions that drive them into thermodynamically highly stable amyloid fibrils (Goldschmidt et al, 2010; Chiti & Dobson, 2017; Yang et al, 2018; Hinderhofer et al, 2019). Our findings suggest that cellular modifiers such as SERF may similarly accelerate protein transitions to amyloid by acting on the protein’s charge.
Most of what is known about SERF’s mechanism of action comes from studies on alpha‐synuclein. Alpha‐synuclein is a natively unstructured protein that remains soluble through a strong interaction between its acidic C‐terminal and its N‐terminal region, an interaction that shields its aggregation‐prone middle region (Bertoncini et al, 2005; Hong et al, 2011; Sorrentino et al, 2018). Factors that can disrupt these electrostatic intermolecular interactions, such as high salt concentrations (Yoshimura et al, 2017), polyamine compounds (Bertoncini et al, 2005), metal cations (Uversky et al, 2001), or C‐terminal truncations (Li et al, 2005; Falsone et al, 2012), have been shown to enhance alpha‐synuclein aggregation. In previous nuclear magnetic resonance spectroscopy studies, positively charged residues in the N‐terminus of SERF1A or MOAG‐4 were found to interact with the amino acids in the C‐terminal region of alpha‐synuclein (Falsone et al, 2012; Yoshimura et al, 2017). This interaction exposes an amyloid nucleation site on alpha‐synuclein that is otherwise concealed by intermolecular interactions (Merle et al, 2019). A direct but transient interaction between SERF and alpha‐synuclein has been confirmed by overexpression of SERF1A and alpha‐synuclein in SHSY‐5Y neuroblastoma cells (Merle et al, 2019). Interestingly, the interactions between alpha‐synuclein and SERF1A or its yeast ortholog ScSERF have been shown to result in the formation of a fully disordered protein complex, which accelerates the primary nucleation of alpha‐synuclein amyloid formation (Borgia et al, 2018; Meinen et al, 2019; Merle et al, 2019). Our findings are in line with these observations and suggest that also SERF2 might accelerate primary nucleation of alpha‐synuclein amyloid formation through charge complementation.
Here, we observed a similar effect of SERF2 on amyloid beta. In amyloid beta, the strongest negative charge is located in the N‐terminal region of the protein. Interaction of SERF2 with amyloid beta appears to take place at this charged region: When we added SERF2 to amyloid beta in kinetic assays, we saw that SERF2 required this charge interaction to accelerate aggregation. Recent studies have shown that it is the N‐terminus of the amyloid beta peptide that determines its tendency to aggregate. Indeed, N‐terminal mutations that affect the charge of this region are known to modify amyloid beta fibril formation. Such mutations include amino acid changes (Viet et al, 2013; Xu et al, 2014), post‐translational modifications (Kummer & Heneka, 2014), and truncations of the protein (Dammers et al, 2017; Scheidt et al, 2017; Wildburger et al, 2017; Moro et al, 2018). In addition, a number of residues in the N‐terminus of amyloid beta can bind metal cations—including Cu2+ and Zn2+—which also accelerate amyloid beta aggregation through mechanisms that are currently unresolved (Danielsson et al, 2007; Talmard et al, 2007; Faller, 2009; Yugay et al, 2016). Given the fact that charge is a common denominator in all of these modifying factors, mechanisms similar to those observed for MOAG‐4/SERF may well explain their amyloid‐promoting effect.
As mentioned above, our findings are in line with the previous binding site, namely amino acids 6 to 28 of MOAG‐4 and SERF1A for their aggregation‐promoting effects on alpha‐synuclein (Yoshimura et al, 2017; Merle et al, 2019). However, besides the previously proposed mechanism that focuses on the specific disruption of protective intermolecular interactions in alpha‐synuclein, also a more general mechanism that involves the stability of any aggregation‐prone protein may apply. Next to hydrophobicity and beta sheet propensity, net charge is a critical determinant for the behavior of proteins in solution, because charge repulsion between molecules is essential to keep proteins uniformly distributed. This phenomenon is known as colloidal stability and strongly determined by the charge distribution of the molecules (Garidel et al, 2015; Thompson et al, 2016). Neutralization of charged regions—as occurs in the presence of mutations, modifications, or modifiers such as SERF—could result in reduced charge repulsion between amyloid proteins and lower the colloidal stability of the proteins in solution, thus accelerating fibril formation. Colloidal stability has also been shown to be important for liquid–liquid phase separation, where proteins are present in high concentrations in membrane‐less cellular compartments (Shin & Brangwynne, 2017). Mutations, post‐translational modifications, or environmental factors that result in imbalances in colloidal stability—including charge alteration—could initiate a liquid‐to‐solid transition toward aggregate‐like structures, a transition that resembles the process of amyloid formation (Molliex et al, 2015; Pak et al, 2016; Ray et al, 2020). A third possibility is the existence of other activities of SERF2 that are initiated by electrostatic interactions between SERF2 and amyloid‐forming proteins. Additional research is required to distinguish which mechanisms apply for SERF2 in the presence of amyloidogenic proteins.
Why SERF acts as an amyloid‐promoting factor is not known. Misfolded monomeric and oligomeric species are generally considered to be the toxic species in age‐related disease. A low‐energy sequestration mechanism that quickly removes and compactly stores unwanted aggregation‐prone proteins could therefore be beneficial. It is possible that under healthy conditions, SERF’s function is part of such a sequestration mechanism, whereby it drives transitions of aggregation‐prone proteins toward an amyloid state. Alternatively, the aggregation‐promoting effect of MOAG‐4/SERF2 in the presence of aggregation‐prone disease proteins could be an unwanted side effect of a different function. For example, a role for SERF1A as an RNA chaperone in the formation of liquid‐like RNA organelles has been suggested (Meyer et al, 2020). Since both RNA and alpha‐synuclein are known to interact with the positively charged N‐terminal region of SERF, they might compete for this SERF binding site, possibly favoring alpha‐synuclein–SERF interactions and additional amyloid formation under stress conditions (Meyer et al, 2020). Meyer et al (2020) findings, together with the previously shown toxic effects of SERF2 in the presence of amyloid proteins (Van Ham et al, 2010), could suggest that the amyloid‐promoting properties of SERF2 are a function that is induced under stress conditions.
Based on our results and those of recently published studies on SERF1A and ScSERF, we propose a mechanistic model in which charge complementation by SERF accelerates the primary nucleation of amyloid. Our finding that simply changing the charge of the endogenous SERF in C. elegans was sufficient to have a profound effect on protein aggregation and toxicity indicates a critical role for charge complementation in the regulation of proteome stability. Taken together, our results suggest that preventing charge interactions between aggregation‐prone proteins and charged cellular modifiers deserves exploration as a strategy to prevent or delay the onset of protein toxicity in aging and age‐related diseases.
Materials and Methods
Microarray peptide screen
For SERF2‐peptide binding determination, custom‐made microarrays were purchased from PEPperPRINT (PEPperCHIP® Peptide Microarray, PEPperPRINT). For the production of the microarrays, 12‐mer peptides were directly synthesized on poly(ethylene glycol)‐based graft copolymer‐coated glass slides with a three amino acid linker (ß‐alanine, aspartic acid, and ß‐alanine), using an established peptide laser printing technology (Stadler et al, 2008). Peptides were synthesized from C‐ to N‐terminus, yielding peptides with free N‐termini, and C‐termini coupled to the slide through the aforementioned linker. In brief, each activated amino acid, covered at its N‐terminus by a 9‐fluorenylmethoxycarbonyl (Fmoc) protection group, was separately attached with its C‐terminus to the three amino acid linker or its neighboring amino acid through a cycle composed of a melting (coupling) step, removal of excessive monomers, and removal of the Fmoc protection group. This cycle was repeated until all peptides were synthesized. All 12‐mer peptides were present in duplicate and randomly distributed on each half of a slide. All experiments were performed using the HS 400™ Pro Hybridization Station and HS Pro control manager software (Tecan). The slides were washed with Milli‐Q three times for 1 min with 30 s of soak time, followed by washing with binding buffer (1× PBS, 0.05% Tween, pH 7.4) three times for 1 min with 30 s of soak time. Slides were blocked with blocking buffer (1% BSA, 1× PBS, 0.05% Tween, pH 7.4) for 30 min with medium agitation frequency. Slides were incubated with 1 µM ATTO633‐labeled wild‐type or charge mutant SERF2 proteins in binding buffer for 1 h with medium agitation frequency. After incubation, the slides were washed with washing buffer (1× PBS, 0.1% Tween, pH 7.4) three times for 2 min with 30 s of soak time, followed by washing with binding buffer three times for 2 min with 30 s of soak time. The slides were then washed with Milli‐Q three times for 1 min with 30 s of soak time, and dried with nitrogen for 2 min. The viscosity during all steps was set to medium, and all steps were performed at 25°C. The slides were imaged and analyzed using the PowerScanner Microarray and Array‐Pro® Analyzer software (Tecan) with wavelengths channel 1: 580/30 nm and channel 2: 676/37 nm, 200% gain, and 1% laser power. Slides were regenerated in between experiments. For regeneration, slides were incubated in regeneration buffer (100 mM glycine, 500 mM NaCl, 6 M Gua‐HCl, pH 2.0) while sonicated in a water bath at room temperature for 90 min. The slides were left overnight in regeneration buffer in the water bath at room temperature. Subsequently, slides were sonicated again for 30 min at 50°C. After sonication, the slides were washed five times with Milli‐Q, five times with absolute ethanol, and three times with acetone. Slides were dried using air flow and imaged using the Powerscanner Microarray as described above to confirm the slides were fully regenerated.
Microarray data analysis
All peptides on the microarray were classified as SERF2 “binders”, “non‐binders”, or “ambiguous” as follows. For each experiment, a cutoff value distinguishing binder from non‐binder peptides was calculated as the mean RFU of the Gly control peptides plus two times the standard deviation of the RFU signals of the Gly control peptides, as shown in Fig 1B. Assuming an approximately normal distribution for the binding signal to Gly control peptides, this cutoff would encompass 97.5% of the control peptide population, indicating that peptides with higher RFU signals likely do not belong to the background population and are in fact true binders. Per experiment, a peptide was classified as a binder for that experiment if both of its duplicates on the microarray showed higher binding intensities than the cutoff value (Dataset EV1). Peptides for which this was not the case were considered non‐binders for that experiment. Finally, only peptides that fulfilled the binder criterion in each of the three repeat experiments were withheld as actual binders. Peptides that consistently fell below the cutoff value across three experiments were classified as non‐binders. The remaining peptides, which show an inconsistent classification across three experiments, were classified as “ambiguous” (Dataset EV2).
Next, amino acid enrichment scores—also referred to as ln(probability ratios)—in binding versus non‐binding peptides were determined using the formula:
, with aa indicating each of the 20 amino acids (Dataset EV3). Ambiguous peptides were not considered in these analyses. Statistical significance of these enrichments was determined through hypergeometric testing with the Bonferroni correction for multiple comparisons. Using the enrichment scores for each amino acid, we then produced a cumulative score for each peptide using the formula:
with scoreaa,i indicating the score for the amino acid aa in position i of the peptide (Dataset EV2). The performance of this cumulative score as a predictor for SERF2 binding was assessed through linear regression and ROC curve analysis as indicated in the main text.
To assess how amino acid composition differs between binders that deviate strongly from their predicted value based on the cumulative scores and binders that do not, we identified a subset of binders as “deviating” if their mean RFU values were more than two standard deviations above the mean difference with the regression curve across all data points (as shown in Fig 3A). We then repeated the workflow above to identify enrichment scores, this time calculating deviant scores as follows: with aa indicating each of the 20 amino acids (Dataset EV5).
To assess whether the peptide set on the microarray satisfactorily represents peptides from the human cytoplasmic proteome, the reviewed human proteome was retrieved from UniProt (proteome ID UP000005640). Membrane proteins were filtered out from the protein set based on the UniProt “Gene Ontology—subcellular localization” annotation. 12‐Mer peptides with an overlap of 8 residues were derived from the remaining set of proteins as described in Main text and in Fig 1A. Duplicate peptides were filtered out, and for the remaining peptide set secondary structure propensities, hydrophobicity and net charge were calculated using the Bio.SeqUtils.ProtParam python module.
For an overview of SERF2 binding sites along the primary sequence of the proteins represented on the microarray, the average binding intensity for the Gly control peptides was first subtracted from the binding signals in each repeat experiment, yielding background‐corrected binding signals. Next, for each residue, the average net charge and average binding intensity were calculated by taking the average charge or intensity of all three 12‐mer windows in which this residue was represented. This resulted in average‐score patterns with a resolution of four amino acids as depicted in Fig 2 and Appendix Fig S1B (Dataset EV4).
The analyses above were performed using a combination of Python 3.6 (PyCharm IDE version 2018.1.2) and R statistical software version 3.5.2 (IDE RStudio version 1.1.463).
In vitro aggregation assay
Alpha‐synuclein thioflavin T (ThT) fluorescence measurements were performed in triplicate as described previously (Falsone et al, 2012). In brief, 50 µM alpha‐synuclein was mixed with an equimolar amount of SERF2 or SERF2 charge mutant in 50 mM Tris–HCl, 150 mM NaCl, and 3 mM NaN3 (alpha‐synuclein working buffer, pH 7.4), and shaken at 1,400 rpm at 37°C. At the different time points, 5 µl aliquots were removed and diluted in 1 ml of a 5 µM ThT solution buffer (Sigma‐Aldrich), and ThT fluorescence was measured on a Jasco FP‐6500 fluorescence spectrometer (Jasco GmbH, Pfungstadt, Germany) at 25°C and 482 nm, upon excitation at 442 nm, in a 1 ml quartz cuvette at 25°C. Ex/em slit widths = 10/10 nm.
Aggregation kinetic assays for amyloid beta and hIAPP were performed as described previously (Aprile et al, 2017; Bongiovanni et al, 2018). In brief, all measurements were performed in black, low‐binding 96‐well half‐area plates, with clear bottom (Corning). Plates were sealed, and ThT fluorescence was measured at each time point with an excitation wavelength of 440 nm and an emission wavelength of 480 nm at 37°C, using a CLARIOstar plate reader (BMG Labtech). Measurements were performed in quadruplicate and quintuplicate, without agitation. 1 µM amyloid beta was mixed with 4 µM SERF2 or SERF2 charge mutant in 20 mM sodium phosphate buffer pH 8.0, 200 μM EDTA, and 0.02% NaN3, and supplemented with 20 μM ThT. 2 µM hIAPP was mixed with 8 µM SERF2 or SERF2 charge mutant protein in standard PBS.
Microscale thermophoresis (MST)
Peptides were synthesized in‐house using an Intavis Multipep RSi synthesizer following Fmoc/tBu solid‐phase synthesis strategy. Peptides were subsequently labeled with 5(6)‐carboxyfluorescein as described in the supplementary information.
Directly prior to the MST analysis, a peptide aliquot was dried, resolubilized in 1,1,3,3‐hexafluoroisopropanol, and dried again. The resulting film was dissolved in DMSO and diluted 1:20 in 10 mM Tris pH 7.6 prior, after which concentration was determined using a NanoDrop (Thermo Fisher). Peptides were then diluted to a concentration of 600 nM in 10 mM Tris pH 7.6 with 0.5% Tween‐20. SERF2 or mutants thereof were diluted to a concentration of 107 µM in 10 mM Tris, and a 1:1 dilution series was produced. This dilution series was then mixed at a 9:1 ratio with 600‐nm peptide, resulting in a final assay buffer of 10 mM Tris with 0.05% Tween‐20 and a final labeled peptide concentration of 60 nM. Thermophoresis was then performed on a Monolith NT. Automated (NanoTemper, Germany). KD determination was performed using the MO. Affinity Analysis (NanoTemper, Germany) software version 2.3, using a KD model and keeping the target concentration constant at 60 nM.
Filter Trap assay
The Filter Trap assay was performed as described previously (Wanker et al, 1999). In brief, 2.5 × 10⁶ SERF2 CRISPR deletion mutant cells were cotransfected with 1,000 ng (mut)HA‐74Q DNA and either 3,000 ng wild‐type hSERF2‐HA or mutant SERF2‐HA DNA using 1 mg/ml polyethylenimine (PEI) reagent (Polysciences, 239662). Cells were collected 16 h after transfection in FTA sample buffer (10 mM Tris‐Cl pH 8.0, 150 mM NaCl and 2% SDS) supplemented with Complete Protease Inhibitor Cocktail (25×) (Roche; 11697498001). Fast‐prep treatment was performed 5 × 20 s at 4 m/s (MP Biomedicals; 116004500). Total protein was quantified using a Pierce™ BCA Protein Assay Kit (Thermo Fisher Scientific; 23225). The dilution range was 40 µg, 8 µg, and 1.6 µg in 100 µl FTA sample buffer supplemented with 1 M DTT (1:20) (Sigma; D0632), and incubation was at 95°C for 5 min. A Bio‐Dot apparatus (Bio‐Rad) was used to trap the aggregates in a 0.2 micron cellulose acetate membrane (Sterlitech; CA023001). Membrane blocking in 5% milk in PBS‐T 0.1%, antibody staining, and membrane developing were performed as described above for Western blotting. The antibodies used to detect HA‐tagged polyQ74 were primary anti‐HA antibody‐ChIP Grade (1:5,000; Abcam; ab9110), or primary anti‐polyglutamine antibody (1:1,000; Sigma‐Aldrich, P1874) in 5% milk in PBS‐T 0.1%. Filter Trap results were quantified using ImageJ. In addition, a Western blot was performed with 50 µg protein of the cell lysates used for each Filter Trap, to quantify protein expression in the different samples as described above for Western blot. PolyQ74 was detected using primary anti‐HA antibody‐ChIP Grade (1:5,000; Abcam; ab9110) or primary anti‐polyglutamine antibody (1:1,000; Sigma‐Aldrich, P1874) in 5% milk in PBS‐T 0.1%. Anti‐tubulin (Sigma‐Aldrich; T6074) or anti‐actin (MP Biomedicals; 08691001) was used as loading control at a 1:5,000 dilution.
Quantification of aggregates
The numbers of aggregates present in whole worms (L4 stage) were counted using a fluorescence dissection stereomicroscope (Leica, MZ16 FA). For each replicate, aggregates were counted in 20 animals. Statistical analysis was performed using GraphPad Prism 5. One‐way ANOVA and Bonferroni tests were used for comparisons. P‐values below 0.05 were considered statistically significant. *P < 0.05, **P < 0.01, ***P < 0.001, and ****P < 0.0001. All data are represented as mean ± standard deviation.
Pathogen avoidance assay
Pathogen avoidance in C. elegans was assayed as previously described (Pujol et al, 2001). In brief, 50 to 75 young adult hermaphrodites of the desired strain were transferred to NGM‐agar plates seeded with pathogenic S. marcescens strain Db11 or non‐pathogenic E. coli OP50. The nematodes were kept for 24 h to sensitize before being transferred to a fresh plate with the same bacterial strain (groups of 10 to 15 nematodes to generate 4 to 5 replicates). The location of the nematodes was analyzed after an additional 24 h. The avoidance index was calculated as the number of nematodes off the lawn over the total number of nematodes. Three independent experiments were performed for the assay.
Fluorescence lifetime imaging microscopy
Day 4 old nematodes (strains JKM2, JKM3, PHX1099‐JKM2, and PHX1173‐JKM2) were anesthetized with 250 mM NaN3 for up to 30 min, and mounted on an 2.5% agarose pad, and confocal microscopy/fluorescence lifetime measurements were performed as described (10).
Measurements were carried out using a “Leica SP5” confocal microscope, objectives used were “HCX PL APO 63 × 1.2” and “HCX PL APO CS 100 × 1.4”; zoom was applied up to 1.5‐fold. Images were recorded by time‐correlated single photon counting (TSCPC) using “PicoHarp 300” (PicoQuant). A pulsed supercontinuum laser was used for excitation, emitting pulses at 80 MHz. An acousto‐optic beam splitter was used to set excitation light to 565 nm and to measure emission between 575 and 625 nm. Photon count rates were kept below 1% of the laser repetition rate to prevent photon pileup. Images were acquired until approx. 3,500 photons per pixel were recorded. Images were processed with “FlimFit” software (11) and fitted assuming monoexponential decays.
Lifespan assay
Nematodes were age‐synchronized by egg laying. Larvae were grown for three days, and L4 larvae were transferred to assay plates in cohorts of 30–35 animals. Approximately 100 nematodes were used per assay and strain. Nematodes were cultured at 20°C and scored every day. Survival was tested by gently prodding nematodes with a platinum wire. The nematodes were transferred to fresh plates every day until day 10. From then on, they were transferred every three days. To compare the survival distributions of two groups, the log‐rank test (Mantel–Cox) was employed. JKM2 and N2 were analyzed first to establish a baseline reference. Subsequently, lifespans of PHX1099, PHX1173, PHX1099‐JKM2, and PHX1173‐JKM2 were compared. To confirm the observed difference between PHX1099‐JKM2 and PHX1173‐JKM2, a repeat experiment was performed.
Development assay
In order to obtain approximately 50 eggs per strain on fresh NGM plates, around 5‐10 adult nematodes of strains PHX1099, PHX1173, JKM2, PHX1099‐JKM2, and PHX1173‐JKM2 were placed onto separate NGM plates to lay eggs for 4 h at 20°C.
Eggs were incubated at 20°C for three days. Hatched larvae and their corresponding larval stages were counted. Six cohorts were analyzed for JKM2 to establish a baseline reference. Over the course of two experimental runs, three cohorts were analyzed for PHX1099 and PHX1173 and six cohorts were analyzed for PHX1099‐JKM2 and PHX1173‐JKM2. More details about procedures and reagents used in this study, including descriptions of standard procedures to generate and analyze cell lines, C. elegans strains, and purified proteins, and amyloid‐forming proteins versus proteome net charge analysis are provided in the Appendix Materials and Methods.
Author contributions
AP, JS, FR, and EAAN conceived and designed the research. AP and BH designed, performed, and analyzed the experiments with help from LJ, WH, AMC, MdVl, RG, MK, ES, MdVr, and SLE. AP, CG, JK, and RG designed and performed the microarray experiments with help from BH, JS, FR, and EAAN. BH analyzed the data with help from JS, FR, AP, and EAAN. FAA and FSF performed in vitro ThT kinetic assays. RS and CG performed C. elegans experiments. MK designed the illustrations. MV provided invaluable mentorship and guidance to FAA. AP, BH, and EAAN wrote the manuscript with input from all authors.
Conflict of interest
The authors declare that they have no conflict of interest.
Supporting information
Appendix
Dataset EV1
Dataset EV2
Dataset EV3
Dataset EV4
Dataset EV5
Dataset EV6
Dataset EV7
Source Data for Appendix
Source Data for Figure 5
Acknowledgments
We thank the Caenorhabditis Genetics Centre (funded by the NIH National Centre for Research Resources and the NIH Office of Research Infrastructure Programs [P40 OD010440]) and the Mitani laboratory for the C. elegans strains (funded by the Japan National BioResource Project). Part of the work was performed in the UMCG Microscopy and Imaging Center (UMIC). We thank Marcel de Vries for help with mass spectrometry (Interfacultair Massaspectrometriecentrum RUG, UMCG) and Sally Hill for critical comments and for editing the manuscript. This project was funded by a Meervoud Grant from NWO (836.09.001) (to E.A.A.N.), a European Research Council (ERC) starting grant (281622 PDControl) (to E.A.A.N.), the Alumni chapter Gooische Groningers facilitated by the Ubbo Emmius Fonds (to E.A.A.N), an Aspasia fellowship from NWO (015.014.005) (to E.A.A.N.), a Boehringer Ingelheim Fonds travel grant (to A.P.), a Cornelis de Cock grant (to A.P.), the Deutsche Forschungsgemeinschaft (KI‐1988/5‐1) (to JK), a Marie Curie Fellowship (to A.M.C.), and a BCN‐BRAIN grant (to M.K.). The Switch Laboratory was supported by the European Research Council under the European Union's Horizon 2020 Framework Programme ERC Grant agreement 647458 (MANGO) to J.S.; the Flanders Institute for Biotechnology (VIB, grant no. C0401); the KU Leuven (Post‐doctoral Mandate PDM/20/150 to B.H. and the Industrial Research Fund); the Agency for Innovation by Science and Technology (IWT, grant no. 60839, 141546 to B.H.) and the Funds for Scientific Research Flanders (FWO, infrastructure grant AKUL/15/34‐G0H1716N for the Monolith NT automated instrument, project grant G0C0320N). F.A.A. is supported by UK Research and Innovation (Future Leaders Fellowship MR/S033947/1) and the Alzheimer’s Society, UK (511).
The EMBO Journal (2021) 40: e107568.
Contributor Information
Frederic Rousseau, Email: frederic.rousseau@kuleuven.be.
Joost Schymkowitz, Email: joost.schymkowitz@kuleuven.be.
Ellen A A Nollen, Email: e.a.a.nollen@umcg.nl.
Data availability
The datasets and computer code produced in this study are available in the following databases:
Dataset EV1: Position and raw intensity measurement of all microarray peptides. Unishare (https://unishare.nl/index.php/s/ggoGMt6Jdo85RFk)
Dataset EV2: Peptide array binding calculations. Unishare (https://unishare.nl/index.php/s/ggoGMt6Jdo85RFk)
Dataset EV3: Enrichment scores per amino acid. Unishare (https://unishare.nl/index.php/s/ggoGMt6Jdo85RFk)
Dataset EV4: Per‐residue average SERF2 binding, TANGO and WALTZ scores, and net charge. Unishare (https://unishare.nl/index.php/s/ggoGMt6Jdo85RFk)
Dataset EV5: Enrichments of amino acids in binding peptides deviating from prediction. Unishare (https://unishare.nl/index.php/s/ggoGMt6Jdo85RFk)
Dataset EV6: Amyloid Growth Parameters. Unishare (https://unishare.nl/index.php/s/ggoGMt6Jdo85RFk)
Dataset EV7 C.elegans amyloid beta aggregation and toxicity measurements. Unishare (https://unishare.nl/index.php/s/ggoGMt6Jdo85RFk)
R‐script: used for the analysis of the Microarray peptide screen (.html and .Rmd). Unishare (https://unishare.nl/index.php/s/ggoGMt6Jdo85RFk)
References
- Adav SS, Gallart‐Palau X, Tan KH, Lim SK, Tam JP, Sze SK (2016) Dementia‐linked amyloidosis is associated with brain protein deamidation as revealed by proteomic profiling of human brain tissues. Mol Brain 9: 20 [DOI] [PMC free article] [PubMed] [Google Scholar]
- Aprile FA, Sormanni P, Perni M, Arosio P, Linse S, Knowles TPJ, Dobson CM, Vendruscolo M (2017) Selective targeting of primary and secondary nucleation pathways in Aβ42 aggregation using a rational antibody scanning method. Sci Adv 3: e1700488 [DOI] [PMC free article] [PubMed] [Google Scholar]
- Benson MD, Buxbaum JN, Eisenberg DS, Merlini G, Saraiva MJM, Sekijima Y, Sipe JD, Westermark P (2019) Amyloid nomenclature 2018: recommendations by the International Society of Amyloidosis (ISA) nomenclature committee. Amyloid 27: 212–222 [DOI] [PubMed] [Google Scholar]
- Bertoncini CW, Jung Y‐S, Fernandez CO, Hoyer W, Griesinger C, Jovin TM, Zweckstetter M (2005) Release of long‐range tertiary interactions potentiates aggregation of natively unstructured alpha‐synuclein. Proc Natl Acad Sci U S A 102: 1430–1435 [DOI] [PMC free article] [PubMed] [Google Scholar]
- Bongiovanni M, Aprile F, Sormanni P, Vendruscolo M (2018) A rationally designed Hsp70 variant rescues the aggregation‐associated toxicity of human IAPP in cultured pancreatic islet β‐Cells. Int J Mol Sci 19: 1443 [DOI] [PMC free article] [PubMed] [Google Scholar]
- Borgia A, Borgia MB, Bugge K, Kissling VM, Heidarsson PO, Fernandes CB, Sottini A, Soranno A, Buholzer KJ, Nettels D et al (2018) Extreme disorder in an ultrahigh‐affinity protein complex. Nature 555: 61–66 [DOI] [PMC free article] [PubMed] [Google Scholar]
- Bruinsma IB, Bruggink KA, Kinast K, Versleijen AAM, Segers‐Nolten IMJ, Subramaniam V, Bea Kuiperij H, Boelens W, de Waal RMW, Verbeek MM (2011) Inhibition of α‐synuclein aggregation by small heat shock proteins. Proteins 79: 2956–2967 [DOI] [PubMed] [Google Scholar]
- Calamai M, Kumita JR, Mifsud J, Parrini C, Ramazzotti M, Ramponi G, Taddei N, Chiti F, Dobson CM (eds.) (2006) Nature and significance of the interactions between amyloid fibrils and biological polyelectrolytes. Biochemistry 45: 12806‐12815. [DOI] [PubMed] [Google Scholar]
- Chiti F, Dobson CM (2017) Protein misfolding, amyloid formation, and human disease: a summary of progress over the last decade. Annu Rev Biochem 86: 27–68 [DOI] [PubMed] [Google Scholar]
- Cohlberg JA, Li J, Uversky VN, Fink AL (2002) Heparin and other glycosaminoglycans stimulate the formation of amyloid fibrils from α‐Synuclein in vitro . Biochemistry 41: 1502–1511. [DOI] [PubMed] [Google Scholar]
- Dammers C, Reiss K, Gremer L, Lecher J, Ziehm T, Stoldt M, Schwarten M, Willbold D (2017) Pyroglutamate‐modified amyloid‐ β (3–42) shows α ‐helical intermediates before amyloid formation. Biophys J 112: 1621–1633 [DOI] [PMC free article] [PubMed] [Google Scholar]
- Danielsson J, Pierattelli R, Banci L, Gräslund A (2007) High‐resolution NMR studies of the zinc‐binding site of the Alzheimer’s amyloid β‐peptide. FEBS J 274: 46–59 [DOI] [PubMed] [Google Scholar]
- De Baets G, Van Durme J, Rousseau F, Schymkowitz J (2014) A genome‐wide sequence‐structure analysis suggests aggregation gatekeepers constitute an evolutionary constrained functional class. J Mol Biol 426: 2405–2412 [DOI] [PubMed] [Google Scholar]
- DeMarco ML, Daggett V (2004) From conversion to aggregation: protofibril formation of the prion protein. Proc Natl Acad Sci U S A 101: 2293–2298 [DOI] [PMC free article] [PubMed] [Google Scholar]
- Faller P (2009) Copper and zinc binding to amyloid‐beta: coordination, dynamics, aggregation, reactivity and metal‐ion transfer. ChemBioChem 10: 2837–2845 [DOI] [PubMed] [Google Scholar]
- Falsone S, Meyer N, Schrank E, Leitinger G, Pham C, Fodero‐Tavoletti M, Holmberg M, Dulle M, Scicluna B, Gesslbauer B et al (2012) SERF protein is a direct modifier of amyloid fiber assembly. Cell Rep 2: 358–371 [DOI] [PMC free article] [PubMed] [Google Scholar]
- Fernandez‐Escamilla A‐M, Rousseau F, Schymkowitz J, Serrano L (2004) Prediction of sequence‐dependent and mutational effects on the aggregation of peptides and proteins. Nat Biotechnol 22: 1302–1306 [DOI] [PubMed] [Google Scholar]
- Freilich R, Betegon M, Tse E, Mok SA, Julien O, Agard DA, Southworth DR, Takeuchi K, Gestwicki JE (2018) Competing protein‐protein interactions regulate binding of Hsp27 to its client protein tau. Nat Commun 9: 4563 [DOI] [PMC free article] [PubMed] [Google Scholar]
- Gallrein C, Iburg M, Michelberger T, Koçak A, Puchkov D, Liu F, Ayala Mariscal SM, Nayak T, Kaminski Schierle GS, Kirstein J (2021) Novel amyloid‐beta pathology C. elegans model reveals distinct neurons as seeds of pathogenicity. Prog Neurogibol 198: 101907 [DOI] [PubMed] [Google Scholar]
- Garidel P, Blume A, Wagner M (2015) Prediction of colloidal stability of high concentration protein formulations. Pharm Dev Technol 20: 367–374 [DOI] [PubMed] [Google Scholar]
- Goers J, Uversky VN, Fink AL (2003) Polycation‐induced oligomerization and accelerated fibrillation of human alpha‐synuclein in vitro . Protein Sci 12: 702–707 [DOI] [PMC free article] [PubMed] [Google Scholar]
- Goldschmidt L, Teng PK, Riek R, Eisenberg D (2010) Identifying the amylome, proteins capable of forming amyloid‐like fibrils. Proc Natl Acad Sci U S A 107: 3487–3492 [DOI] [PMC free article] [PubMed] [Google Scholar]
- de Graff AMR, Hazoglou MJ, Dill KA (2016) Highly charged proteins: the achilles’ heel of aging proteomes. Structure 24: 329–336 [DOI] [PubMed] [Google Scholar]
- Gribenko AV, Makhatadze GI (2007) Role of the charge‐charge interactions in defining stability and halophilicity of the CspB proteins. J Mol Biol 366: 842–856 [DOI] [PubMed] [Google Scholar]
- Hinderhofer K, Obermaier C, Hegenbart U, Schönland S, Seidler M, Sommer‐Ort I, Barth U (2019) New sequence variants in patients affected by amyloidosis show transthyretin instability by isoelectric focusing. Amyloid 26: 85–93 [DOI] [PubMed] [Google Scholar]
- Hong D‐P, Xiong W, Chang J‐Y, Jiang C (2011) The role of the C‐terminus of human α‐synuclein: Intra‐disulfide bonds between the C‐terminus and other regions stabilize non‐fibrillar monomeric isomers. FEBS Lett 585: 561–566 [DOI] [PubMed] [Google Scholar]
- Houben B, Michiels E, Ramakers M, Konstantoulea K, Louros N, Verniers J, der Kant R, De Vleeschouwer M, Chicória N, Vanpoucke T et al (2020) Autonomous aggregation suppression by acidic residues explains why chaperones favour basic residues. EMBO J 39: e102864 [DOI] [PMC free article] [PubMed] [Google Scholar]
- Kayed R, Lasagna‐Reeves CA (2012) Molecular mechanisms of amyloid oligomers toxicity. J Alzheimer’s Dis 33: S67–S78 [DOI] [PubMed] [Google Scholar]
- Kim YE, Hosp F, Frottin F, Ge H, Mann M, Hayer‐Hartl M, Hartl FU (2016) Soluble oligomers of PolyQ‐expanded huntingtin target a multiplicity of key cellular factors. Mol Cell 63: 951–964 [DOI] [PubMed] [Google Scholar]
- Klaips CL, Jayaraj GG, Hartl FU (2018) Pathways of cellular proteostasis in aging and disease. J Cell Biol 217: 51–63 [DOI] [PMC free article] [PubMed] [Google Scholar]
- Kummer MP, Heneka MT (2014) Truncated and modified amyloid‐beta species. Alzheimers Res Ther 6: 28 [DOI] [PMC free article] [PubMed] [Google Scholar]
- Li W, West N, Colla E, Pletnikova O, Troncoso JC, Marsh L, Dawson TM, Jäkälä P, Hartmann T, Price DL et al (2005) Aggregation promoting C‐terminal truncation of alpha‐synuclein is a normal cellular process and is enhanced by the familial Parkinson’s disease‐linked mutations. Proc Natl Acad Sci U S A 102: 2162–2167 [DOI] [PMC free article] [PubMed] [Google Scholar]
- López‐Otín C, Blasco MA, Partridge L, Serrano M, Kroemer G (2013) The hallmarks of aging. Cell 153: 1194–1217 [DOI] [PMC free article] [PubMed] [Google Scholar]
- Maurer‐Stroh S, Debulpaep M, Kuemmerer N, de la Paz ML, Martins IC, Reumers J, Morris KL, Copland A, Serpell L, Serrano L et al (2010) Exploring the sequence determinants of amyloid structure using position‐specific scoring matrices. Nat Methods 7: 237–242 [DOI] [PubMed] [Google Scholar]
- Meinen BA, Gadkari VV, Stull F, Ruotolo BT, Bardwell JCA (2019) SERF engages in a fuzzy complex that accelerates primary nucleation of amyloid proteins. Proc Natl Acad Sci U S A 116: 23040–23049 [DOI] [PMC free article] [PubMed] [Google Scholar]
- Merle DA, Witternigg A, Tam‐Amersdorfer C, Hartlmüller C, Spreitzer E, Schrank E, Wagner‐Lichtenegger S, Werzer O, Zangger K, Kungl AJ et al (2019) Increased aggregation tendency of alpha‐synuclein in a fully disordered protein complex. J Mol Biol 431: 2581–2598 [DOI] [PubMed] [Google Scholar]
- Meyer NH, Dellago H, Tam‐Amersdorfer C, Merle DA, Parlato R, Gesslbauer B, Almer J, Gschwandtner M, Leon A, Franzmann TM et al (2020) Structural fuzziness of the RNA‐organizing protein SERF determines a toxic gain‐of‐interaction. J Mol Biol 432: 930–951 [DOI] [PubMed] [Google Scholar]
- Molliex A, Temirov J, Lee J, Coughlin M, Kanagaraj AP, Kim HJ, Mittag T, Taylor JP (2015) Phase separation by low complexity domains promotes stress granule assembly and drives pathological fibrillization. Cell 163: 123–133 [DOI] [PMC free article] [PubMed] [Google Scholar]
- Moro ML, Phillips AS, Gaimster K, Paul C, Mudher A, Nicoll JAR, Boche D (2018) Pyroglutamate and isoaspartate modified amyloid‐beta in ageing and Alzheimer’s disease. Acta Neuropathol Commun 6: 3 [DOI] [PMC free article] [PubMed] [Google Scholar]
- Munder MC, Midtvedt D, Franzmann T, Nüske E, Otto O, Herbig M, Ulbricht E, Müller P, Taubenberger A, Maharana S et al (2016) A pH‐driven transition of the cytoplasm from a fluid‐ to a solid‐like state promotes entry into dormancy. Elife 5: e09347 [DOI] [PMC free article] [PubMed] [Google Scholar]
- Nandi PK, Leclerc E, Nicole J‐C, Takahashi M (2002) DNA‐induced partial unfolding of prion protein leads to its polymerisation to amyloid. J Mol Biol 322: 153–161 [DOI] [PubMed] [Google Scholar]
- Narain Y, Wyttenbach A, Rankin J, Furlong RA, Rubinsztein DC (1999) A molecular investigation of true dominance in Huntington’s disease. J Med Genet 36: 739–746 [DOI] [PMC free article] [PubMed] [Google Scholar]
- Pak CW, Kosno M, Holehouse AS, Padrick SB, Mittal A, Ali R, Yunus AA, Liu DR, Pappu RV, Rosen MK (2016) Sequence determinants of intracellular phase separation by complex coacervation of a disordered protein. Mol Cell 63: 72–85 [DOI] [PMC free article] [PubMed] [Google Scholar]
- Pujol N, Link EM, Liu LX, Kurz CL, Alloing G, Tan MW, Ray KP, Solari R, Johnson CD, Ewbank JJ (2001) A reverse genetic analysis of components of the toll signaling pathway in Caenorhabditis elegans . Curr Biol 11: 809–821 [DOI] [PubMed] [Google Scholar]
- Ray S, Singh N, Kumar R, Patel K, Pandey S, Datta D, Mahato J, Panigrahi R, Navalkar A, Mehra S et al (2020) α‐Synuclein aggregation nucleates through liquid‐liquid phase separation. Nat Chem 12(8): 705–716 [DOI] [PubMed] [Google Scholar]
- Sangwan S, Zhao A, Adams KL, Jayson CK, Sawaya MR, Guenther EL, Pan AC, Ngo J, Moore DM, Soriaga AB et al (2017) Atomic structure of a toxic, oligomeric segment of SOD1 linked to amyotrophic lateral sclerosis (ALS). Proc Natl Acad Sci U S A 114: 8770–8775 [DOI] [PMC free article] [PubMed] [Google Scholar]
- Sant'Anna R, Braga C, Varejão N, Pimenta KM, Graña‐Montes R, Alves A, Cortines J, Cordeiro Y, Ventura S, Foguel D (2014) The importance of a gatekeeper residue on the aggregation of transthyretin: implications for transthyretin‐related amyloidoses. J Biol Chem 289: 28324–28337 [DOI] [PMC free article] [PubMed] [Google Scholar]
- Scheidt HA, Adler J, Zeitschel U, Höfling C, Korn A, Krueger M, Roßner S, Huster D (2017) Pyroglutamate‐modified amyloid β (11–40) fibrils are more toxic than wildtype fibrils but structurally very similar. Chemistry 23: 15834–15838 [DOI] [PubMed] [Google Scholar]
- Serpell LC (2000) Alzheimer’s amyloid fibrils: structure and assembly. Biochim Biophys Acta 1502: 16–30 [DOI] [PubMed] [Google Scholar]
- Shammas SL, Waudby CA, Wang S, Buell AK, Knowles TPJ, Ecroyd H, Welland ME, Carver JA, Dobson CM, Meehan S (2011) Binding of the molecular chaperone αb‐crystallin to Aβ amyloid fibrils inhibits fibril elongation. Biophys J 101: 1681–1689 [DOI] [PMC free article] [PubMed] [Google Scholar]
- Shin Y, Brangwynne CP (2017) Liquid phase condensation in cell physiology and disease. Science 357: eaaf4382 [DOI] [PubMed] [Google Scholar]
- Sin O, de Jong T, Mata‐Cabana A, Kudron M, Zaini MA, Aprile FA, Seinstra RI, Stroo E, Prins RW, Martineau CN et al (2017) Identification of an RNA polymerase III regulator linked to disease‐associated protein aggregation. Mol Cell 65: 1096–1108.e6 [DOI] [PMC free article] [PubMed] [Google Scholar]
- Sorrentino ZA, Vijayaraghavan N, Gorion K‐M, Riffe CJ, Strang KH, Caldwell J, Giasson BI (2018) Physiological carboxy‐truncation of α‐synuclein potentiates the prion‐like formation of pathological inclusions. J Biol Chem 293: 18914–18932 [DOI] [PMC free article] [PubMed] [Google Scholar]
- Stadler V, Felgenhauer T, Beyer M, Fernandez S, Leibe K, Güttler S, Gröning M, König K, Torralba G, Hausmann M et al (2008) Combinatorial synthesis of peptide arrays with a laser printer. Angew Chem Int Ed Engl 47: 7132–7135 [DOI] [PubMed] [Google Scholar]
- Stroo E, Koopman M, Nollen EAA, Mata‐Cabana A (2017) Cellular regulation of amyloid formation in aging and disease. Front Neurosci 11: 64 [DOI] [PMC free article] [PubMed] [Google Scholar]
- Talmard C, Guilloreau L, Coppel Y, Mazarguil H, Faller P (2007) Amyloid‐beta peptide forms monomeric complexes with CuII and ZnII prior to aggregation. ChemBioChem 8: 163–165 [DOI] [PubMed] [Google Scholar]
- Thompson RW, Latypov RF, Wang Y, Lomakin A, Meyer JA, Vunnum S, Benedek GB (2016) Evaluation of effects of pH and ionic strength on colloidal stability of IgG solutions by PEG‐induced liquid‐liquid phase separation. J Chem Phys 145: 185101 [DOI] [PubMed] [Google Scholar]
- Tuttle MD, Comellas G, Nieuwkoop AJ, Covell DJ, Berthold DA, Kloepper KD, Courtney JM, Kim JK, Barclay AM, Kendall A et al (2016) Solid‐state NMR structure of a pathogenic fibril of full‐length human α‐synuclein. Nat Struct Mol Biol 23: 409–415 [DOI] [PMC free article] [PubMed] [Google Scholar]
- Uversky VN, Li J, Fink AL (2001) Metal‐triggered structural transformations, aggregation, and fibrillation of human alpha‐synuclein. A possible molecular NK between Parkinson’s disease and heavy metal exposure. J Biol Chem 276: 44284–44296 [DOI] [PubMed] [Google Scholar]
- van Ham TJ, Holmberg MA, van der Goot AT, Teuling E, Garcia‐Arencibia M, Kim H‐E, Du D, Thijssen KL, Wiersma M, Burggraaff R et al (2010) Identification of MOAG‐4/SERF as a regulator of age‐related proteotoxicity. Cell 142: 601–612 [DOI] [PubMed] [Google Scholar]
- Viet MH, Nguyen PH, Ngo ST, Li MS, Derreumaux P (2013) Effect of the tottori familial disease mutation (D7N) on the monomers and dimers of Aβ40 and Aβ42 . ACS Chem Neurosci 4: 1446–1457 [DOI] [PMC free article] [PubMed] [Google Scholar]
- Walther DM, Kasturi P, Zheng M, Pinkert S, Vecchi G, Ciryam P, Morimoto RI, Dobson CM, Vendruscolo M, Mann M et al (2015) Widespread proteome remodeling and aggregation in aging C. elegans . Cell 161: 919–932 [DOI] [PMC free article] [PubMed] [Google Scholar]
- Wang M, Herrmann CJ, Simonovic M, Szklarczyk D, von Mering C (2015) Version 4.0 of PaxDb: protein abundance data, integrated across model organisms, tissues, and cell‐lines. Proteomics 15: 3163–3168 [DOI] [PMC free article] [PubMed] [Google Scholar]
- Wanker EE, Scherzinger E, Heiser V, Sittler A, Eickhoff H, Lehrach H (1999) Membrane filter assay for detection of amyloid‐like polyglutamine‐containing protein aggregates. Methods Enzymol 309: 375–386 [DOI] [PubMed] [Google Scholar]
- Wickramasinghe SP, Lempart J, Merens HE, Murphy J, Huettemann P, Jakob U, Rhoades E (2019) Polyphosphate initiates tau aggregation through intra‐ and intermolecular scaffolding. Biophys J 117: 717–728 [DOI] [PMC free article] [PubMed] [Google Scholar]
- Wildburger NC, Esparza TJ, LeDuc RD, Fellers RT, Thomas PM, Cairns NJ, Kelleher NL, Bateman RJ, Brody DL (2017) Diversity of amyloid‐beta proteoforms in the Alzheimer’s disease brain. Sci Rep 7: 9520 [DOI] [PMC free article] [PubMed] [Google Scholar]
- Xiao L, Honig B (1999) Electrostatic contributions to the stability of hyperthermophilic proteins 1 1Edited by J. M. Thornton. J Mol Biol 289: 1435–1444 [DOI] [PubMed] [Google Scholar]
- Xu L, Chen Y, Wang X (2014) Dual effects of familial Alzheimer’s disease mutations (D7H, D7N, and H6R) on amyloid β peptide: correlation dynamics and zinc binding. Proteins 82: 3286–3297 [DOI] [PubMed] [Google Scholar]
- Yang X, Meisl G, Frohm B, Thulin E, Knowles TPJ, Linse S (2018) On the role of sidechain size and charge in the aggregation of Aβ42 with familial mutations. Proc Natl Acad Sci U S A 115: E5849–E5858 [DOI] [PMC free article] [PubMed] [Google Scholar]
- Yoshimura Y, Holmberg MA, Kukic P, Andersen CB, Mata‐Cabana A, Falsone SF, Vendruscolo M, Nollen EAA, Mulder FAA (2017) MOAG‐4 promotes the aggregation of α‐synuclein by competing with self‐protective electrostatic interactions. J Biol Chem 292: 8269–8278 [DOI] [PMC free article] [PubMed] [Google Scholar]
- Yugay D, Goronzy DP, Kawakami LM, Claridge SA, Song T‐B, Yan Z, Xie Y‐H, Gilles J, Yang Y, Weiss PS (2016) Copper ion binding site in β‐amyloid peptide. Nano Lett 16: 6282–6289 [DOI] [PubMed] [Google Scholar]