

Abstract
So‐called ρ0 cells lack mitochondrial DNA and are therefore incapable of aerobic ATP synthesis. How cells adapt to survive ablation of oxidative phosphorylation remains poorly understood. Complexome profiling analysis of ρ0 cells covered 1,002 mitochondrial proteins and revealed changes in abundance and organization of numerous multiprotein complexes including previously not described assemblies. Beyond multiple subassemblies of complexes that would normally contain components encoded by mitochondrial DNA, we observed widespread reorganization of the complexome. This included distinct changes in the expression pattern of adenine nucleotide carrier isoforms, other mitochondrial transporters, and components of the protein import machinery. Remarkably, ablation of mitochondrial DNA hardly affected the complexes organizing cristae junctions indicating that the altered cristae morphology in ρ0 mitochondria predominantly resulted from the loss of complex V dimers required to impose narrow curvatures to the inner membrane. Our data provide a comprehensive resource for in‐depth analysis of remodeling of the mitochondrial complexome in response to respiratory deficiency.
Keywords: complexome profiling, mitochondria, mtDNA, OXPHOS, rho0 cells
Subject Categories: Organelles
Human ρ0 cells incapable of aerobic ATP synthesis can survive without respiration by reorganizing the mitochondrial proteome.

Introduction
Mitochondria are the central hub of metabolism and are key players in cellular homeostasis and survival (Spinelli & Haigis, 2018). To optimally fulfill this role in higher organisms, they need to adapt to a wide range of requirements in specialized cells and changing environments. Especially for mammalian mitochondria, this not only concerns their functional make‐up but is also evident from a remarkable variability in overall shape and folding of the inner membrane (Giacomello et al, 2020). This pronounced functional and structural flexibility allows mitochondria to respond to deficiencies imposed by inherited monogenic mitochondrial diseases (Rahman & Rahman, 2018) or functional deterioration in neurodegeneration (Grimm & Eckert, 2017) or biological aging (Kauppila et al, 2017). Ultimately, the extent to which mitochondria are able to restore homeostasis in a given tissue or cell type will be reflected in the pattern of affected organs, disease severity, and progression. Although much is known about the structure and function of mitochondria and their constituents, the complex interactive protein network underlying their ability to adapt and compensate for functional challenges remains enigmatic.
Multiprotein complexes are central to many mitochondrial properties and functions including biogenesis, morphology, dynamics, and metabolic pathways. The inventory and composition of mitochondrial complexes is dynamic, and many proteins may be constituents of different assemblies at the same time. These dynamics cannot be addressed adequately by studying purified complexes or by commonly used methods to study interactomes that are restricted to binary protein‐protein interactions only (Zhou et al, 2016; Antonicka et al, 2020). Complexome profiling overcomes these limitations by providing a comprehensive analysis not only of the proteome but also the inventory of multiprotein assemblies including their apparent molecular mass, their composition, and relative abundance (Heide et al, 2012).
The impressive adaptive capacity of mammalian mitochondria is best exemplified by so‐called ρ0 cells (King & Attardi, 1989) that are devoid of mitochondrial DNA (mtDNA) encoding for 13 subunits of complexes of the oxidative phosphorylation (OXPHOS) system and the organellar r‐ and t‐RNAs. Thus, ρ0 cells lack the central enzymes of aerobic energy metabolism and are entirely dependent on anaerobic glycolysis for ATP production. Nevertheless, ρ0 cells are viable and grow well in standard media that only need to be supplemented with uridine, since dihydroorotate dehydrogenase, a key enzyme of pyrimidine synthesis, requires ubiquinone as electron acceptor. Thus, it is dependent on a functional mitochondrial respiratory chain. As such, ρ0 cells can be considered an all‐encompassing model of OXPHOS deficiency directly affecting the assembly of mitochondrial ribosomes and complexes I, III, IV, and V. To assess the immediate effect on these complexes and to study the consequences on other mitochondrial proteins and multiprotein complexes not directly dependent on mtDNA, we performed a comprehensive analysis of control and ρ0 mitochondria by complexome profiling.
Results
Assessing the mitochondrial complexome
To assess the inventory of mitochondrial proteins and multiprotein assemblies and its modulation by the ablation of mtDNA, we measured four complexome profiles of mitochondria from 143B osteosarcoma cells and ρ0 cells derived from this cell line by treatment with ethidium bromide (King & Attardi, 1989). Overall, we identified more than 4,000 different proteins by mass spectrometry. We detected 965 of the 1,158 proteins listed in the MitoCarta 2.0 database (Calvo et al, 2016) corresponding to a coverage of 83%. By manual analysis based on literature and database searches, we assigned 37 additional proteins to mitochondria, resulting in a total number of 1,002 identified mitochondrial proteins (Dataset EV1).
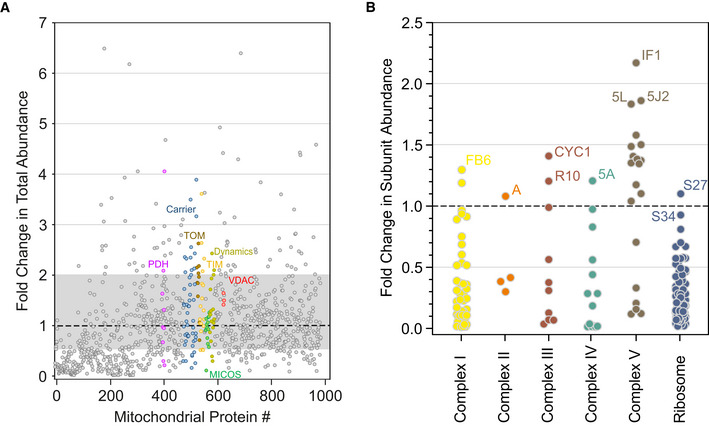
Since the mass range of the analysis also included the monomeric state of most proteins, we could assess their total amounts by integrating abundance values over the entire profile and determine the ratio by which they differed between control and ρ0 mitochondria (Fig 1A; Dataset EV1). Of the detected mitochondrial proteins, 11% (110) were increased and 28% (285) were decreased by at least two‐fold. As expected, ρ0 mitochondria did not contain mitoribosomes and OXPHOS complexes I, III, IV, V because central components of these multiprotein assemblies are encoded by mtDNA. Notably however, most nuclear‐encoded subunits of these complexes were still detectable in ρ0 cells. Their amounts varied over a wide range from less than 1% up to two‐fold of controls (Fig 1B). This underscores the need to analyze to what extent these proteins were present as monomers or as constituents of other complexes and subassemblies in ρ0 mitochondria.
Figure 1. Overall abundance changes of mitochondrial proteins.
-
A, BRelative change in total abundances between control and ρ0 cells averaged over four independent migration profiles (Dataset EV1). A, All mitochondrial proteins detected. Gray area indicates proteins that changed less than 2‐fold in both directions. Subunits of selected mitochondrial machineries are highlighted as follows: magenta, pyruvate dehydrogenase complex (PDH); blue, mitochondrial carriers (Carrier); brown, translocase of the outer membrane (TOM); yellow, translocase of the inner membrane (TIM); green, mitochondrial contact site and cristae organizing system (MICOS); yellow‐green, mitochondrial fusion‐fission system (Dynamics); red, porin or voltage dependent anion channel (VDAC); B, subunits of OXPHOS complexes (Complex I‐V) and mitoribosomes (Ribosome). Gene names of the subunit with the highest abundances in ρ0 cells are indicated for each complex. For the full gene name, add NDU (complex I), SDH (complex II), UQC (R10), COX (complex IV), ATP (5L, 5J2), MRP (Ribosome) in front of the abbreviated gene names given in the figure.
To account for experimental variations, we applied the COPAL tool (Van Strien et al, 2019) to align protein migration profiles and correct for differences in protein abundance from gel‐loading variations based on the total abundance of all detected MitoCarta 2.0 proteins (Dataset EV2). The aligned datasets contained 67 slices for each profile covering a mass range of approximately 20–3,300 kDa for membrane‐bound and 25–4,000 kDa for soluble proteins (Appendix Fig S1). The increment between two slices corresponded to ∼8% of the apparent molecular mass in any given range. All migration profiles that are always shown with abundance heatmaps on the top in the figures were derived from this aligned and averaged dataset (Dataset EV2).
Mitochondrial ribosomes and genetic system
mtDNA codes for two ribosomal RNAs (rRNA): 12S rRNA forms the core of the small 28S subunit and 16S rRNA the core of the large 39S subunit of the mitochondrial ribosome. In the complexome profiles of control mitochondria from 143B cells, we detected all 30 constituents of the 28S subunit (Amunts et al, 2015) co‐migrating at ∼2.2 MDa (Fig 2A). It can be concluded from these apparent masses that the two subunits of the mitochondrial ribosome were stable and retained their rRNAs under the experimental conditions used. MRPS36 initially was assigned to the 28S subunit, but was later identified as a component of the oxoglutarate dehydrogenase complex (OGDH) responsible for stabilizing the binding of the E3 component (dihydrolipoyl dehydrogenase, DLD) to the E1‐E2 core and renamed KGD4 (Heublein et al, 2014). Corroborating this reassignment, MRPS36 did not align with the 28S subunit, but co‐migrated with the other OGDH components and was lowered to the same extent in ρ0 mitochondria (Fig EV1). At ∼350 kDa, we observed a broad peak of ten ribosomal proteins forming a contiguous clamp around the 12S rRNA in the ribosome structure (Fig 2A). As expected, the ∼2.2 MDa peak was absent in ρ0 mitochondria, but about 50% of the ∼350 kDa subassembly were retained. This was also reflected in the total abundance of the corresponding subunits (Fig 2B). While the majority of the 28S proteins were down by at least 80%, the total amounts of the constituents of the subassembly were unchanged for two and reduced by only ∼40% for six of them. Overall, MRPS18C and MRPS6 were down by 80%, but since less of these proteins was found at < 100 kDa (Dataset EV2), the relative amounts in the 350 kDa complex of the ρ0 mitochondria were still comparable to the other eight components. The only other subunit retained at very high levels was MRPS28, most of which was found below 50 kDa in control and ρ0 mitochondria.
Figure 2. Mitochondrial ribosomes.

-
A–JThe small 28S (A) and large 39S (D) subunits are found in control (143B, blue lines) but absent in ρ0 cells (red lines), while subassemblies highlighted in color in the structural surface model (PDB 3J9M; Amunts et al, 2015) persist in the absence of ribosomal RNA. The relative changes for the individual components of the 28S (B) and 39S (C) subunits and migration profiles of the subassemblies as averages of its components (E‐J) are shown using the same color code. Note that peaks at 30 ‐ 60 kDa result from individual proteins rather than subassemblies. In (B‐C), data are presented as mean ± SD (n = 4). *P < 0.05, **P < 0.01, ***P < 0.001, ns, not significant (Student’s t‐test).
Figure EV1. MRPS36 association with oxoglutarate dehydrogenase.

The migration profiles and abundance plots from control (143B, solid lines) and ρ0 cells (dashed lines) of MRPS36 are compared to those of the 28S subunit of the mitochondrial ribosome (28S) and the subunits OGDH and DLST of the oxoglutarate dehydrogenase complex. MRPS36 initially assigned to the mitochondrial ribosome clearly identifies as a component of the dehydrogenase (Heublein et al, 2014). Curves and gene names are in corresponding colors.
With the exception of MRPL36, we detected all proteins of the 39S subunit including MRPL1 and MRPL12, which are not part of the cryo‐EM structure of the mitochondrial ribosome (Amunts et al, 2015). The total abundance of the majority of these proteins was reduced by at least 90% in ρ0 mitochondria (Fig 2C). In control but not ρ0 mitochondria, all 51 39S proteins co‐migrated at ∼2.2 MDa (Fig 2D). In the controls, sizeable amounts of several subassemblies were observed at masses of ∼90 kDa, ∼110 kDa, and ∼260 kDa that were almost absent in ρ0 mitochondria (Fig 2E–G). However, a less abundant subassembly at ∼180 kDa was clearly more abundant in the absence of mtDNA, although it appeared shifted to lower masses and its four components now formed a sharp peak at ∼80 kDa (Fig 2H). Two subassemblies migrating at ∼70 kDa and ∼300 kDa were only detected in ρ0 mitochondria (Fig 2I and J) explaining why the abundance of their constituent proteins remained high as compared to most proteins not found in subassemblies (Fig 2C). Notably, all subassemblies correspond to distinct structural domains of the 39S subunit (Fig 2D).
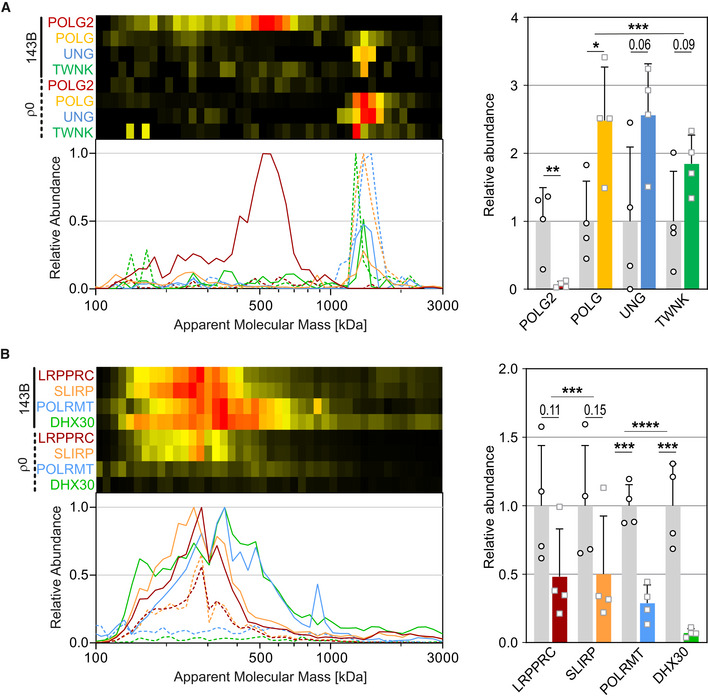
Next, we examined the adaptation of the mitochondrial genetic system in response to mtDNA removal. In control mitochondria, we detected a defined complex at ∼1.4 MDa containing the catalytic subunit of DNA polymerase γA (POLG), the DNA‐repair enzyme uracil‐DNA glycosylase (UNG), and the mtDNA helicase Twinkle (TWNK; Fig 3A). In ρ0 mitochondria, the abundance of this complex is increased about two‐fold. The unchanged apparent mass of this complex excludes that it contained any nucleic acids. Rather, it probably represented the protein core of the mtDNA replisome that has been reconstituted in vitro from POLG and TWNK and shown to synthesize DNA (Korhonen et al, 2004). The observed mass of about 1.4 MDa would be consistent with hexameric scaffold of TWNK (Fernandez‐Millan et al, 2015) each unit binding the other two proteins at a ratio of 1:1:1. Interestingly, the processivity subunit DNA polymerase γB (POLG2) was not part of this complex in control mitochondria but migrated in a peak at ∼550 kDa absent in ρ0 mitochondria (Fig 3A).
Figure 3. Genetic system of mitochondria.
-
A, BSelected proteins involved in DNA (A) and RNA (B) maintenance of control (143B, solid lines, gray bars) and ρ0 cells (dashed lines, colored bars). A, for POLG, UNG and TWNK, only abundances > 1 MDa were quantified. Plots and gene names are in corresponding colors. Data are presented as mean ± SD (n = 4). *P < 0.05, **P < 0.01, ***P < 0.001, ****P < 0.0001 (Student’s t‐test for individual proteins and two‐way ANOVA for changes of multiple proteins in a complex).
In controls, the mRNA‐binding LRPPRC‐SLIRP complex (Sasarman et al, 2010) was detected as a broad peak centered around 280 kDa that was reduced by about two‐fold in ρ0 mitochondria (Fig 3B). DNA‐directed RNA polymerase (POLRMT) was found in a complex with the RNA‐Helicase DHX30 migrating in a broad band centered around 350 kDa that was absent in ρ0 mitochondria (Fig 3B). The fact that the complexes migrated at essentially the same mass ranges in control and ρ0 cells indicates that they did not contain any RNA. Many other proteins involved in DNA maintenance, replication, transcription, and translation were found to be associated in multiprotein complexes and to change in pattern (Dataset EV2) and abundance (Dataset EV1) providing a rich resource for further studies.
Oxidative phosphorylation
Human mitochondrial DNA encodes 13 membrane proteins that are components of complexes I, III, IV of the respiratory chain and F1FO ATP synthase (complex V). Consequently, the fully assembled versions of these complexes and any supercomplexes were completely absent in ρ0 cells (Fig 4A and B). However, as summarized in Fig EV2 and discussed in more detail below, for all complexes, assembly intermediates persisted in the absence of mtDNA. For ATP synthase, the F1 part was retained and occurred in two distinct forms differing by ∼100 kDa in mass (Fig 4B). Closer inspection revealed that the larger variant co‐migrated with subunit c (ATP5G1) of the FO part (Fig EV3A) probably representing F1 with a bound c‐ring in line with the observed mass difference. Both subassemblies of complex V have been observed previously in human ρ0 cells and mtDNA depletion syndrome (Buchet & Godinot, 1998; Carrozzo et al, 2006). In controls, the ATP synthase inhibitor protein IF1 was mostly detected in free form, while it was almost completely bound to F1 and F1‐c subcomplexes in ρ0 cells (Fig 4B) as reported earlier (Carrozzo et al, 2006) and in line with a recent study on complex V assembly (He et al, 2018). Binding of IF1 to F1 and F1‐c subcomplexes could prevent wasteful ATP hydrolysis, although this reaction has been shown to be used to maintain the membrane potential in ρ0 mitochondria in conjunction with the nucleotide carrier ANT (Buchet & Godinot, 1998; Appleby et al, 1999).
Figure 4. Energy metabolism of mitochondria.

-
A–FOXPHOS complexes (A‐C) and selected enzymes involved in the energy metabolism of control (143B, solid lines) and ρ0 cells (dashed lines). A, Complex (C) I, III and IV; B, F1, FO domain and inhibitor protein IF1 of complex V; C, subunits SDHA, SDHB‐D and assembly factor SDHAF2 of complex II; D, oxoglutarate (OGDH; average of OGDHL, OGDH, DLST) and pyruvate dehydrogenase complex (PDH; average of PDHA1, PDHB, PDHX, DLAT); E, subunits of GDP forming (SUCLG2) and ADP forming (SUCLA2) succinyl‐CoA ligase; F, urea cycle enzymes and glutaminase (GLS). Plots and gene names are in corresponding colors.
Figure EV2. Submodules of OXPHOS complexes retained in ρ0 cells.

Subunits of subassemblies found to persist in ρ0 cells are highlighted in color and listed with the gene names in brackets next to the structural surface model of the respective OXPHOS complex. The surface models were generated from PDB coordinates 6G2J (complex I), 3AEF (complex II), 1BGY (complex III), 1V54 (complex IV) and 6ZQM (complex V) using the PyMol Molecular Graphics System 2.0 (Schrödinger, LLC). Associated assembly factors not present in the fully assembled structures are listed in gray.
Figure EV3. Assembly intermediates and subunits of OXPHOS complexes.

-
A–IAssembly intermediates and subunits of OXPHOS complexes of control (143B, solid (A, G, I) or blue (B‐F, H) lines) and ρ0 cells (dashed (A, G, I) or red (B‐F, H) lines). A, F1 domain and subunit c (ATP5G1) of complex V; B, peripheral stalk of complex V; C, N module of complex I; D, Q module of complex I; E, PD‐a module of complex I; F, cytochrome c1 subcomplex of complex III; G, cytochrome b and assembly factors UQCC1 and UQCC2 of complex III; H, complex IV subunits COX4I1 and COX5A; I, complex IV assembly factors PNKD, PET117 and PET100 (Vidoni et al, 2017). The gene names of the components used to generate the averaged migration profiles are indicated.
As for the mitochondrial ribosomes, other subassemblies consisting of nuclear‐encoded subunits were found in ρ0 cells for OXPHOS complexes as well. For complex V, a subassembly representing essentially its so‐called peripheral stalk (Spikes et al, 2020) was found in ρ0 cells, but not in control cells (Fig EV3B). For complex I, three assembly intermediates (Guerrero‐Castillo et al, 2017) were detected in significant amounts following ablation of mtDNA (Fig EV3, EV4, EV5). While the abundance of the major Q module intermediate was essentially unchanged, the steady‐state abundance of a partial N module was increased about 6‐fold, and that of the free PD‐a module even about 11‐fold. For complex III, substantial amounts of a cytochrome c1 subcomplex accumulated that was not detected at all in control cells (Fig EV3F). This subcomplex consisting of cytochrome c1 and subunits UQCR10 and UQCRH was described and biochemically characterized already a long time ago (Link et al, 1986) and indications for this subassembly have been found recently also in cytochrome b deficient cells (Palenikova et al, 2021). Notably, an intermediate of the complex III assembly factors UQCC1 and UQCC2 with bound cytochrome b (Tucker et al, 2013) found in control cells was essentially absent in ρ0 cells (Fig EV3G). In addition, significant amounts of core proteins 1 and 2 (UQCRC1 and UQCRC2) and the Rieske iron‐sulfur protein (UQCRFS1) were still present as individual proteins in ρ0 cells (Dataset EV1). For complex IV, subassemblies containing subunits IV‐1 and Va, not present in control cells but observed previously in cells deficient in mtDNA encoded complex IV subunits (Lobo‐Jarne et al, 2020), accumulated in ρ0 cells (Fig EV3H). Moreover, an interesting pattern was observed for three recently discovered interactors of monomeric complex IV (Vidoni et al, 2017): While PET100 largely disappeared in ρ0 cells, almost unchanged amounts of PET117 and PNKD/MR‐1S persisted seemingly as a small ∼40 kDa complex that was detectable in small amounts also in control cells (Fig EV3I, Dataset EV1).
Figure EV4. Additional mitochondrial transporters.

-
A–CFurther metabolite carriers of control (143B, solid lines, gray bars) and ρ0 cells (dashed lines, colored bars). The prefix SLC25 common to all gene names in this family is omitted. Curves, gene names and bars for ρ0 cells are in corresponding colors. Data are presented as mean ± SD (n = 4). *P < 0.05, **P < 0.01 (Student’s t‐test).
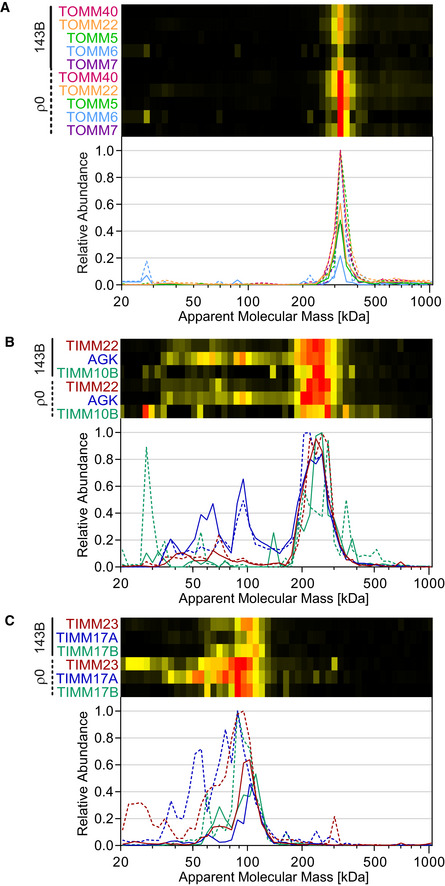
Figure EV5. Individual components of the protein import machinery.
-
A–CMigration profiles of the individual components of the mitochondrial translocase of the outer membrane (TOM) and the inner membrane (TIM) of control (143B, solid lines) and ρ0 cells (dashed lines). A, components of the TOM complex (TOMM40, TOMM22, TOMM5, TOMM6, TOMM7); B, components of TIM22 complex (TIMM22, AGK, TIMM10B), C, components of the TIM23 complex (TIMM23, TIMM17A, TIMM17B).
Pronounced changes were not only observed in respiratory chain enzymes containing mitochondria‐encoded subunits. Complex II abundance was reduced by about two‐thirds in ρ0 cells (Dataset EV1). However, in contrast to its other three subunits, the total amount of the FAD binding subunit SDHA remained unchanged because the fraction not bound to complex II was retained in a complex with the flavinylating assembly factor SDHAF2 described earlier (Hao et al, 2009), which was increased almost four‐fold in abundance (Fig 4C). Notably, while the amount of SDHAF3/LYRM8 involved in assembling SDHB (Na et al, 2014) was also significantly increased in ρ0 cells, SDHAF4, which facilitates assembly of SDHA into the complex (Van Vranken et al, 2014), was even reduced by 75% (Dataset EV1). Of the other major dehydrogenases feeding electrons onto ubiquinone, glycerol‐3‐phosphate dehydrogenase (GPD2) stayed approximately the same, while electron‐transferring flavoprotein dehydrogenase (ETFDH) was reduced by almost 80% consistent with its role in β‐oxidation (Dataset EV1). However, its substrate ETFA/B did not change significantly in abundance.
TCA cycle and intermediary metabolism
The tricarboxylic acid (TCA) cycle is the central pathway of mitochondrial metabolism and tightly linked to oxidative phosphorylation. Reflecting the adaptation of ρ0 cells to a purely glycolytic energy metabolism, the branch of the TCA cycle predominantly needed to supply redox equivalents to the respiratory chain was markedly downregulated. In addition to succinate dehydrogenase (complex II), the 2‐oxoglutarate dehydrogenase complex at ∼2.8 MDa (OGDH) was reduced by 80‐90% (Figs 4D and EV1) and the subunit isoform of succinyl‐coenzyme A (CoA)‐ligase conferring ATP specificity (SUCLA2), but not the one for GTP (SUCLG2) was reduced by two‐thirds (Fig 4E). The remaining TCA cycle enzymes taking part in other metabolic pathways and the pyruvate dehydrogenase (PDH) complex were not changed significantly (Fig 4D, Dataset EV1). Notably, the two components of PDH phosphatase PDP1 and PDPR were reduced by about 50%, possibly reflecting reduced acetyl‐CoA formation. The dependence on glycolytic ATP synthesis was also evident from a 2.5‐fold increase in lactate dehydrogenase (LDHA/B) suggesting that to some extent also changes in cytosolic enzymes can be estimated from our dataset (Dataset EV1).
The second major source of acetyl‐CoA for the TCA cycle and reduction of equivalents for the respiratory chain in mitochondria is the β‐oxidation of fatty acids. Overall changes in this pathway were rather limited, which may reflect that glucose was the major carbon source for the cells. However, carnitine‐O‐palmitoyl transferase 2 (CPT2), the enzyme transferring fatty acids imported into mitochondria onto CoA was halved in its abundance in ρ0 cells (Dataset EV1). Also, key components of mitochondrial fatty acid synthesis (MCAT, CBR4, HSD17B8) were downregulated by 60% or more, while a two‐fold upregulation of cytosolic ATP citrate synthase (ACLY) pointed toward increased fatty acid synthesis in this compartment. Notably, several enzymes involved in phospholipid metabolism were found to be significantly upregulated by 2‐ to 3‐fold. These enzymes included long‐chain‐fatty‐acid‐CoA ligase 4 (ACSL4), phosphatidylserine synthase 2 (PTDSS2), and dihydroxyacetone phosphate acyltransferase (GNPAT).
The amounts of mitochondrial aminotransferases connecting the TCA cycle with amino acid metabolism were not changed in ρ0 cells. In contrast, major changes were detectable for enzymes involved in nitrogen detoxification. Arginase (ARG2), ornithine aminotransferase (OAT), and glutaminase (GLS) were increased at least two‐fold (Fig 4F). However, carbamoyl‐phosphate synthase (CPS1), the enzyme required to feed ammonia into the urea cycle, was down to below 30%, a further indication for an imbalance in nitrogen homeostasis (Fig 4F). The opposite pattern was observed for components of the heme biosynthesis pathway: While the abundance of protoporphyrinogen oxidase (PPOX) was not changed significantly and ferrochelatase (FECH) was down two‐fold, 5‐aminolevulinate synthase (ALAS1), the enzyme using succinyl‐CoA formed in the TCA cycle to start the pathway, was one of the most upregulated proteins increasing by more than eight‐fold (Dataset EV1).
In general, expression of components of the mitochondrial iron‐sulfur cluster assembly machinery seemed not affected in ρ0 cells, except for a two‐fold reduction of ISCA1, ISCA2, and IBA57 (Dataset EV1), enzymes that are required for the maturation of mitochondrial [4Fe4S] proteins and of several subunits of respiratory complex I (Sheftel et al, 2012).
Mitochondrial transporters
The many carriers of the inner membrane play a crucial role in maintaining mitochondrial homeostasis by controlling import and export of metabolites, lipids, ions, and cofactors (Kunji et al, 2020). Indeed, we observed distinct changes in their abundance, but also in their organization in ρ0 cells.
We detected three of the four isoforms of the ADP/ATP translocase. As judged by the total iBAQ values (Dataset EV2), the abundance of ANT2 (SLC25A5), the isoform characteristic for highly proliferative cells, was about 100 times higher than that of ANT1 (SLC25A4), the isoform mostly found in differentiated muscle cells, and about 10 times higher than the ubiquitously expressed ANT3 (SLC25A6), reflecting the reported expression pattern for these isoforms (Brenner et al, 2011). In ρ0 cells, the abundance of ANT1 was further reduced by ∼70%, while the highly abundant ANT2 was further increased by ∼50% and ANT3 remained unchanged (Fig 5A). While much of all three ANT isoforms migrated as a monomer at about 30 kDa, significant amounts of complexes were also observed at 50–100 kDa (Fig 5A). Further studies would be needed to define the composition of these complexes. While it seems possible that they represent homodimers and homotrimers of the carriers, additional components could be involved. Notably however, the phosphate carrier (PiC, SLC25A3) was not found at ∼40 kDa, as expected for its monomeric form, but co‐migrated with the ANTs at 70–100 kDa consistent with its association with one or two molecules of ADP/ATP translocase. Moreover, its abundance was up by about 50% in ρ0 cells, comparable to ANT2 which like PiC exhibited higher peaks around 70 kDa (Fig 5A) corroborating earlier reports that the phosphate carrier associates with ANT (Leung et al, 2008).
Figure 5. Mitochondrial transporters.

-
A–DSelected metabolite carriers of control (143B, solid lines, gray bars) and ρ0 cells (dashed lines, colored bars). A, Isoforms of the nucleotide carrier (ANT1‐3) and phosphate carrier (PiC); B, pyruvate carrier; C, dicarboxylate carriers; D, mitoferrins (MFRN1‐2) and glycine transporter (GlyC). Plots and gene names are in corresponding colors. Data are presented as mean ± SD (n = 4). *P < 0.05, **P < 0.01 (Student’s t‐test).
Another key player in controlling mitochondrial energy metabolism is the pyruvate carrier consisting of two subunits, MPC1 and MPC2 (Bricker et al, 2012). In 143B cells, we found these two proteins to migrate predominantly at 80‐110 kDa (Fig 5B). However, MPC2 was clearly more abundant at the lower end of this mass range and the migration profile could be interpreted best by assuming a MPC12MPC24 hexamer and a MPC14MPC24 octamer. In ρ0 cells, we observed a doubling of MPC2 (Fig 5B). Although the total amount of MPC1 did not change, its oligomeric organization was clearly affected as well. The predominant complex in ρ0 cells was found at ∼90 kDa, consistent with a MPC2 homo‐hexamer. Moreover, peaks at ∼55 kDa (MPC1) and ∼60 kDa (MPC2) suggested formation of homo‐tetramers of MPC1 and MPC2, respectively. Rather than the octamer, a MPC13MPC23 hexamer migrating at ∼75 kDa seemed to be the predominant heteromeric complex in ρ0 cells (Fig 5B). Although these assignments have to be considered tentative, it seems clear that the oligomeric organization of the pyruvate carrier was markedly altered in ρ0 cells and it will be interesting to study the possible functional implications of these changes.
Many metabolites are transported as dicarboxylates across the inner mitochondrial membrane. The amount of dicarboxylate carrier DIC (SLC25A10) was doubled in ρ0 mitochondria (Fig 5C), while the oxoglutarate/malate carrier (OGC, SLC25A11) was slightly but significantly reduced (Fig 5C). Both forms of the aspartate/glutamate carrier Aralar1 (SLC25A12) and Aralar2 (SLC25A13) showed a dominant peak at ∼260 kDa indicative of a stable tetrameric organization and were not affected significantly by the ablation of mtDNA (Fig EV4A). This is remarkable since OGC and Aralar1/2 are the transporters of the malate/aspartate shuttle, a major transport mechanism to indirectly bring reducing equivalents across the inner mitochondrial membrane. In contrast, we observed a 70% reduction in the abundance of the oxoadipate carrier (ODC, SLC25A21), which also transports oxodicarboxylates, but mainly takes part in pathways needed for the degradation of amino acids like tryptophan (Fig 5C). Notably, all dicarboxylate carriers exhibited hardly any alterations in their migration profiles suggesting stable multimeric organization (Figs 5C and EV4A). DIC, OGC, and ODC are members of the major family of mitochondrial carriers and exhibited similar migration patterns as their relatives ANT and PiC (Fig 5A). However, much less OGC monomer, and no ODC monomer at all, was detected at ∼30 kDa. In ρ0 mitochondria, the 60 kDa peak of these two carriers was absent and for OGC it was missing in the controls as well (Fig 5C).
With an about nine‐fold increase in ρ0 cells, we observed the most pronounced change in abundance for mitoferrin‐2 (MFRN2, SLC25A28), whereas the amount of its isoform mitoferrin‐1 (MFRN1, SLC25A37) required for hemoglobin production in erythroid cells (Paradkar et al, 2009) was not altered significantly (Fig 5D; Dataset EV1). This increase in the generic iron transporter MFRN2 suggested that mtDNA deficient cells responded by ramping up import of the central component of iron‐sulfur clusters and heme centers as an attempt to compensate OXPHOS deficiency. A doubling in the amount of glycine transporter (GlyC, SLC25A38) required for the import of one of the key metabolites for porphyrin synthesis into mitochondria (Dataset EV1) and the already mentioned eight‐fold increase of 5‐aminolevulinate synthase (ALAS1), the enzyme feeding glycine into this pathway, corroborated this notion. Interestingly, migration profiles of MFRN2 showed a significant amount of the monomeric carrier, while MFRN1 instead seemed to partially assemble into a ∼600 kDa complex of unknown composition (Fig 5D).
Two‐ to three‐fold increases of the Graves’ disease carrier for coenzyme A (SLC25A16) and carriers transporting folate (SLC25A32) and pyrimidine nucleotides (SLC25A33) highlighted the upregulation of coenzyme transporters in ρ0 cells (Fig EV4B). SLC25A17, a carrier transporting multiple nucleotide type coenzymes, especially FAD, FMN, and AMP, but also NAD+, was found to be doubled in ρ0 cells as well. This is notable, since SLC25A17 has been reported to be located in peroxisomes (Agrimi et al, 2012). Indeed, this cell compartment consistently occurred in the mitochondrial preparations used, as evident from the presence of invariable amounts, e.g., of the peroxisomal marker protein PEX14.
Finally, we noted a markedly reduced abundance of the mitochondrial carriers SLC25A35, SLC25A51, and SLC25A53 (Fig EV4C). SLC25A35 and SLC25A53 are so‐called orphan carriers for which the transported substrate is not known, while SLC25A51 has been identified as a carrier for NAD+ very recently (Luongo et al, 2020).
Protein import machinery
Several hundred nuclear‐encoded proteins are needed for mtDNA maintenance, for transcription and translation of mitochondria‐encoded proteins, and as subunits and assembly factors for OXPHOS complexes. Proteins synthesized by cytosolic ribosomes are imported and sorted by the translocase complexes of the outer (TOM complexes) and the inner membrane (TIM complexes; Wiedemann & Pfanner, 2017).
Contrasting the decreased demand in imported proteins in the absence of mtDNA, TOM components were upregulated consistently in mitochondria from ρ0 cells (Fig 6A and B). A small but significantly increased portion of the receptor for mitochondrial targeting sequences TOMM20 was associated with the TOM core complex (TOMM40, TOMM22, TOMM5, TOMM6, TOMM7; Fig EV5A) in ρ0 cells, shifting its apparent mass from 330 to 350 kDa (Fig 6A). Of note, HSP72 (HSPA1A/B), a cytosolic heat‐shock protein that has been implicated in mitochondrial stress response and Parkin function (Drew et al, 2014) was also upregulated two‐fold and seemed to partially associate with the TOM40 complex as well (Fig 6A). TOMM70 that was and TOMM34 that was not changed in abundance by mtDNA ablation (Dataset EV1) are required for recruiting mitochondrial carriers to the import pathway, the latter by acting as a cytosolic co‐chaperone of Hsp70/Hsp90 (Faou & Hoogenraad, 2012), but were not found associated with the TOM40 complex (Fig 6B). TOMM40L exhibiting 51% sequence identity to TOMM40 migrated at a similar but distinctly smaller apparent mass than the TOM40 complex and did not change significantly in abundance (Fig 6B). The apparent mass of ∼300 kDa of the TOMM40L complex would be consistent with the formation of an octamer, but it cannot be excluded that it contains additional as yet unidentified proteins. However, no components of the TOM machinery were found to co‐migrate with TOMM40L (Dataset EV2).
Figure 6. Protein import machinery.

-
A–DComponents of the mitochondrial protein import machinery and selected proteins related to this process of control (143B, solid lines, gray bars) and ρ0 cells (dashed lines, colored and dark‐gray bars). A and B, components of the translocase of the outer membrane (TOM) machinery (TOM avg.: average of TOMM40, TOMM22, TOMM5, TOMM6, TOMM7); C, components of the translocase of the inner membrane (TIM) machinery (TIM22 avg.: TIMM22, AGK, TIMM10B; TIM23 avg.: TIMM23, TIMM17A, TIMM17B); D, components of the TIM23‐associated TIMM21 assembly machinery (left panel) and its association with prohibitin (PHB) and components of the mitochondrial quality control system (right panel). Plots and gene names are in corresponding colors, except for TIMM44 and TIMM50 (no migration profiles shown). In (A‐C) data are presented as mean ± SD (n = 4). *P < 0.05, **P < 0.01, ***P < 0.001, ****P < 0.0001 (Student’s t‐test).
Following import through the TOM complex, proteins have to be sorted to reach their final compartment within mitochondria. Mitochondrial carriers are targeted to the inner membrane through the TIM22 complex that was found to migrate at ∼260 kDa (Fig 6C), where its core component TIMM22 co‐migrated with the small TIM proteins TIMM9, TIMM10, and TIMM10B, as well as with its more recently discovered constituents TIMM29 (C19orf52; Callegari et al, 2016) and acylglycerol kinase (AGK; Kang et al, 2017; Vukotic et al, 2017; Fig EV5B). Abundance and composition were not affected in ρ0 cells, consistent with our observation of sustained high levels of mitochondrial carriers albeit their expression pattern was changed (Figs 5 and EV4).
In contrast, the abundance of the TIM23 core complex, predominantly responsible for the import of matrix proteins, was increased 2.5‐fold, possibly reflecting a compensatory response to OXPHOS deficiency (Fig 6C). Containing TIMM23, TIMM17A, and TIMM17B (Fig EV5C), this complex migrated at ∼90 kDa consistent with a dimeric state. Also, the amount of TIMM44 was doubled in ρ0 cells (Fig 6C, right panel), but in line with its loose attachment to the TIM23 complex (Wiedemann & Pfanner, 2017) this protein migrated in its monomeric (∼50 kDa) and dimeric form (∼100 kDa) as well (Dataset EV2). Moreover, a significant fraction of TIMM44 was found at ∼190 kDa (soluble mass scale), where it co‐migrated with its known interactor HSPA9 (mtHsp70; Schneider et al, 1994). TIMM50, another component of the TIM23 machinery (Mokranjac et al, 2003a), was detected as a monomer only and seemed to increase two‐fold as well in ρ0 cells, although this change did not quite reach the significance threshold (P = 0.08; Fig 6C, right panel).
Finally, we found some interesting assemblies involving TIMM21, which is linked to the TIM23 machinery and takes part in the assembly of OXPHOS complexes (van der Laan et al, 2006). TIMM21 was detected in a prominent complex at ∼1,300 kDa (Fig 6D, left panel) together with two other proteins, both homologs of yeast PAM1 and known to be involved in mitochondrial protein import albeit rather as interactors of TIMM23: DNAJC19 (TIMM14; Mokranjac et al, 2003b) and DNAJC15 (MCJ; Schusdziarra et al, 2013). In control cells, ∼18% of TIMM21 was found in this mass range. In ρ0 mitochondria, the amount of this complex was halved (Fig 6D) and now corresponded to just ∼5% of TIMM21, since its overall amount was increased 1.7‐fold (Dataset EV1). Both in 143B and ρ0 cells, about one‐third of TIMM21 co‐migrated with the TIMM23 indicating that its increase in abundance largely reflected the doubling of the amount of the TIM23 machinery caused by ablation of mtDNA (Fig 6C). Consistent with a role in OXPHOS biogenesis, the amount of TIMM21 and DNAJC19 in the 1,300 kDa complex was reduced in ρ0 cells. However, DNAJC15 was about doubled, possibly partially compensating the more pronounced decrease of DNAJC19 (Fig 6D, left panel). Since DNAJC19 has been reported to interact with prohibitins (Richter‐Dennerlein et al, 2014) and recently, a link between TIMM21 and protein quality control of the inner membrane was described (Richter et al, 2019), we compared the TIMM21 migration profiles with those of YME1L1, ROMO1, and prohibitin (PHB) and found that they clearly overlapped at 1,000–1,400 kDa (Fig 6D, right panel). YME1L1 showed a similar decrease as TIMM21 and the majority of both proteins was found at ∼1,300 kDa. Prohibitin and ROMO1 exhibited a broader distribution peaking at ∼1,100 kDa. This could be interpreted as partial loading of the prohibitin ring scaffold with TIMM21 and its interaction partners.
Mitochondrial morphology and dynamics
The morphology and ultrastructure of mitochondria in ρ0 cells is substantially altered: Aberrant folding of the inner membrane leads to abnormal cristae morphology (Fukuyama et al, 2002), and imbalance of the fusion/fission machinery results in increased fragmentation of mitochondria (Walczak et al, 2017).
An obvious cause for changes in cristae morphology is the absence of complex V, since rows of dimers of this OXPHOS complex are required for inducing the narrow curvatures needed for proper folding of the inner membrane (Davies et al, 2011). Another key player in shaping the inner membrane is the mitochondrial contact site and cristae organizing system (MICOS; Pfanner et al, 2014). This multiprotein complex organizes the domains called cristae junctions, where cristae sprout from the inner boundary membrane, and contributes to the formation of the contact sites by interacting with proteins in the outer membrane thus forming the mitochondrial intermembrane space bridging (MIB) complex (Xie et al, 2007). Our analysis revealed different MICOS complexes and—formed by their association with SAM components—MIB complexes (Huynen et al, 2016). Unexpectedly, their pattern was unaffected by mtDNA removal as both their abundance and relative distribution were essentially the same in control and ρ0 cells (Fig 7A).
Figure 7. Mitochondrial morphology and dynamics.

-
A–CSelected proteins and complexes involved in controlling mitochondrial morphology and fusion/fission machinery and related processes of control (143B, solid lines, gray bars) and ρ0 cells (dashed lines, colored bars). A, mitochondrial contact site and cristae organizing system (MICOS: MIC60, MIC19, MIC25) and SAM complex (SAM: SAMM50, MTX2, MTX3) together forming the MIB complex; B, proteins involved in controlling mitochondrial morphology (orange) and dynamics (teal); C, DNM1L/DRP1 and interacting proteins. For DNM1L, MTFR1, and ARL2BP, quantification of the entire migration profiles (Overall) and the range above 1,400 kDa only (> 1,400 kDa) are shown. Plots and gene names are in corresponding colors, except for ARL2 (dark‐gray) not shown in the plot. Data are presented as mean ± SD (n = 4). *P < 0.05, **P < 0.01, ***P < 0.001 (Student’s t‐test).
The dynamin‐related GTPase OPA1 and its cleavage by the metalloprotease OMA1 regulate the equilibrium between mitochondrial fusion and fission (Ishihara et al, 2006) and are also involved in remodeling mitochondrial cristae (Jiang et al, 2014). Yet, the overall abundance of both proteins remained unchanged in ρ0 cells and this was also true for a number of other components of the mitochondrial fusion/fission machinery (Fig 7B). Only for mitofusin‐2 (MFN2) a moderate, barely significant increase was observed. GDAP1, however, known to promote fission (Niemann et al, 2005) and annexin A6 (ANXA6), another regulator of mitochondrial morphology, were increased two‐fold. Annexin A6 attenuates the activity of dynamin‐like protein DNM1L/DRP1 that forms oligomeric tubular structures around mitochondrial fission sites (Chlystun et al, 2013). The majority of DNM1L migrated at ∼320 and ∼400 kDa consistent with homo‐oligomers of four and five copies, respectively. The overall abundance was not significantly different between control and ρ0 cells (Fig 7C). However, in control cells, a fraction of DNML1 co‐migrated at about 2,000 kDa with two other factors, ARL2BP and MTFR1, implicated in regulating mitochondrial dynamics. This complex was essentially absent in ρ0 cells (Fig 7C). MTFR1/CHPPR is a promotor of mitochondrial fission and involved in the network spheroid transition (Tonachini et al, 2004) and ARL2BP/BART binds the GTPase ARL2 required to maintain proper mitochondrial morphology (Newman et al, 2014). While the overall abundance of MTFR1/CHPPR was not changed by mtDNA ablation, ARL2 and its binding protein ARL2BP were reduced by about two‐thirds (Fig 7C). It should be noted that ARL2 and ARL2BP have also been reported to bind ANT1 (Sharer et al, 2002), which we found to be reduced by about 70% in ρ0 cells as well (Fig 5A). Yet, the significance of this interaction is unclear and there were no indications for this complex in our dataset.
Discussion
Covering more than 80% of the mitochondrial proteome, our analysis of the complexome of control and ρ0 cells (King & Attardi, 1989) provides a comprehensive assessment of the inventory of proteins, their structural organization and abundance, and how they adapt to ablation of mtDNA. The observed changes were widespread affecting many pathways and major multiprotein complexes (Fig 1, Dataset EV1). The dataset provides a comprehensive resource for in‐depth analysis of remodeling of the mitochondrial complexome in response to respiratory deficiency in health and disease. Here we focused our analysis on the most prominent and remarkable changes, as summarized schematically in Fig 8. As expected, the OXPHOS complexes containing mtDNA encoded subunits and the mitoribosomes were not assembled in ρ0 cells, but for all of them, subcomplexes most likely representing stalled assembly intermediates persisted or accumulated. While components of some pathways like the TCA cycle or proteins involved in mitochondrial RNA maintenance were downregulated, others like protein and iron import were upregulated, pointing to a compensatory response. Yet, a more detailed assessment revealed that often a differential response was found. While many parts of the protein import machinery were more abundant in ρ0 cells reflecting mainly an increased import of matrix proteins by the TOM and TIM23 complexes, TIMM21, the component linking this to OXPHOS complex assembly (van der Laan et al, 2006), was downregulated. Mirroring changes in the pattern but not overall abundance of mitochondrial transporters, the amount of the TIM22 complex responsible for importing these inner membrane proteins (Wiedemann & Pfanner, 2017) was unchanged. Other pathways exhibiting mixed responses include mtDNA polymerases, heme synthesis, and NH3 handling.
Figure 8. Overview of the most prominent changes in the mitochondrial complexome in ρ0 cells.

Red dashed outlines, lost complexes containing mtDNA encoded components; red, decreased abundance; green, increased abundance; gray, no significant change.
Given that ρ0 mitochondria are fragmented and exhibit strongly aberrant cristae (Fukuyama et al, 2002), changes in proteins and protein complexes controlling mitochondrial morphology and dynamics were unexpectedly confined. The amount and organization of the MICOS/MIB complexes (Pfanner et al, 2014; Huynen et al, 2016) and other key factors like OPA1 and OMA1 (Jiang et al, 2014) were not affected at all suggesting that the loss of complex V dimers (Davies et al, 2011) was predominantly responsible for morphological changes. Similarly, only a few differences were observed for the major components of the fusion/fission apparatus. Rather, GDAP1 and annexin A6, two less prominent modulators of mitochondrial dynamics (Niemann et al, 2005), were significantly increased. Most notably however, we identified a ∼2,000 kDa complex of DNML1/DRP1 (Chlystun et al, 2013) with ARL2BP and MTFR1 (Tonachini et al, 2004) in control cells, that was lost completely in ρ0 cells, possibly due to the general downregulation of ARL2 and ARL2BP (Newman et al, 2014).
While further analysis and follow‐up detailed functional analysis will be required, our study demonstrates that complexome profiling provides a wealth of information on the structural organization and plasticity of mitochondrial proteins and multiprotein complexes not achievable by other approaches. In addition to the examples discussed here, the dataset will serve as a rich resource for further studies on the mitochondrial complexome and how it responds to the challenge of OXPHOS deficiency.
Materials and Methods
Reagents and Tools table
| Reagent/Resource | Reference or Source | Catalog Number |
|---|---|---|
| Experimental Models | ||
| 143B Osteosarcoma cells (H. sapiens) | American Type Culture Collection | CRL‐8303 |
| Rho0 cells derived from 143B cells | Wittig et al (2010b) | |
| Chemicals, Enzymes and other reagents | ||
| DMEM 4.5 g/l Glucose w/o Glutamine and Sodium Pyruvate | Lonza Group | Cat # BE12‐733F |
| Fetal Bovine Serum (Heat‐Inactivated) | Life Technologies/Gibco | Cat # 10500064 |
| MEM Non‐Essential Amino Acid Solution (100×) | Sigma‐Aldrich | Cat # M7145 |
| L‐Glutamine | Sigma‐Aldrich | Cat # G7513 |
| Sodium Pyruvate | Sigma‐Aldrich | Cat # S8636 |
| Penicillin‐Streptomycin Solution | Sigma‐Aldrich | Cat # P4333 |
| Uridine | Sigma‐Aldrich | Cat # U3003 |
| Trypsin‐EDTA Solution 10× | Sigma‐Aldrich | Cat # 59418C |
| Coomassie Brilliant Blue G 250 | SERVA Electrophoresis | Cat # 17524 |
| 6‐Aminohexanoic Acid | Sigma‐Aldrich | Cat # A2504 |
| Digitonin Water Soluble | SERVA Electrophoresis | Cat # 19551 |
| Sequencing Grade Modified Trypsin | Promega | Cat # V5111 |
| Reprosil‐Pur 120 C18‐AQ 3 µM | Dr. Maisch GmbH | Cat # r13.aq.0001 |
| Acetonitrile ULC/MS – CC/SFC | Biosolve | Cat # 012041 |
| Software | ||
| MaxQuant 1.4.1.2 |
Cox and Mann (2008) |
|
| COPAL 1.0 |
van Strien et al (2019) |
|
| NOVA 0.8.0 |
http://www.bioinformatik.uni‐frankfurt.de/tools/nova Giese et al (2015) |
|
| GraphPad Prism 8.4.3 | http://www.graphpad.com | |
| PyMol Molecular Graphics System Version 2.0 | https://pymol.org Schrödinger, LLC | |
| Other | ||
| Q‐Exactive Orbitrap MS | Thermo Scientific | |
| EASY‐nLC 1000 | Thermo Scientific | |
| 100 µM PicoTip Emitter Column | New Objective Inc. | Cat # FS360‐100‐8‐N‐5‐C15 |
| Multiscreen‐BV, 1.2 µm Filter Plates | Millipore | Cat # MABVN1250 |
Methods and Protocols
Cell culture and preparation of mitochondria
Human osteosarcoma 143B cells (American Type Culture Collection no. CRL8303) and ρ0 cells derived from them (Wittig et al, 2010b) were grown in tissue culture flasks or roller bottles at 37°C in high‐glucose Dulbecco's Modified Eagles Medium (DMEM, Lonza) supplemented with 10% (v/v) fetal calf serum, 1 mM pyruvate, 2 mM glutamine, non‐essential amino acids, 100 U/ml penicillin, 0.1 mg/ml streptomycin, and 50 µg/ml uridine at 5% CO2.
Mitochondria were prepared as described in (Heide et al, 2012) with an additional purification step. Briefly, confluent cells were harvested by trypsinization (0.05% trypsin, 0.02% EDTA) and centrifugation (1,000 × g for 10 min), washed first with 0.9% NaCl and then with ice‐cold isolation buffer (250 mM sucrose, 1 mM EDTA, 20 mM Tris–HCl, pH 7.4). Afterward, cells were disrupted by ten strokes through a 30‐ml syringe fitted with a 20G needle. The cell homogenate was centrifuged at 1,000 × g for 10 min and the supernatant was centrifuged at 6,000 × g for 10 min. The mitochondria enriched pellet was resuspended in isolation buffer and loaded on top of a two‐step (34 and 51%) sucrose gradient. Tubes were centrifuged at 60,000 × g for 20 min, and the mitochondrial layer localized at the top of the 51% sucrose was carefully extracted and washed with isolation buffer, followed by centrifugation at 6,000 × g for 10 min. The resulting mitochondrial pellet was resuspended in 250 mM sucrose, 1 mM EDTA, 2 mM Tris–HCl, pH 7.4. Protein concentration was determined by the Lowry method.
Blue native electrophoresis
Separation of protein complexes by blue native electrophoresis (BNE) was carried out as described (Wittig et al, 2006). Mitochondria were centrifuged at 6,000 × g for 10 min at 4°C. The pellet was resuspended and diluted to a concentration of 10 mg/ml protein in ice‐cold solubilization buffer (50 mM NaCl, 2 mM aminohexanoic acid, 1 mM EDTA, 50 mM imidazole, pH 7.0). Samples were solubilized by addition of 6 g digitonin/g protein and cleared by centrifugation at 22,000 × g for 30 min. Coomassie blue G‐250 at 5% in 500 mM aminohexanoic acid was added at a detergent to dye ratio of 4:1. Finally, 80 µg of protein was loaded on 4–12% acrylamide gradient gels.
In‐gel digestion of BN gel slices and mass spectrometry
Lanes from BN gels were incubated in fixing solution (50% methanol, 10% acetic acid, 10 mM ammonium acetate) for 60 min followed by Coomassie blue staining. After two washes with water, lanes were cut into 60 even slices. Each slice was cut into smaller pieces and transferred to a filter microplate for in‐gel tryptic digestion following the procedure described previously (Heide et al, 2012). Peptides were recovered into a new 96‐well plate by centrifugation. Gel pieces were washed with 30% acetonitrile, 3% formic acid to retrieve remaining peptides, and the solution was dried completely in a SpeedVac for 3 h at 45°C. Peptides were solubilized in 20 µl 5% acetonitrile, 5% formic acid for LC‐MS/MS analysis.
Peptides were analyzed by liquid chromatography electrospray ionization tandem mass spectrometry (LC‐ESI‐MS/MS) in a Q‐Exactive mass spectrometer (Thermo Fisher Scientific) equipped with an Easy nLC1000 nano‐flow high‐performance liquid chromatography system at the front end (Heide et al, 2012). Peptide separation was performed using a 100 µm ID PicoTip emitter column (New Objective) filled with ReproSil‐Pur C18‐AQ reverse phase beads (3 µm particle size, 120 Å pore size; Dr. Maisch GmbH) with 30 min linear gradients of 5–35% acetonitrile with 0.1% formic acid. The mass spectrometer was operated in a Top 20 dependent, positive ion mode switching automatically between MS and data‐dependent MS/MS. Full scan MS mode (400–1,400 m/z) was operated at a resolution of 70,000 m/Δm with automatic gain control (AGC) target of 1 × 10⁶ ions and a maximum ion transfer of 20 ms. Selected ions for MS/MS were analyzed using the following parameters: resolution 17,500; AGC target of 1 × 10⁵; maximum ion transfer of 50 ms; 4.0 m/z isolation window; for CID a normalized collision energy 30% and dynamic exclusion of 30.0 s was used; A lock mass ion (m/z = 445.12) was applied for internal calibration (Olsen et al, 2005).
Mass spectrometric data analysis
All raw files were analyzed by MaxQuant 1.5 (Cox & Mann, 2008). Spectra were searched against the human NCBI Reference Sequence Database release 55 with known contaminants added and reverse decoy with a strict false discovery rate of 0.01. The final database search including raw files of the profiles from four biological replicates of mitochondria from 143B and ρ0 cells each and from a human cybrid cell line (Corona et al, 2001) as a reference were done with 20 ppm and 0.5 Da mass tolerances for precursor ions and fragmented ions, respectively. Trypsin was selected as protease with two missed cleavages allowed. Dynamic modifications included N‐terminal acetylation and oxidation of methionine. Cysteine carbamidomethylation was set as fixed modification. For label‐free protein quantification, unique plus razor peptides were considered.
Four migration profiles from each control and ρ0 cells (independent batches) were aligned and corrected for differences in protein abundance from gel‐loading variations based on the total abundance of mitochondrial proteins using COPAL (Van Strien et al, 2019). Profiles were hierarchically clustered by distance measures based on Pearson’s correlation coefficient (uncentered) and the average linkage method (de Hoon et al, 2004). The resulting protein abundance migration profiles were averaged and normalized from 0 to 1 for each protein across all slices. Molecular masses were calibrated separately for membrane‐bound and water‐soluble protein complexes (Wittig et al, 2010a). Microsoft Excel and NOVA (Giese et al, 2015) were used for visualization and analysis.
Quantification and statistical analysis
Relative changes in the total abundances of individual proteins were determined based on the sum of the abundances in all slices of the migration profiles or sections thereof. If not indicated otherwise, abundance changes in multiprotein complexes were determined after averaging the profiles of all subunits that were reliably detected by mass spectrometry. For controls and ρ0 cells, four independent complexome profiles each were measured and evaluated using an unpaired Student’s t‐test for individual proteins or two‐way ANOVA with Sidak correction for changes of multiple proteins in a complex using GraphPad Prism version 8.4.3 for Windows (GraphPad Software, San Diego, California USA, www.graphpad.com). Results are presented as mean value ± SD (n = 4). Statistical significance is indicated as follows: *P < 0.05, **P < 0.01, ***P < 0.001, ****P < 0.0001.
Author contributions
SA, UB, and SG‐C designed the study, analyzed, and interpreted the results; SG‐C performed the experiments; JvS performed bioinformatic analyses; SA and UB wrote the paper with contributions from SG‐C; All authors read, corrected, and approved the final version.
Conflict of interest
The authors declare that they have no conflict of interest.
Supporting information
Appendix
Expanded View Figures PDF
Dataset EV1
Dataset EV2
Acknowledgements
This work was supported by TOP project 714.017.004 of the Netherlands Organization for Scientific Research (NWO), by TOP project 91217009 of the Netherlands Organization for Health Research and Development (ZonMw), the Excellence Initiative of the German Federal and State Governments (EXC115, Project 24286296) and Collaborative Research Center 1218 (Project 269925409) of the German Research Foundation (DFG).
The EMBO Journal (2021) 40: e108648.
Contributor Information
Ulrich Brandt, Email: ulrich.brandt@radboudumc.nl.
Susanne Arnold, sarnold2012@googlemail.com.
Data availability
The complexome profiling datasets were deposited in the CEDAR database, accession code CRX32 (www3.cmbi.umcn.nl/cedar/browse/experiments/CRX32; van Strien et al, 2021).
References
- Agrimi G, Russo A, Pierri CL, Palmieri F (2012) The peroxisomal NAD(+) carrier of Arabidopsis thaliana transports coenzyme A and its derivatives. J Bioenerg Biomem 44: 333–340 [DOI] [PubMed] [Google Scholar]
- Amunts A, Brown A, Toots J, Scheres SHW, Ramakrishnan V (2015) Ribosome. The structure of the human mitochondrial ribosome. Science 348: 95–98 [DOI] [PMC free article] [PubMed] [Google Scholar]
- Antonicka H, Lin ZY, Janer A, Aaltonen MJ, Weraarpachai W, Gingras AC, Shoubridge EA (2020) A high‐density human mitochondrial proximity interaction network. Cell Metab 32: 479 [DOI] [PubMed] [Google Scholar]
- Appleby RD, Porteous WK, Hughes G, James AM, Shannon D, Wei YH, Murphy MP (1999) Quantitation and origin of the mitochondrial membrane potential in human cells lacking mitochondrial DNA. Eur J Biochem 262: 108–116 [DOI] [PubMed] [Google Scholar]
- Brenner C, Subramaniam K, Pertuiset C, Pervaiz S (2011) Adenine nucleotide translocase family: four isoforms for apoptosis modulation in cancer. Oncogene 30: 883–895 [DOI] [PubMed] [Google Scholar]
- Bricker DK, Taylor EB, Schell JC, Orsak T, Boutron A, Chen YC, Cox JE, Cardon CM, Van Vranken JG, Dephoure N et al (2012) A mitochondrial pyruvate carrier required for pyruvate uptake in yeast, Drosophila, and humans. Science 337: 96–100 [DOI] [PMC free article] [PubMed] [Google Scholar]
- Buchet K, Godinot C (1998) Functional F1‐ATPase essential in maintaining growth and membrane potential of human mitochondrial DNA‐depleted rho degrees cells. J Biol Chem 273: 22983–22989 [DOI] [PubMed] [Google Scholar]
- Callegari S, Richter F, Chojnacka K, Jans DC, Lorenzi I, Pacheu‐Grau D, Jakobs S, Lenz C, Urlaub H, Dudek J et al (2016) TIM29 is a subunit of the human carrier translocase required for protein transport. FEBS Lett 590: 4147–4158 [DOI] [PMC free article] [PubMed] [Google Scholar]
- Calvo SE, Clauser KR, Mootha VK (2016) MitoCarta2.0: an updated inventory of mammalian mitochondrial proteins. Nucleic Acids Res 44: D1251–1257 [DOI] [PMC free article] [PubMed] [Google Scholar]
- Carrozzo R, Wittig I, Santorelli FM, Bertini E, Hofmann S, Brandt U, Schägger H (2006) Subcomplexes of human ATP synthase mark mitochondrial biosynthesis disorders. Annals Neurol 59: 265–275 [DOI] [PubMed] [Google Scholar]
- Chlystun M, Campanella M, Law AL, Duchen MR, Fatimathas L, Levine TP, Gerke V, Moss SE (2013) Regulation of mitochondrial morphogenesis by annexin A6. PLoS One 8: e53774 [DOI] [PMC free article] [PubMed] [Google Scholar]
- Corona P, Antozzi C, Carrara F, D'Incerti L, Lamantea E, Tiranti V, Zeviani M (2001) Novel mtDNA mutation in the ND5 subunit of complex I in two MELAS patients. Annals Neurol 49: 106–110 [DOI] [PubMed] [Google Scholar]
- Cox J, Mann M (2008) MaxQuant enables high peptide identification rates, individualized p.p.b.‐range mass accuracies and proteome‐wide protein quantification. Nat Biotechnol 26: 1367–1372 [DOI] [PubMed] [Google Scholar]
- Davies KM, Strauss M, Daum B, Kief JH, Osiewacz HD, Rycovska A, Zickermann V, Kühlbrandt W (2011) Macromolecular organization of ATP synthase and complex I in whole mitochondria. Proc Natl Acad Sci USA 108: 14121–14126 [DOI] [PMC free article] [PubMed] [Google Scholar]
- Drew BG, Ribas V, Le JA, Henstridge DC, Phun J, Zhou Z, Soleymani T, Daraei P, Sitz D, Vergnes L et al (2014) HSP72Is a mitochondrial stress sensor critical for parkin action, oxidative metabolism, and insulin sensitivity in skeletal muscle. Diabetes 63: 1488–1505 [DOI] [PMC free article] [PubMed] [Google Scholar]
- Faou P, Hoogenraad NJ (2012) Tom34: A cytosolic cochaperone of the Hsp90/Hsp70 protein complex involved in mitochondrial protein import. Biochim Biophys Acta‐Mol Cell Res 1823: 348–357 [DOI] [PubMed] [Google Scholar]
- Fernández‐Millán P, Lázaro M, Cansız‐Arda Ş, Gerhold JM, Rajala N, Schmitz C‐A, Silva‐Espiña C, Gil D, Bernadó P, Valle M et al (2015) The hexameric structure of the human mitochondrial replicative helicase Twinkle. Nucleic Acids Res 43: 4284–4295 [DOI] [PMC free article] [PubMed] [Google Scholar]
- Fukuyama R, Nakayama A, Nakase T, Toba H, Mukainaka T, Sakaguchi H, Saiwaki T, Wada M, Sakurai H, Fushiki S (2002) A newly established neuronal rho‐0 cell line highly susceptible to oxidative stress accumulates iron and other metals ‐ Relevance to the origin of metal ion deposits in brains with neurodegenerative disorders. J Biol Chem 277: 41455–41462 [DOI] [PubMed] [Google Scholar]
- Giacomello M, Pyakurel A, Glytsou C, Scorrano L (2020) The cell biology of mitochondrial membrane dynamics. Nat Rev Mol Cell Biol 21: 204–224 [DOI] [PubMed] [Google Scholar]
- Giese H, Ackermann J, Heide H, Bleier L, Dröse S, Wittig I, Brandt U, Koch I (2015) NOVA: a software to analyze complexome profiling data. Bioinformatics 31: 440–441 [DOI] [PubMed] [Google Scholar]
- Grimm A, Eckert A (2017) Brain aging and neurodegeneration: from a mitochondrial point of view. J Neurochem 143: 418–431 [DOI] [PMC free article] [PubMed] [Google Scholar]
- Guerrero‐Castillo S, Bärtling F, Kownatzki D, Wessels HJ, Arnold S, Brandt U, Nijtmans L (2017) The assembly pathway of mitochondrial respiratory chain complex I. Cell Metab 25: 128–139 [DOI] [PubMed] [Google Scholar]
- Hao H‐X, Khalimonchuk O, Schraders M, Dephoure N, Bayley J‐P, Kunst H, Devilee P, Cremers CWRJ, Schiffman JD, Bentz BG et al (2009) SDH5, a gene required for flavination of succinate dehydrogenase, is mutated in paraganglioma. Science 325: 1139–1142 [DOI] [PMC free article] [PubMed] [Google Scholar]
- He J, Ford HC, Carroll J, Douglas C, Gonzales E, Ding S, Fearnley IM, Walker JE (2018) Assembly of the membrane domain of ATP synthase in human mitochondria. Proc Natl Acad Sci USA 115: 2988–2993 [DOI] [PMC free article] [PubMed] [Google Scholar]
- Heide H, Bleier L, Steger M, Ackermann J, Dröse S, Schwamb B, Zörnig M, Reichert A, Koch I, Wittig I et al (2012) Complexome profiling identifies TMEM126B as a component of the mitochondrial complex I assembly complex. Cell Metab 16: 538–549 [DOI] [PubMed] [Google Scholar]
- Heublein M, Burguillos MA, Vögtle FN, Teixeira PF, Imhof A, Meisinger C, Ott M (2014) The novel component Kgd4 recruits the E3 subunit to the mitochondrial alpha‐ketoglutarate dehydrogenase. Mol Biol Cell 25: 3342–3349 [DOI] [PMC free article] [PubMed] [Google Scholar]
- de Hoon MJ, Imoto S, Nolan J, Miyano S (2004) Open source clustering software. Bioinformatics 20: 1453–1454 [DOI] [PubMed] [Google Scholar]
- Huynen MA, Mühlmeister M, Gotthardt K, Guerrero‐Castillo S, Brandt U (2016) Evolution and structural organization of the mitochondrial contact site (MICOS) complex and the mitochondrial intermembrane space bridging (MIB) complex. Biochim Biophys Acta‐Mol Cell Res 1863: 91–101 [DOI] [PubMed] [Google Scholar]
- Ishihara N, Fujita Y, Oka T, Mihara K (2006) Regulation of mitochondrial morphology through proteolytic cleavage of OPA1. EMBO J 25: 2966–2977 [DOI] [PMC free article] [PubMed] [Google Scholar]
- Jiang X, Jiang H, Shen ZR, Wang XD (2014) Activation of mitochondrial protease OMA1 by Bax and Bak promotes cytochrome c release during apoptosis. Proc Natl Acad Sci USA 111: 14782–14787 [DOI] [PMC free article] [PubMed] [Google Scholar]
- Kang Y, Stroud DA, Baker MJ, De Souza DP, Frazier AE, Liem M, Tull D, Mathivanan S, McConville MJ, Thorburn DR et al (2017) Sengers syndrome‐associated mitochondrial acylglycerol kinase is a subunit of the human TIM22 protein import complex. Mol Cell 67: 457–470.e455 [DOI] [PubMed] [Google Scholar]
- Kauppila TES, Kauppila JHK, Larsson NG (2017) Mammalian mitochondria and aging: an update. Cell Metab 25: 57–71 [DOI] [PubMed] [Google Scholar]
- King MP, Attardi G (1989) Human cells lacking mtDNA: repopulation with exogenous mitochondria by complementation. Science 246: 500–503 [DOI] [PubMed] [Google Scholar]
- Korhonen JA, Pham XH, Pellegrini M, Falkenberg M (2004) Reconstitution of a minimal mtDNA replisome in vitro. EMBO J 23: 2423–2429 [DOI] [PMC free article] [PubMed] [Google Scholar]
- Kunji ERS, King MS, Ruprecht JJ, Thangaratnarajah C (2020) The SLC25 carrier family: Important transport proteins in mitochondrial physiology and pathology. Physiology 35: 302–327 [DOI] [PMC free article] [PubMed] [Google Scholar]
- van der Laan M, Wiedemann N, Mick DU, Guiard B, Rehling P, Pfanner N (2006) A role for Tim21 in membrane‐potential‐dependent preprotein sorting in mitochondria. Curr Biol 16: 2271–2276 [DOI] [PubMed] [Google Scholar]
- Leung AWC, Varanyuwatana P, Halestrap AP (2008) The mitochondrial phosphate carrier interacts with cyclophilin D and may play a key role in the permeability transition. J Biol Chem 283: 26312–26323 [DOI] [PMC free article] [PubMed] [Google Scholar]
- Link TA, Schägger H, von Jagow G (1986) Analysis of the structures of the subunits of the cytochrome bc1 complex from beef heart mitochondria. FEBS Lett 204: 9–15 [DOI] [PubMed] [Google Scholar]
- Lobo‐Jarne T, Pérez‐Pérez R, Fontanesi F, Timón‐Gómez A, Wittig I, Peñas A, Serrano‐Lorenzo P, García‐Consuegra I, Arenas J, Martín MA et al (2020) Multiple pathways coordinate assembly of human mitochondrial complex IV and stabilization of respiratory supercomplexes. EMBO J 39: e103912 [DOI] [PMC free article] [PubMed] [Google Scholar]
- Luongo TS, Eller JM, Lu M‐J, Niere M, Raith F, Perry C, Bornstein MR, Oliphint P, Wang L, McReynolds MR et al (2020) SLC25A51 is a mammalian mitochondrial NAD(+) transporter. Nature 588: 174–179 [DOI] [PMC free article] [PubMed] [Google Scholar]
- Mokranjac D, Paschen SA, Kozany C, Prokisch H, Hoppins SC, Nargang FE, Neupert W, Hell K (2003a) Tim50, a novel component of the TIM23 preprotein translocase of mitochondria. EMBO J 22: 816–825 [DOI] [PMC free article] [PubMed] [Google Scholar]
- Mokranjac D, Sichting M, Neupert W, Hell K (2003b) Tim14, a novel key component of the import motor of the TIM23 protein translocase of mitochondria. EMBO J 22: 4945–4956 [DOI] [PMC free article] [PubMed] [Google Scholar]
- Na U, Yu WD, Cox J, Bricker DK, Brockmann K, Rutter J, Thummel CS, Winge DR (2014) The LYR factors SDHAF1 and SDHAF3 mediate maturation of the iron‐sulfur subunit of succinate dehydrogenase. Cell Metab 20: 253–266 [DOI] [PMC free article] [PubMed] [Google Scholar]
- Newman LE, Zhou CJ, Mudigonda S, Mattheyses AL, Paradies E, Marobbio CM, Kahn RA (2014) The ARL2 GTPase is required for mitochondrial morphology, motility, and maintenance of ATP levels. PLoS One 9: e99270 [DOI] [PMC free article] [PubMed] [Google Scholar]
- Niemann A, Ruegg M, La Padula V, Schenone A, Suter U (2005) Ganglioside‐induced differentiation associated protein 1 is a regulator of the mitochondrial network: new implications for Charcot‐Marie‐Tooth disease. J Cell Biol 170: 1067–1078 [DOI] [PMC free article] [PubMed] [Google Scholar]
- Olsen JV, de Godoy LMF, Li GQ, Macek B, Mortensen P, Pesch R, Makarov A, Lange O, Horning S, Mann M (2005) Parts per million mass accuracy on an orbitrap mass spectrometer via lock mass injection into a C‐trap. Mol Cell Proteomics 4: 2010–2021 [DOI] [PubMed] [Google Scholar]
- Palenikova P, Harbour ME, Prodi F, Minczuk M, Zeviani M, Ghelli A, Fernandez‐Vizarra E (2021) Duplexing complexome profiling with SILAC to study human respiratory chain assembly defects. Biochim Biophys Acta‐Bioenergetics 1862: 148395 [DOI] [PubMed] [Google Scholar]
- Paradkar PN, Zumbrennen KB, Paw BH, Ward DM, Kaplan J (2009) Regulation of mitochondrial iron import through differential turnover of mitoferrin 1 and mitoferrin 2. Mol Cell Biol 29: 1007–1016 [DOI] [PMC free article] [PubMed] [Google Scholar]
- Pfanner N, van der Laan M, Amati P, Capaldi RA, Caudy AA, Chacinska A, Darshi M, Deckers M, Hoppins S, Icho T et al (2014) Uniform nomenclature for the mitochondrial contact site and cristae organizing system. J Cell Biol 204: 1083–1086 [DOI] [PMC free article] [PubMed] [Google Scholar]
- Rahman J, Rahman S (2018) Mitochondrial medicine in the omics era. Lancet 391: 2560–2574 [DOI] [PubMed] [Google Scholar]
- Richter F, Dennerlein S, Nikolov M, Jans DC, Naumenko N, Aich A, MacVicar T, Linden A, Jakobs S, Urlaub H et al (2019) ROMO1 is a constituent of the human presequence translocase required for YME1L protease import. J Cell Biol 218: 598–614 [DOI] [PMC free article] [PubMed] [Google Scholar]
- Richter‐Dennerlein R, Korwitz A, Haag M, Tatsuta T, Dargazanli S, Baker M, Decker T, Lamkemeyer T, Rugarli EI, Langer T (2014) DNAJC19, a mitochondrial cochaperone associated with cardiomyopathy, forms a complex with prohibitins to regulate cardiolipin remodeling. Cell Metab 20: 158–171 [DOI] [PubMed] [Google Scholar]
- Sasarman F, Brunel‐Guitton C, Antonicka H, Wai T, Shoubridge EA (2010) LRPPRC and SLIRP interact in a ribonucleoprotein complex that regulates posttranscriptional gene expression in mitochondria. Mol Biol Cell 21: 1315–1323 [DOI] [PMC free article] [PubMed] [Google Scholar]
- Schneider HC, Berthold J, Bauer MF, Dietmeier K, Guiard B, Brunner M, Neupert W (1994) Mitochondrial HSP70/MIM44 complex facilitates protein import. Nature 371: 768–774 [DOI] [PubMed] [Google Scholar]
- Schusdziarra C, Blamowska M, Azem A, Hell K (2013) Methylation‐controlled J‐protein MCJ acts in the import of proteins into human mitochondria. Hum Mol Genet 22: 1348–1357 [DOI] [PubMed] [Google Scholar]
- Sharer JD, Shern JF, Van Valkenburgh H, Wallace DC, Kahn RA (2002) ARL2 and BART enter mitochondria and bind the adenine nucleotide transporter. Mol Biol Cell 13: 71–83 [DOI] [PMC free article] [PubMed] [Google Scholar]
- Sheftel AD, Wilbrecht C, Stehling O, Niggemeyer B, Elsasser HP, Mühlenhoff U, Lill R (2012) The human mitochondrial ISCA1, ISCA2, and IBA57 proteins are required for 4Fe‐4S protein maturation. Mol Biol Cell 23: 1157–1166 [DOI] [PMC free article] [PubMed] [Google Scholar]
- Spikes TE, Montgomery MG, Walker JE (2020) Structure of the dimeric ATP synthase from bovine mitochondria. Proc Natl Acad Sci USA 117: 23519–23526 [DOI] [PMC free article] [PubMed] [Google Scholar]
- Spinelli JB, Haigis MC (2018) The multifaceted contributions of mitochondria to cellular metabolism. Nat Cell Biol 20: 745–754 [DOI] [PMC free article] [PubMed] [Google Scholar]
- Tonachini L, Monticone M, Puri C, Tacchetti C, Pinton P, Rizzuto R, Cancedda R, Tavella S, Castagnola P (2004) Chondrocyte protein with a poly‐proline region (CHPPR) is a novel mitochondrial protein and promotes mitochondrial fission. J Cell Physiol 201: 470–482 [DOI] [PubMed] [Google Scholar]
- Tucker EJ, Wanschers BFJ, Szklarczyk R, Mountford HS, Wijeyeratne XW, van den Brand MAM, Leenders AM, Rodenburg RJ, Reljić B, Compton AG et al (2013) Mutations in the UQCC1‐interacting protein, UQCC2, cause human complex III deficiency associated with perturbed cytochrome b protein expression. PLoS Genet 9: e1004034 [DOI] [PMC free article] [PubMed] [Google Scholar]
- Van Strien J, Guerrero‐Castillo S, Chatzispyrou IA, Houtkooper RH, Brandt U, Huynen MA (2019) COmplexome profiling alignment (COPAL) reveals remodeling of mitochondrial protein complexes in Barth syndrome. Bioinformatics 35: 3083–3091 [DOI] [PMC free article] [PubMed] [Google Scholar]
- van Strien J, Haupt A, Schulte U, Braun H‐P, Cabrera‐Orefice A, Choudhary JS, Evers F, Fernandez‐Vizarra E, Guerrero‐Castillo S, Kooij TWA et al (2021) CEDAR, an online resource for the reporting and exploration of complexome profiling data. Biochim Biophys Acta‐Bioenergetics 1862: 148411 [DOI] [PubMed] [Google Scholar]
- Van Vranken JG, Bricker DK, Dephoure N, Gygi SP, Cox JE, Thummel CS, Rutter J (2014) SDHAF4 promotes mitochondrial succinate dehydrogenase activity and prevents neurodegeneration. Cell Metab 20: 241–252 [DOI] [PMC free article] [PubMed] [Google Scholar]
- Vidoni S, Harbour ME, Guerrero‐Castillo S, Signes A, Ding S, Fearnley IM, Taylor RW, Tiranti V, Arnold S, Fernandez‐Vizarra E et al (2017) MR‐1S Interacts with PET100 and PET117 in module‐based assembly of human cytochrome c oxidase. Cell Rep 18: 1727–1738 [DOI] [PubMed] [Google Scholar]
- Vukotic M, Nolte H, König T, Saita S, Ananjew M, Krüger M, Tatsuta T, Langer T (2017) Acylglycerol kinase mutated in Sengers syndrome is a subunit of the TIM22 protein translocase in mitochondria. Mol Cell 67: 471–483 [DOI] [PubMed] [Google Scholar]
- Walczak J, Partyka M, Duszynski J, Szczepanowska J (2017) Implications of mitochondrial network organization in mitochondrial stress signalling in NARP cybrid and Rho0 cells. Sci Rep 7: 14864 [DOI] [PMC free article] [PubMed] [Google Scholar]
- Wiedemann N, Pfanner N (2017) Mitochondrial machineries for protein import and assembly. Ann Rev Biochem Kornberg R.D. (ed.) 86: 685–714 [DOI] [PubMed] [Google Scholar]
- Wittig I, Beckhaus T, Wumaier Z, Karas M, Schägger H (2010a) Mass estimation of native proteins by blue native electrophoresis ‐ principles and practical hints. Mol Cell Proteomics 9: 2149–2161 [DOI] [PMC free article] [PubMed] [Google Scholar]
- Wittig I, Braun HP, Schägger H (2006) Blue native PAGE. Nat Protoc 1: 418–428 [DOI] [PubMed] [Google Scholar]
- Wittig I, Meyer B, Heide H, Steger M, Bleier L, Wumaier Z, Karas M, Schägger H (2010b) Assembly and oligomerization of human ATP synthase lacking mitochondrial subunits a and A6L. Biochim Biophys Acta‐Bioenergetics 1797: 1004–1011 [DOI] [PubMed] [Google Scholar]
- Xie J, Marusich MF, Souda P, Whitelegge J, Capaldi RA (2007) The mitochondrial inner membrane protein mitofilin exists as a complex with SAM50, metaxins 1 and 2, coiled‐coil‐helix coiled‐coil‐helix domain‐containing protein 3 and 6 and DnaJC11. FEBS Lett 581: 3545–3549 [DOI] [PubMed] [Google Scholar]
- Zhou M, Li Q, Wang RX (2016) Current experimental methods for characterizing protein‐protein interactions. ChemMedChem 11: 738–756 [DOI] [PMC free article] [PubMed] [Google Scholar]