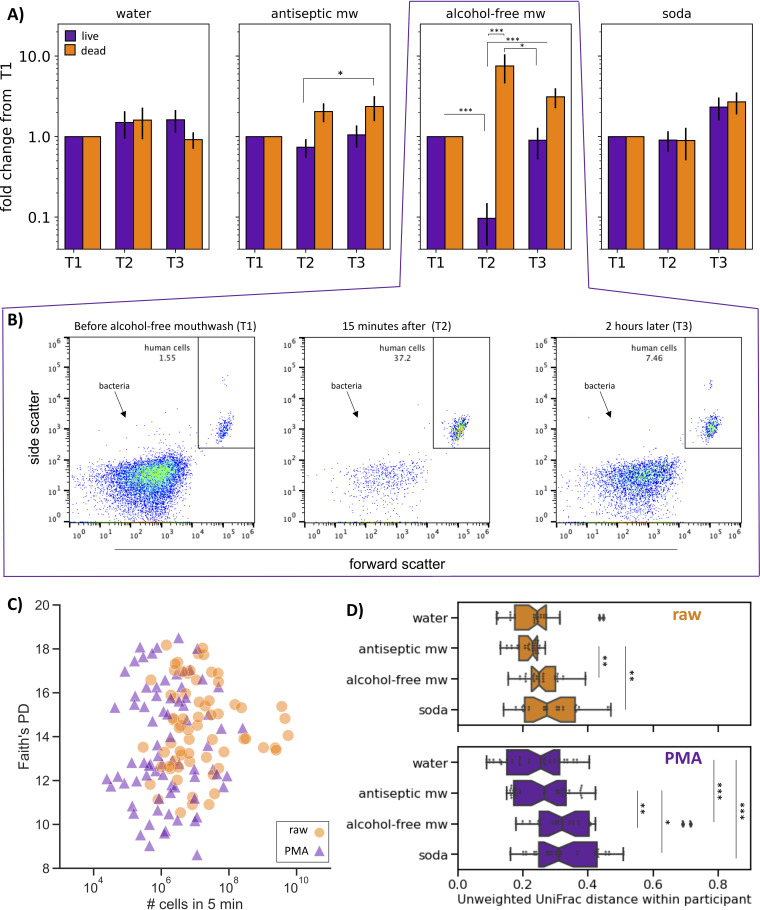
FIG 4.
The effect of acute perturbation on live and dead microbial load and composition. (A) Change in microbial load following treatment over time. The y axis shows percentage of live (purple) and dead (orange) microbial cells detected by flow cytometry normalized per-individual to the first time point (n = 7 per group). Significance represents one-way ANOVA with Tukey’s multiple-comparison test; *, P ≤ 0.05, **, P ≤ 0.01, ***, P ≤ 0.001. (B) Representative flow cytometry scatterplots of PMA-treated samples from a single individual before (T1) immediately after (T2) and 2 hours after (T3) rinsing with alcohol-free mouthwash. (C) Each dot represents a saliva sample processed with (purple) or without (orange) PMA to remove relic DNA (revealing live and total microbial populations, respectively). The y axis is Faith’s phylogenetic diversity rarefied to 10,000 sequences, and the x axis is the number of microbial cells collected in 5-minute unstimulated saliva detected by flow cytometry (Pearson’s correlation coefficient for both live and total populations, P >0.05). (D) Unweighted UniFrac distance on 16S rRNA gene amplicon sequencing data between samples from the same individual over time plotted by treatment group. Overall, the distance among samples treated with PMA (purple, bottom graph) were more dissimilar than the distances between the same samples not treated with PMA (orange, top graph) (bootstrapped Kruskal-Wallis, P ≤ 0.001). In the raw samples, there was no significant difference among the treatment groups (bootstrapped Kruskal-Wallis, P ≥ 0.05). In the PMA-treated samples, participants that swished with alcohol-free mouthwash or drank a soda had significantly greater variation over time than the group that swished with water (bootstrapped Kruskal-Wallis; *, P ≤ 0.05, **, P ≤ 0.01, ***, P ≤ 0.001).

