

Abstract
Due to its effectivity in assessing functional capacity and adding prognostic information to the staging of chronic obstructive pulmonary disease (COPD) patients, the 6-min walk test (6MWT) is extensively used in clinical evaluation. Currently, there is little information about the physiological response this test elicits in patients, especially when compared to cardiopulmonary exercise test (CPET). The aim of the study was to compare ventilatory and metabolic responses between these tests commonly used for the assessment of clinical outcome. A group of 20 patients with moderate to very severe COPD were tested for their pulmonary function (flow-volume curve, static lung volumes), occlusion mouth pressures and breath-by-breath measurement of flow, volumes, and oxygen (O2) and carbon dioxide (CO2) concentration during the 6MWT and CPET. All parameters measured during both exercise tests were assessed over the throughout of the tests and compared between each other at specified time points. Serially measured inspiratory vital capacity (IVC) decreased more rapidly and extensively during the walk-test (p < 0,0001). This was accompanied by a limited increase in tidal volume (VT) and minute ventilation (VE), which were significantly lower in the course of the 6MWT (p = 0,0003 and p = 0,0097, respectively). We also noticed a significant decrease in hemoglobin oxygen saturation (SpO2) during the 6MWT which was correlated to percent decrease in IVC (p = 0,0206). Over the course of the 6MWT, oxygen consumption (VO2) and VT reached plateau within 2 min, while carbon dioxide production (VCO2) and VE within 3 min. During CPET, VO2, VCO2 and VE rose continuously, while VT reached plateau within 4 min. The 6MWT seems to be a rather endurance-based test associated with more pronounced dynamic lung hyperinflation and mechanical constraint of ventilation in comparison to cycling.
Keywords: COPD, Exercise, Ventilatory response, Dynamic hyperinflation, V/Q mismatch
Graphical abstract
Highlights
-
•
Various types of exercise are tolerated differently.
-
•
The 6MWT is, as opposed to ergometry, accompanied by a quicker increase in dynamic lung hyperinflation and desaturation.
-
•
It seems that pedaling, as compared to walking, is the superior way of training movement for rehabilitation purposes.
1. Introduction
A decreased physical activity tolerance and exercise induced dyspnea belong among the main symptoms of patients with advanced forms of chronic obstructive pulmonary disease (COPD) [1]. The predictive value of routinely measured dynamic ventilation parameters, namely forced expiratory volume in 1 s (FEV1) and forced vital capacity (FVC), for dyspnea and exercise tolerance is relatively limited. Both symptoms are greatly defined by the degree of pulmonary hyperinflation, its dynamic change throughout physical exertion, and respiratory muscles function. In routine clinical practice, the degree of both static and dynamic hyperinflation can be estimated by measuring inspiratory capacity (IC) or inspiratory vital capacity (IVC), which have, at least, approximate predictive capability for the determination of exercise limitation [2]. Cardiopulmonary Exercise Testing (CPET), considered as the gold-standard of exercise testing, allows for direct assessment of a number of physiological parameters and thus determine, with considerable accuracy, the limitation of physical exertion induced by pathological states including COPD. This way of testing, however, requires costly hardware and hence its use in routine practice is limited. Therefore, in recent years, the walk-test has become a more popular choice among clinicians aiming to assess physical exertion tolerance. The Six-Minute Walk Test (6MWT) is a simple, standardized test that is easily carried out and utilized in clinical examination of COPD patients, where it holds unique prognostic value [3]. Out of all independently used parameters, the 6MWT is the best predictor of survival in COPD patients. It has also demonstrated the ability to detect an increase in exercise tolerance after various therapeutic interventions [4].
A number of papers comparing physiological responses to physical exertion in both tests has been published to date. CPET and 6MWT have different protocols, 6MWT is a submaximal test, the tempo of which is dictated by the patient, whereas CPET involves an external linear increase of load. It is therefore assumed that each test is accompanied by a different metabolic, ventilatory, and respiratory response [5,6]. In the past, it has been repeatedly observed that COPD patients show a more notable desaturation of blood oxygen during the 6MWT as compared to CPET, which was attributed to a greater disbalance of the ventilation-perfusion ratio (V’/Q’) throughout the walk test [7]. However, it has recently been proven that a higher alveolar partial pressure of oxygen (PAO2) during CPET minimizes desaturation when compared to walking [5]. The authors of the study reference higher stimulation of the pulmonary center during ergometry by both neural mechanisms and an earlier onset of anaerobic metabolism.
Nonetheless, no one has studied the comparison of the changes in dynamics of breathing mechanics during CPET and walking as a plausible cause of the differing ventilatory and respiratory response.
The main goal of this study was to test the hypothesis that the ventilatory response in COPD patients is more profound and with earlier onset within the test constrained in the duration of the 6MWT compared to CPET. The secondary goal was to assess the relationship between the ventilatory response and the level of desaturation in both types of physical exertion and to check whether the more significant decrease in SpO2 during the walk test can be attributed to the differences of ventilatory response.
2. Materials and methods
2.1. Patients
Twenty-two COPD patients were gradually included in the study. The severity of airflow limitation in these patients ranged from moderate to very severe as to cover a broad spectrum of bronchial obstruction and pulmonary hyperinflation. All patients had a history of smoking with a minimum of ten pack-years, participated in the outpatient pulmonary rehabilitation for the duration of at least three months and had an experience with both types of testing. Two patients were excluded, one for back pain which limited his ability to participate, the other for respiratory infection. In total, twenty patients were assessed and their basic demographic information is listed in Table 1. Patients did not show a significant bronchodilatation response to salbutamol (<12% increase FEV1 after 800 μg inhaled salbutamol) and their resting blood saturation, measured with a pulse oximeter (SpO2), was higher than 92%. Patients with a history of asthma, atopy, severe cardiovascular and other diseases which could affect the results of exercise testing were excluded. None of the patients had been using long-term systemic corticosteroids.
Table 1.
Patient demographic data. FEV1: air volume exhaled in 1 s of forcefull expiration, FEV1/IVC – ratio of FEV1 to inspiratory vital capacity, PImax maximal static pressure generated by inspiratory muscles measured in the oral cavity, RV/TLC – ratio of residual volume to total lung capacity, TLCO – pulmonary carbon monoxide transfer factor, 6MWD – distance reached during the 6-min walk-test, SpO2 – hemoglobin oxygen saturation measured with a pulse oximeter.
| Average | SD | Range | |
|---|---|---|---|
| Number | 20 | – | – |
| Age | 64,6 | 3,243 | 51–77 |
| Sex (m/w) | 14/6 | – | – |
| FEV1 (%predicted) | 38,9 | 3,219 | 14–60 |
| FEV1/IVC (%) | 37,6 | 2,975 | 17–57 |
| PImax (%predicted) | 90,8 | 9,341 | 42–164 |
| RV/TLC (%) | 57,6 | 1,826 | 41–71 |
| TLCO (%predicted) | 62,7 | 4,968 | 26–102 |
| 6MWD (meters) | 483,3 | 22,02 | 243–629 |
| SpO2 (%) | 96,7 | 2,1 | 90–98 |
2.2. Study design
The study was approved by the institutional review board and the Ethics committee of the Thomayer hospital and the Institute for clinical and experimental medicine. All patients signed the informed consent form for participation. In two days, patients underwent a clinical assessment and a measurement of pulmonary function followed by the 6WMT and CPET in random order. Microsoft Excel® “randbetween” function was used for determining the order of the exercise tests. During the first visit, patients underwent a clinical assessment, spirometry, including reversibility testing with salbutamol, respiratory muscle assessment, measurement of transfer factor for carbon monoxide (TLCO) and static lung volumes by body plethysmography followed by the first exercise test.
During the second visit, which took place at the same time the following day, patients underwent spirometry, including reversibility testing. Given that the post bronchodilator FEV1 and inspiratory vital capacity values stayed within a 5% variability range, the second exercise test was carried out.
2.3. Pulmonary function assessment
All pulmonary function assessments were carried out at rest in sitting position in accordance with ERS/ATS recommendations [8]. Spirometry was measured using the flow-volume method with a calibrated spirometer ZAN 100 to which a pneumotachograph ZAN flowhandy II (ZAN, Oberthulba, Germany) was connected. The IVC maneuver was carried out after the minimum of a 6-s-long quiet exhalation until reaching the volume plateau and was followed by a maximum deep inhalation. Lung volumes were measured using a constant-volume plethysmograph (MedGraphics, St. Paul, Minnesota) [9]. TLCO was measured by a single-breath method using the ZAN 300 (ZAN, Oberthulba, Germany) [10]. ECCS reference values [11] were used for the assessment of lung volumes and TLCO. Occlusion pressures, P0,1 (pressure measured in the mouth 100 ms after the start of the quiet inhalation) and PImax (pressure in the mouth measured during maximal inhalation effort against closed shutter), were measured simultaneously along the spirograph recording for the assessment breathing pattern using pneumotachograph ZAN flowhandy II with an automatic shutter (ZAN, Oberthulba, Germany). PImax was measured at the residual volume (RV) level for a minimum of three attempts [12], reference values were used according to Black [13]. Pulmonary muscle function was assessed using the noninvasive tension/time index (TTmus), which was calculated using the following formula: TTmus = TI/Ttot x PI/PImax, where TI is the time of the inspiration, Ttot is the duration of the entire breathing cycle, PI = 5 P0,1 x TI. Results were expressed in absolute values and as percentages of reference values [14].
2.4. Exercise testing
The 6MWT was carried out according to standard protocol on a closed 40-m-long hospital hallway. The patients were asked to walk as fast as possible for the 6 min period while the distance covered during the test was recorded [15,16]. The CPET test was carried out on the electrically braked ergometer Ergoline 500 (Ergoline, Bitz, Germany) according to ATS/ACCP statement [17]. After two to 3 min of unloaded pedaling at sixty RPM followed by a continuous increase of resistance (ramp protocol between 10 and 20 Watt per minute) set according to the level of the severity of airflow limitation in order for the test to last about 6 min. In other words, the actual ramp protocol for an individual subject was chosen according to his/her previous exercise test so that he/she reaches maximal performance within 6 min. The steeper ramp protocol was used to achieve a comparable length of the tests to be able to compare parameters directly at specified time points. The average duration of the CPET test was slightly under 6 min, thus the end-test data, used for comparison to 6MWT, was collected before the end (five to 7 min) of the ergometry test. None of the CPET tests ended prematurely and therefore were considered as maximal.
Breathing gas concentrations and airflow were measured continuously during both exercise tests and derived values of tidal volume (VT), minute ventilation (VE), breathing frequency (Bf), oxygen consumption (VO2) and carbon dioxide output (VCO2) were calculated and expressed as 10 s average values. The Oxycon Mobile (CareFusion, California, USA), mobile spiroergometric system was used for measurements, while facilitating wireless data transfer to a hard drive connected to a computer, where the transferred data was analyzed both graphically and numerically.
Heart rate (HR) and hemoglobin oxygen saturation was measured continuously with a fast response pulse oximeter NonIn Onyx 9500 (NonIn, Plymouth, Minnesota, USA). The IVC maneuver was carried out at rest, at the start of physical exertion, and every 2 min afterwards. The IVC maneuver was practiced with patients prior to the exercise test and only considered acceptable when the patient was able to produce a slow 6-s exhale. The IVC maneuver was chosen due to the lack of reproducibility of IC values in some patients. At the end of the test, the level of dyspnea was measured using the visual analog scale (VAS).
2.5. Statistical analysis
We did not perform any sample size calculations, but we enrolled similar numbers of subjects seen in comparable physiologic studies [[5], [6], [7]]. Results are expressed as mean value ± SD. The normality of the distribution of described values was tested by the Kolmogorov-Smirnov test. Parameters, repeatedly measured during both types of physical exertion, namely VT, VE, Bf, VO2, VCO2, and IVC, were respectively analyzed initially using ANOVA for repeated measurements and the comparison of differences between individual measurements was carried out using the Bonferroni test for multiple measurements. The differences between all end-test values of both types of physical exertion were analyzed using a paired t-test. Correlation between resting pulmonary function parameters and all end-test values of both exercise tests was calculated using the Pearson correlation coefficient. P value of p < 0.05 was considered as statistically significant. GraphPad Prism 4, Version 4.00 (GraphPad Software, California, USA) was used for statistical analyses of the data.
3. Results
Twenty COPD patients with a wide range of airflow limitation, lung hyperinflation and severity of emphysema, assessed by TLCO, were evaluated. Their baseline characteristics are listed in Table 1.
3.1. Resting measurements and their relationship to exercise tolerance
Resting pulmonary function tests related differently to walking and cycling as expressed in Table 2. Walking distance during 6MWT varied widely among patients with less differences of peakVO 2. The distance covered during the 6MWT was closely related notably to lung hyperinflation (RV: r = −0.6085, 95%CI -0.8375 to −0.1977, p = 0.0074, RV/TLC: r = −0.7301, 95%CI -0.8927 to −0.3992, p = 0.0006). Only moderate relationship could be seen between distance walked and transfer coefficient for carbon monoxide (KCO: r = 0.4695, 95%CI 0.003189 to 0.7681, p = 0.0493). Peak VO2 achieved at the end of 6MWT related only moderately to lung hyperinflation (RV/TLC r = −0.5436, 95%CI -0.8060 to −0.1027, p = 0.0197), TLCO (r = 0.5463, 95%CI 0.1065 to 0.8073, p = 0.019) and KCO (r = 0.5721, 95%CI 0.1435 to 0.8200, p = 0.0131). Peak VO2 achieved at the end of CPET was moderately related to dynamic ventilatory parameters (FEV1 r = 0.5317, 95%CI 0.08615 to 0.8000, p = 0.0231, FEV1/IVC r = 0.5661, 95%CI 0.1347 to 0.8171, p = 0.0143), lung hyperinflation (RV r = −0.5247, 95%CI -0.7695 to −0.07642, p = 0.0254), TLCO (r = 0.5342, 95%CI 0.08958 to 0.8013, p = 0.0224) and KCO (r = 0.6918, 95%CI 0.3322 to 8758, p = 0.0015). We were not able to find any significant relationship of respiratory muscle function neither to exercise tolerance (Table 2) nor to minute ventilation.
Table 2.
Relationship of resting pulmonary function tests to exercise tolerance. FEV1: air volume exhaled in 1 s of forceful expiration, FEV1/IVC – ratio of FEV1 to inspiratory vital capacity, IVC – inspiratory vital capacity, PImax - maximal static pressure generated by inspiratory muscles measured in the oral cavity, TTmus – non-invasive tension/time index, RV – residual volume, RV/TLC – ratio of residual volume to total lung capacity, TLCO – pulmonary carbon monoxide transfer factor, KCO – pulmonary carbon monoxide transfer coefficient, 6MWD – distance reached during the 6-min walk-test, pVO2 (6MWT) - peak oxygen consumption achieved during the 6-min walk-test, pVO2 (CPET) - peak oxygen consumption achieved during cardiopulmonary exercise test.
| 6MWD | pVO2 (6MWT) | pVO2 (CPET) | |
|---|---|---|---|
| FEV1 | r = 0.4248 P = 0.0789 |
r = 0.2645 P = 0.2889 |
r = 0.5317 P = 0.0231 |
| FEV1/IVC | r = 0,8296 P = 0.2438 |
r = 0.1619 P = 0.5209 |
r = 0.5661 P = 0.0143 |
| IVC | r = 0.3277 P = 0.1843 |
r = 0.1977 P = 0.4315 |
r = 0.1995 P = 0.4273 |
| PImax | r = 0.1663 P = 0.5095 |
r = 0.2298 P = 0.359 |
r = −0.2472 P = 0.3227 |
| TTmus | r = −0.1299 P = 0.6074 |
r = −0.1271 P = 0.6154 |
r = 0.3008 P = 0.2252 |
| RV | r = −0.6085 P = 0.0074 |
r = −0.3469 P = 0.1584 |
r = −0.5247 P = 0.0254 |
| RV/TLC | r = −0.7301 P = 0.0006 |
r = −0.5436 P = 0.0197 |
r = −0.2146 P = 0.3924 |
| TLCO | r = 0.3046 P = 0.2191 |
r = 0.5463 P = 0.019 |
r = 0.5342 P = 0.0224 |
| KCO | r = 0.4695 P = 0.0493 |
r = 0.5721 P = 0.0131 |
r = 0.6918 P = 0.0015 |
3.2. Relationship of ventilation, oxygenation and dyspnea to exercise tolerance
Ventilatory pattern and mechanical constraint of ventilation have moderate to strong relationship to exertion tolerance in both types of exercises (Table 3). Peak VT and peak VE were the most limiting factors for walking as expressed by peak VO2 (peak VT, r = 0.7383, 95%CI 0.4144 to 0.8693, p = 0.0005, peak VE, r = 0.89, 95%CI 0.7238 to 0.9586, p < 0.0001) and to a lesser extent to distance walked during 6MWT. Peak VE was moderately related to peak VO2 at the end of CPET (r = 0.516, 95%CI 0.6464 to 0.7921, p = 0.0284). Peak SpO2 was related moderately only to distance walked during 6MWT (r = 0.5311, 95%CI 0.08533 to 0.7997, p = 0.0233). There was no relationship of dyspnea score assessed by VAS to any type of exercise.
Table 3.
Relationship of ventilation, oxygenation and dyspnea to exercise tolerance. Peak VT: tidal volume achieved at the end of the test, peak VE – minute ventilation achieved at the end of the test, peak IVC – inspiratory vital capacity achieved at the end of the test, IVC fall – percentage change of inspiratory vital capacity between start and end of the test, peak SpO2 – peak oxygen saturation measured by pulse oximetry achieved at the end of the test, SpO2 fall – percentage fall of oxygen saturation between start and end of the test, peak VAS – dyspnea measured by visual analog score at the end of the test, 6MWD – distance reached during the 6-min walk-test, pVO2 (6MWT) - peak oxygen consumption achieved during the 6-min walk-test, pVO2 (CPET) - peak oxygen consumption achieved during cardiopulmonary exercise test.
| 6MWD | pVO2 (6MWT) | pVO2 (CPET) | |
|---|---|---|---|
| peak VT | r = 0.5613 P = 0.0154 |
r = 0.7384 P = 0.0005 |
r = 0.2121 P = 0.3982 |
| peak VE | r = 0.6702 P = 0.0023 |
r = 0.89 P < 0.0001 |
r = 0.516 P = 0.0284 |
| peak IVC | r = 0.5301 P = 0.0236 |
r = 0.6299 P = 0.0051 |
r = 0.1599 P = 0.5264 |
| IVC fall | r = −0.3261 P = 0.1867 |
r = −0.369 P = 0.1318 |
r = −0.4977 P = 0.0356 |
| peak SpO2 | r = 0.5311 P = 0.0233 |
r = 0.3628 P = 0.139 |
r = −0.05423 P = 0.8308 |
| SpO2 fall | r = 0.05596 P = 0.8255 |
r = 0.05471 P = 0.8293 |
r = −0.2899 P = 0.2433 |
| peak VAS | r = −0.2727 P = 0.2735 |
r = −0.02295 P = 0.928 |
r = −0.09006 P = 0.7223 |
3.3. Differences in ventilatory and metabolic responses between walking and cycling
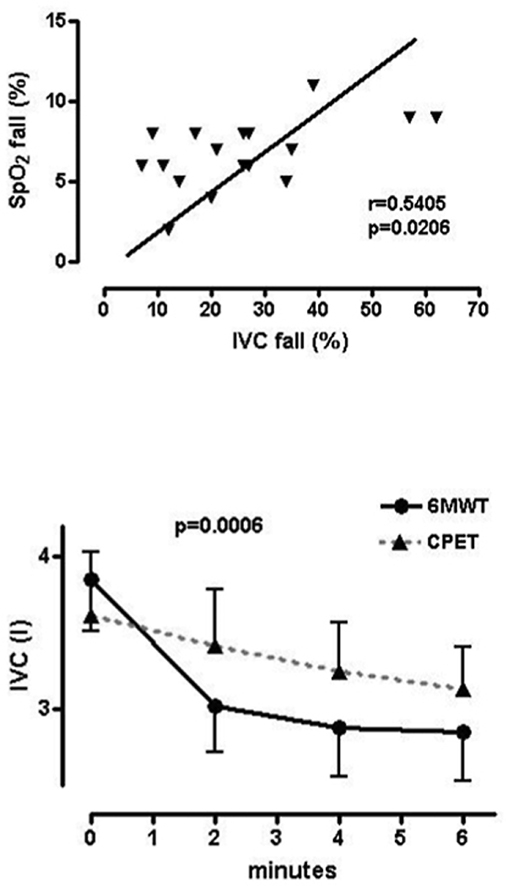
Peak values of primarily tested parameters are shown in Table 4. Patients reached comparable maximum oxygen consumption values during both the 6MWT and CPET (difference 51.22, 95% CI -25.41 to 127.9, p = 0.1765), even though the rise of the VO2 curve followed a different trend in each test. Over the course of ergometry, peakVO2 was reached in the final minute of the test, whereas in 6MWT the second minute brought a VO2 plateau which lasted through to the end of the test. Even though the trend of VCO2 rise remained nearly identical to that of oxygen consumption, peak VCO2 values were significantly lower during the 6MWT (−93.22, 95% CI: −185.5 to −0.9523, p = 0.0479). When related to minute ventilation (VCO2/VE), VCO2 showed no significant difference between the two tests (−0.4050, 95% CI -1.476 to 0.6665, p = 0.4331). Additionally, maximum tidal volume (VT) reached during the 6MWT was significantly lower as compared to CPET (−0.1706, 95%CI: −0.2474 to −0.09383, p = 0.0003). Considering that breathing compensation was not complete, there was a provable difference in maximum minute ventilation between the two tests (−3.825, 95%CI: −6.577 to −1.073, p = 0.0097). Maximal decrease of inspiratory capacity as compared to baseline values before 6MWT and CPET expressed as a percentage was also significantly different and more notable during walking (−12.89, 95%CI: −17.50 to −8.274, p < 0.0001). As compared to CPET the 6MWT showed a significant decrease in blood oxygen saturation (−4.556, 95% CI -5.378 to −3.734, p < 0.0001). Additionally, a close correlation was proven between the change of IVC and SpO2 for the 6MWT, expressed as the percentage change from the beginning of the test (r = 0.5405, 95%CI 0.09835 to 0.8044, p = 0.0206, Fig. 1). Even though comparable peak tidal volume (VT) was reached before the end of both tests, the course of the increase in tidal volume differed. Peak VT was reached in the second minute of the 6MWT, whereas in CPET patients reached maximum at minute four (Fig. 2). Similarly, minute ventilation (VE) showed a linear increase during the ergometry test as opposed to the 6MWT where most increase occurs within the initial 2 min (Fig. 3). Differences among value averages between tests were significant (p = 0.008). In the same manner, albeit in a 2-min interval, the IVC change was assessed in the duration of the physical exertion. The difference in IVC values was not significantly different prior to the start of testing (0.06222, 95%CI: −0.2137 to 0.3382, p = 0.6403). IVC showed a practically linear decrease during ergometry, whereas 6MWT exhibited the most significant decrease in the second minute of the test showing little change after (Fig. 4). IVC value averages were significantly different between exercise tests (p = 0.0006).
Table 4.
Parameters measured at the end of the tests. 6MWT: 6-min walk-test, CPET: cardiopulmonary exercise test, TFmax: maximal heart rate, peak VO2: peak oxygen consumption, RER: peak ratio of VCO2/VO2, O2pulse: peak oxygen consumption in relation to heart rate, peak VE: peak minute ventilation, peak VT: peak tidal volume, peak VE/VO2: peak minute ventilation in relation to oxygen consumption, peak VE/VCO2: peak minute ventilation in relation to carbon dioxide output, SpO2 fall: percentage change in blood oxygen saturation between start and end of exercise, peak VAS: peak visual analog dyspnea score.
| CPET | 6MWT | p-value | |
|---|---|---|---|
| Length of exertion (minutes) | 5,84 ± 0,36 | 6,0 | P = 0,1945 |
| TFmax (pulse/minute) | 129 ± 2135 | 125 ± 1976 | P = 0,3252 |
| peakVO2 (ml/min) | 1006 ± 66,54 | 1058 ± 64,4 | P = 0,1765 |
| peakVO2/kg (ml/kg/min) | 14,2 ± 0,5699 | 15,1 ± 0,6178 | P = 0,1387 |
| RER | 1,1 ± 0,02409 | 0,92 ± 0,01681 | P < 0,0001 |
| O2pulse/kg (ml/pulse/kg) | 0,1171 ± 0,005 | 0,1206 ± 0,005 | P = 0,1197 |
| peak VT (ml) | 1446 ± 0,1007 | 1275 ± 0,09563 | P = 0,0003 |
| peak VE (l/min) | 38,58 ± 10,99 | 34,33 ± 9,18 | P = 0,0097 |
| peak VE/VO2 | 36,93 ± 0,7512 | 32,36 ± 1272 | P = 0,0006 |
| peak VE/VCO2 | 34,49 ± 0,6572 | 35,87 ± 1046 | P = 0,0908 |
| SpO2 fall (%) | 2,2 ± 0,3084 | 6,8 ± 0,4888 | P < 0,0001 |
| peak VAS (cm) | 6,39 ± 1,75 | 6,78 ± 2,05 | P = 0,8410 |
Fig. 1.

Relationship of percentage decrease of SpO2 to the percentage decrease of IVC, (Pearson correlation coefficient, r = 0.5405, p = 0.0206), SpO2 fall – percentage change of blood oxygen saturation between the start and end of 6MWT, IVC fall – percentage change of inspiratory vital capacity between the start and end of 6MWT
Fig. 2.

Comparison of VT changes during 6MWT and CPET (ANOVA for repeated measurements, p = 0.004), VT – tidal volume.
Fig. 3.

Comparison of VE changes during 6MWT and CPET (ANOVA for repeated measurements, p = 0.008), VE – minute ventilation.
Fig. 4.

Comparison of IVC changes during walking and cycling (ANOVA for repeated measurements, p = 0,0006).
4. Discussion
The results of the study confirm that various types of physical exertion affect tolerance in different ways in patients with COPD. Ventilatory and metabolic parameters change at a faster pace during 6MWT where they soon reach maximum values and then plateau for the rest of the test. Per the authors’ knowledge, this is the first study to evaluate the dynamic changes of respiratory mechanics in repeated intervals throughout exercise and thus shows that the 6MWT is accompanied by greater dynamic hyperinflation and, therefore, more significant limitation of respiratory volume and minute ventilation.
Changes in operating lung volumes proved to be the major cause of exercise limitation in COPD patients. Loss of lung elastic recoil pressure leads to premature closure of peripheral airways during exhalation with increasing ventilatory demand, typically over the course of various physical activities. Incomplete emptying of the lungs causes dynamic increase of lung hyperinflation which can be easily measured during an exercise test by repeated inspiratory maneuvers. As a result, end-expiratory lung volume rises progressively throughout exertion and ventilation takes place on the higher portion of the static pressure-volume curve of the respiratory system, where more pressure/energy is needed for any change of lung volume. Furthermore, the inspiration is constrained by a fixed level of total lung capacity [18]. Increased demand on respiratory muscle work is not accompanied by appropriate change in lung volume and neuromechanical dissociation occurs. Although neuromechanical dissociation correlates closely to perception of dyspnea, other factors may play a role, such as heart overload due to exercise induced pulmonary hypertension and peripheral muscles dysfunction [19].
4.1. Resting measurements and their relationship to exercise tolerance
The study showed that exercise tolerance cannot be easily predicted from resting pulmonary function tests, because it is largely dependent on the type of physical activity. Walking and cycling are both dependent on the lung hyperinflation, but the first one to a greater extent. On the other hand, peakVO2 achieved during CPET was notably related to dynamic lung volumes, mainly to FEV1/IVC ratio, and TLCO and KCO. The dependence of distance walked during 6MWT on lung hyperinflation is not surprising and was repeatedly described, although the relationship appears to wane when walking is expressed by peakVO2. The authors did not find any relationship of physical performance in any type of exercise and respiratory muscle function, which was previously shown to be mainly caused by the degree of lung hyperinflation [20]. The loss of such prediction is probably caused by pulmonary rehabilitation in which all subjects were involved. This could be supported by the fact that PImax values were within normal limits in most of the subjects.
4.2. Relationship of ventilation, oxygenation and dyspnea to exercise tolerance
The physical performance during both tests was related mainly to minute ventilation, while VT was closely related only to walking. Such effect could be explained by reaching mechanical constraint of VT much faster during walking associated with inability to effectively compensate VE by breathing frequency. Dynamic mechanical constraint over the course physical exertion typically depends on ventilatory demand and lung elastic recoil pressure. With increasing the first and loss of the second lung hyperinflation rises enormously, explaining greater mechanical constraint during walking where subjects are exposed to higher ventilatory demand from the very beginning of the test. More pronounced mechanical constraint leads to less efficient ventilation with accompanying hypoxemia. Compared to cycling, more pronounced exercise induced hypoxemia during walking was repeatedly described in recent literature. On the other hand, cycling seems to be accompanied by hypoxemia only in subjects with resting expiratory tidal flow limitation, as measured by negative expiratory pressure (NEP) method [21]. Therefore, 6MWT seems to better reflect usual physical activities of COPD patients and is more useful in predicting limitations of daily living and quality of life [22,23].
4.3. Differences in ventilatory and metabolic responses between walking and cycling
The study proved that VO2 reaches a plateau in the second minute of the walk test, which indicates that constant VO2 is a specific attribute of this test in most patients suffering from COPD of various severity, who are able to finish the 6MWT without interruption. The comparison between the 6MWT and ergometry showed the accomplishment of a virtually identical peak oxygen consumption. This leads us to believe that the 6MWT creates high, if not maximal, metabolic requirements. VO2, as opposed to ergometry, is affected by a larger amount of muscle mass that is used during the walk test [5]. That is why VO2 is, as related to the amount of working muscle mass throughout walking at relatively constant speed, lower [6,24]. Current research, in agreement with our findings, suggests that the walk test is, as compared to ergometry, accompanied by lower carbon dioxide output as well as lower minute ventilation values. Previous studies explained VCO2 limitations by lower values of arterial blood lactate during lighter muscular work over the course of the walk test [25]. This argument is supported by a lower ratio between the output of carbon dioxide to oxygen consumption (RER). RER does not reach 1,0 values during the walk test, which indirectly implies the absence of lactate acidosis and thus its ventilatory compensation [6]. On the other hand, the decrease in carbon dioxide output is directly proportional to the level of minute ventilation. The results of this study show that VE is, however, as opposed to ergometry, more limited by dynamic hyperinflation during the 6MWT. It is, therefore, reasonable to infer, that the limitation of VE leads to limitation of walking, where, as compared to ergometry, there is more muscle mass involved in motion with lower metabolic cost, e.g. under anaerobic threshold level.
Previously, it has been proven that repeated IC measurements during exercise testing allow for noninvasive respiratory mechanics evaluation (without the use of an esophagus probe for esophagus pressure measurements) and the assessment of operational ventilatory parameters [26]. Considering that the maximum values of esophagus pressure (Peosmax) during repeated IC maneuvers do not change, it is possible to repeatedly evaluate these measurements in the duration of physical exertion [27,28]. In congruence with other studies, the incremental ergometer test was accompanied by a rise in VE in most patients [5]. VT, however, rose only up to the fourth minute of the test during ergometry and further rise of VE was caused by compensatory increase of breathing frequency which was not adequate to the desired rise of VE. As opposed to ergometry, VE rose up to minute three in the 6MWT. The increase of breathing frequency was not able to compensate the limitation of VT for longer than 1 min following its plateau at minute two. In the duration of both tests a limitation of VT increase occurs, even though it reaches plateau significantly earlier in the 6MWT as opposed to ergometry. The limitation of VT increase is also reflected in significantly larger limitation of minute ventilation during the 6MWT. Even though the difference in minute ventilation between the tests was previously explained by the lower level of lactate in arterial blood and a lower VCO2, respiratory mechanics pathology seems the more pertinent reason.
IVC levels show significant differences during maximum change measurements in the final minute of each test, where the 6MWT is accompanied by a more notable decrease in IVC and therefore increase in RV compared to ergometry. The difference between maximum changes in IVC signifies the evolution of a more apparent dynamic pulmonary hyperinflation during the 6MWT compared to ergometry. The comparison of ventilatory parameters showed that the onset of changes in VT and VE comes relatively early following the beginning of the walk test but their magnitude is smaller compared to ergometry. Similar dynamics were recorded for repeatedly measured IVC as well, which decreases more rapidly during the 6MWT and reaches a more significant maximum change. It can hence be inferred that a more restricted increase in VT and VE throughout the 6MWT is caused by the significant increase in dynamic hyperinflation, which is greater than in the case of ergometry. Based on the aforementioned, we conclude that higher VE demand during 6MWT leads to greater effort during expiration which results in a significant shift in equal pressure point (EPP) in the direction of inspiration. This is likely the cause of the earlier small airways collapse during expiration and a significant increase in RV.
There was no significant difference observed in blood oxygen saturation throughout ergometry, whereas the 6MWT caused a noteworthy impediment to oxygenation [29]. The difference in maximum SpO2 decrease was more than significant between the two tests [30]. A notable blood oxygen saturation disorder has been repeatedly proven and explained by a significant disorder of ventilation/perfusion mismatch during the 6MWT [5]. A higher value of the ventilatory CO2 equivalent at the end of the 6MWT in our group of patients supports this hypothesis and the relationship between maximum IVC change and the decrease of SpO2, shows the rapid increase of RV is the likely mechanism behind.
Myriad previous publications claim that exertional dyspnoea, which is, in congruence to this study, cited as the main reason for ergometry cessation, is in close relation to static ventilatory parameters [31]. The variability of exertional dyspnea sensation during both exercise tests was notable in our study, which explains the absence of correlation of dyspnea, evaluated by VAS, with ventilatory and metabolic parameters. The average values of VAS, however, did not differ significantly between the two tests.
4.4. Limitations of the study
There are some limitations to the present study. First, the limited number of subjects probably caused our inability to prove a relationship between resting pulmonary functions and exercise tolerance. All subjects have been participating in outpatient pulmonary rehabilitation programs for at least three months that can influence respiratory muscle performance and adaptation to physical stress. This is supported by the finding that the majority of the enrolled subjects have PImax within normal limits. We formerly proved the association of maximal strength of inspiratory muscles to distance walked during 6MWT and lung hyperinflation in the slightly more numerous population of COPD patients entering pulmonary rehabilitation programs [20].
Another important limitation concerns the choice of ramp protocols for CPET which was aimed to cover as close as possible to 6 min for direct comparisons of the changes of measured parameters in specific time points during both tests. Repeated CPET could improve our time estimate but at the cost of increased difficulty of the study. Therefore, the last measurements during CPET were done between approximately fifth and sixth minutes which could lead to bias in comparison of peak values. We believe these possible differences are minor and without affecting the results of our study.
The results of the study offered a few fundamental findings:
-
1.
Physical exercise tolerance is significantly impeded in COPD patients, while various types of exercise are tolerated differently. The main limitation of both exercise tests remains the impossibility to raise VT (and therefore VE) in response to increase ventilatory drive accompanying exertion.
-
2.
The 6MWT is, as opposed to ergometry, accompanied by a quicker increase in dynamic pulmonary hyperinflation, which is responsible for a significant oxygenation disorder. Thus, it reflects the ability of everyday physical activity tolerance more suitably than other tests.
-
3.
Per our data, it can be concluded that pedaling, as compared to walking, is the superior way of training movement for rehabilitation purposes.
CRediT authorship contribution statement
Jan Chlumský: Writing – original draft, Data curation, Funding acquisition, Formal analysis, was involved in writing the protocol, performing study procedures, acquiring data, analyzing data, interpretation of the results, writing initial version of the article. Ondřej Zindr: Formal analysis, Data curation, Writing – original draft, Writing – review & editing, was involved in analyzing data and interpretation of the results, re-writing the article, language corrections.
Declaration of competing interest
The authors declare that they have no known competing financial interests or personal relationships that could have appeared to influence the work reported in this paper.
Acknowledgements
The authors would like to thank the staff of pulmonary function lab of Thomayer University hospital for their help.
Footnotes
This study was supported by Internal Grant Agency of Ministry of Health, Czech Republic, grant number NR 7767/3-2004.
References
- 1.Singh D., Agusti A., Anzueto A. Global strategy for the diagnosis, management, and prevention of chronic obstructive lung disease: the GOLD science committee report 2019. Eur. Respir. J. 2019;53(5):1900164. doi: 10.1183/13993003.00164-2019. [DOI] [PubMed] [Google Scholar]
- 2.O’Donnell D.E., Lam M., Webb K. Measurement of symptoms, lung hyperinflation, and endurance during exercise in chronic obstructive pulmonary disease. Am. J. Respir. Crit. Care Med. 1998;158:1557–1565. doi: 10.1164/ajrccm.158.5.9804004. [DOI] [PubMed] [Google Scholar]
- 3.Pinto-Plata V.M., Cote C., Cabral H., Taylor J., Celli B.R. The 6-min walk distance: change over time and value as a predictor of survival in severe COPD. Eur. Respir. J. 2004;23(1):28–33. doi: 10.1183/09031936.03.00034603. [DOI] [PubMed] [Google Scholar]
- 4.Hopkinson N.S., Toma T.P., Hansell D.M. Effect of bronchoscopic lung volume reduction on dynamic hyperinflation and exercise in emphysema. Am. J. Respir. Crit. Care Med. 2005;171(5):453–460. doi: 10.1164/rccm.200407-961OC. [DOI] [PubMed] [Google Scholar]
- 5.Palange P., Forte S., Onorati P., Manfredi F., Serra P., Carlone S. Ventilatory and metabolic adaptations to walking and cycling in patients with COPD. J. Appl. Physiol. 2000;88(5):1715–1720. doi: 10.1152/jappl.2000.88.5.1715. [DOI] [PubMed] [Google Scholar]
- 6.Troosters T., Vilaro J., Rabinovich R. Physiological responses to the 6-min walk test in patients with chronic obstructive pulmonary disease. Eur. Respir. J. 2002;20(3):564–569. doi: 10.1183/09031936.02.02092001. [DOI] [PubMed] [Google Scholar]
- 7.Turner S.E., Eastwood P.R., Cecins N.M., Hillman D.R., Jenkins S.C. Physiologic responses to incremental and self-paced exercise in COPD: a comparison of three tests. Chest. 2004;126(3):766–773. doi: 10.1378/chest.126.3.766. [DOI] [PubMed] [Google Scholar]
- 8.Miller M.R., Hankinson J., Brusasco V. Standardisation of spirometry. Eur. Respir. J. 2005;26(2):319–338. doi: 10.1183/09031936.05.00034805. [DOI] [PubMed] [Google Scholar]
- 9.Wanger J., Clausen J.L., Coates a. Standardisation of the measurement of lung volumes. Eur Respir J Off J Eur Soc Clin Respir Physiol. 2005;26(3):511–522. doi: 10.1183/09031936.05.00035005. [DOI] [PubMed] [Google Scholar]
- 10.Macintyre N., Crapo R.O., Viegi G. Standardisation of the single-breath determination of carbon monoxide uptake in the lung. Eur Respir J Off J Eur Soc Clin Respir Physiol. 2005;26(4):720–735. doi: 10.1183/09031936.05.00034905. [DOI] [PubMed] [Google Scholar]
- 11.Quanjer P.H., Tammeling G.J., Cotes J.E., Pedersen O.F., Peslin R., Yernault J.-C. Lung volumes and forced ventilaroty flows. Eur. Respir. J. 1993;6(Suppl.16):5–14. doi: 10.1183/09041950.005s1693. [DOI] [PubMed] [Google Scholar]
- 12.Gibson G.J., Whitelaw W., Siafakas N. ATS/ERS statement on respiratory muscle testing. Am. J. Respir. Crit. Care Med. 2002;166(4):518–624. doi: 10.1164/rccm.166.4.518. [DOI] [PubMed] [Google Scholar]
- 13.Black L.F., Hyatt R.E. Maximal respiratory pressures: normal values and relationship to age and sex. Am. Rev. Respir. Dis. 1969;99(5):696–702. doi: 10.1164/arrd.1969.99.5.696. [DOI] [PubMed] [Google Scholar]
- 14.Hayot M., Ramonatxo M., Matecki S., Milic-Emili J., Prefaut C. Noninvasive assessment of inspiratory muscle function during exercise. Am. J. Respir. Crit. Care Med. 2000;162(6):2201–2207. doi: 10.1164/ajrccm.162.6.9912053. [DOI] [PubMed] [Google Scholar]
- 15.Enright P.L. The six-minute walk test. Respir. Care. 2003;48(8):783–785. [PubMed] [Google Scholar]
- 16.Holland a. E., Spruit M.a., Troosters T. An official European Respiratory Society/American Thoracic Society Technical Standard: field walking tests in chronic respiratory disease. Eur. Respir. J. 2014;44(6):1428–1446. doi: 10.1183/09031936.00150314. [DOI] [PubMed] [Google Scholar]
- 17.Weisman I.M., Marciniuk D., Martinez F.J. ATS/ACCP Statement on cardiopulmonary exercise testing. Am. J. Respir. Crit. Care Med. 2003;167(2):211–277. doi: 10.1164/rccm.167.2.211. [DOI] [PubMed] [Google Scholar]
- 18.O’Donnell D.E., Elbehairy A.F., Faisal A., Webb K.A., Neder J.A., Mahler D.A. Exertional dyspnoea in COPD: the clinical utility of cardiopulmonary exercise testing. Eur. Respir. Rev. 2016;25(141):333–347. doi: 10.1183/16000617.0054-2016. [DOI] [PMC free article] [PubMed] [Google Scholar]
- 19.Calverley PM a. Exercise and dyspnoea in COPD. Eur. Respir. Rev. 2006;15(100):72–79. [Google Scholar]
- 20.Chlumsky J., Filipova P., Terl M. Non-invasive assessment of respiratory muscle function and its relationship to exercise tolerance in patients with chronic obstructive pulmonary disease. J. Int. Med. Res. 2006;34:240–246. doi: 10.1177/147323000603400302. [DOI] [PubMed] [Google Scholar]
- 21.Díaz O., Villafranca C., Ghezzo H. Breathing pattern and gas exchange at peak exercise in COPD patients with and without tidal flow limitation at rest. Eur. Respir. J. 2001;17(6):1120–1127. doi: 10.1183/09031936.01.00057801. [DOI] [PubMed] [Google Scholar]
- 22.Kortianou E.A., Aliverti A., Louvaris Z. Limitation in tidal volume expansion partially determines the intensity of physical activity in COPD. J. Appl. Physiol. 2015;118:107–114. doi: 10.1152/japplphysiol.00301.2014. [DOI] [PubMed] [Google Scholar]
- 23.Garcia-Rio F., Lores V., Mediano O. Daily physical activity in patients with chronic obstructive pulmonary disease is mainly associated with dynamic hyperinflation. Am. J. Respir. Crit. Care Med. 2009;180(6):506–512. doi: 10.1164/rccm.200812-1873OC. [DOI] [PubMed] [Google Scholar]
- 24.Miles D., Critz J., Knowlton R. Cardiovascular, metabolic, and ventilatory responses of women to equivalent cycle ergometer and treadmill exercise. Med. Sci. Sports Exerc. 1980;12(1):14–19. [PubMed] [Google Scholar]
- 25.Baarends E.M., Schols A.M.W.J., Mostert R., Janssen P.P., Wouters E.F.M. Analysis of the metabolic and ventilatory response to self-paced 12-minute treadmill walking in patients with severe chronic obstructive pulmonary disease. J Cardiopulm Rehabil. 1998;18(1):23–31. doi: 10.1097/00008483-199801000-00003. [DOI] [PubMed] [Google Scholar]
- 26.O’Donnell D.E., Revill S.M., Webb K a. Dynamic hyperinflation and exercise intolerance in chronic obstructive pulmonary disease. Am. J. Respir. Crit. Care Med. 2001;164(5):770–777. doi: 10.1164/ajrccm.164.5.2012122. [DOI] [PubMed] [Google Scholar]
- 27.Yan S., Kaminski D., Sliwinski P. Reliability of inspiratory capacity for estimating end-expiratory lung volume changes during exercise in. Am. J. Respir. Crit. Care Med. 1997;156:55–59. doi: 10.1164/ajrccm.156.1.9608113. [DOI] [PubMed] [Google Scholar]
- 28.Johnson B.D. Emerging concepts in the evaluation of ventilatory limitation during exercise: the exercise tidal flow-volume loop. Chest. 1999;116(2):488. doi: 10.1378/chest.116.2.488. [DOI] [PubMed] [Google Scholar]
- 29.Mak V.H., Bugler J.R., Roberts C.M., Spiro S.G. Effect of arterial oxygen desaturation on six minute walk distance, perceived effort, and perceived breathlessness in patients with airflow limitation. Thorax. 1993;48(1):33–38. doi: 10.1136/thx.48.1.33. [DOI] [PMC free article] [PubMed] [Google Scholar]
- 30.Poulain M., Durand F., Palomba B. 6-Minute walk testing is more sensitive than maximal incremental cycle testing for detecting oxygen desaturation in patients with COPD. Chest. 2003;123(5):1401–1407. doi: 10.1378/chest.123.5.1401. [DOI] [PubMed] [Google Scholar]
- 31.Marin J.M., Carrizo S.J., Gascon M., Sanchez A., Gallego B., Celli B.R. Inspiratory capacity, dynamic hyperinflation, breathlessness, and exercise performance during the 6-minute-walk test in chronic obstructive pulmonary disease. Am. J. Respir. Crit. Care Med. 2001;163(6):1395–1399. doi: 10.1164/ajrccm.163.6.2003172. [DOI] [PubMed] [Google Scholar]