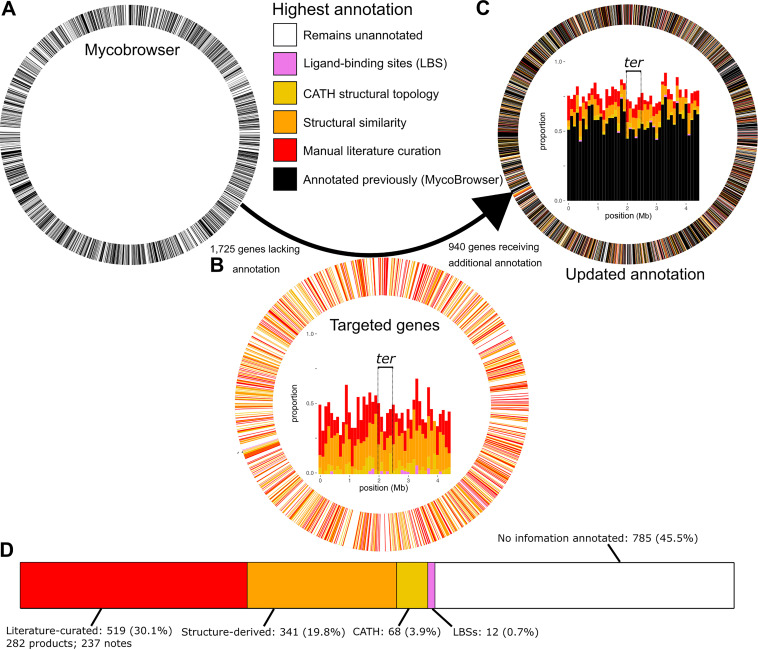
FIG 5.
An updated H37Rv functional annotation. (A to C) Circos plots illustrating annotation coverage prior to the annotation effort (left) and following it (right), colored according to annotation status. In plots A and C, all 4,031 CDS are represented as segments of equal width whereas plot B segments the ring into only the 1,725 underannotated genes. Black genes reflect what was on TubercuList, are considered “annotated,” and are mutually exclusive from the 1,725 underannotated genes (white). Panel B shows only the 1,725 underannotated genes, whereas panels A and C include all 4,031 original CDS. Inside the Circos rings are stacked bar charts with genes in 100-kb bins according to gene start position. The terminal-proximal (±250-kb) region is marked with dashed lines and labeled (ter). (D) Cumulative number of genes annotated, by annotation type. LBS, ligand binding site. Percentages refer to underannotated genes annotated/1,725 initial underannotated genes. Genes are binned into mutually exclusive categories hierarchically: manually curated product name > structure-derived > literature notes > CATH > LBS. Manually curated and literature note categories are combined as “Literature-curated” in the visualization. For the purposes of these counts, functional notes from publications implicating many proteins but not clearly establishing function were not counted (e.g., references 32, 103, and 125).

