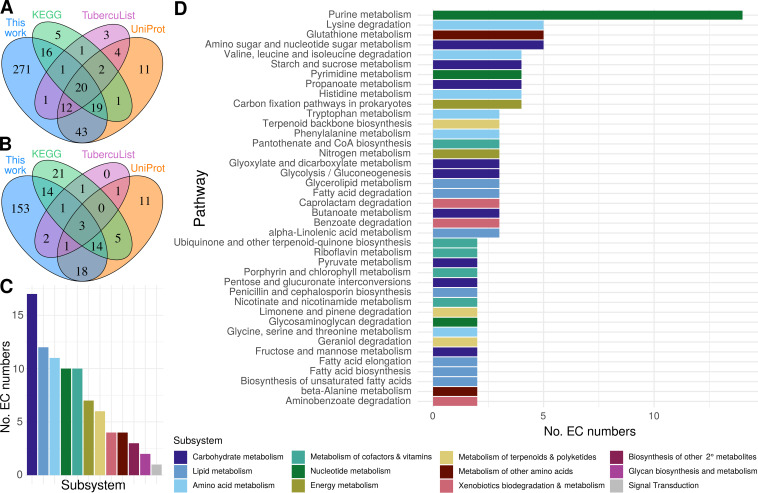
FIG 6.
Functional annotations across M. tuberculosis metabolism. Annotated EC numbers for manually curated and structure-inferred products were compared with annotations for each underannotated gene in popular databases. (A) Set analysis of underannotated genes (UAG) with an EC number assigned in this study compared to popular databases. (B) Novelty of EC numbers for UAG annotated in this study with respect to popular databases. (C and D) Distribution of EC numbers annotated across KEGG subsystems (C) and pathways (D). Generic KEGG subsystems are depicted. All pathways with at least three genes have the number of EC numbers displayed. For subsystems with no pathways with three or more genes, the highest total pathway is displayed.

