

Abstract
Drawing on life course theory and research, we explored how socioeconomic circumstances during childhood and adulthood shape self-reported health trajectories among older Mexican adults. We used data from the Mexican Health and Aging Study panel survey (2001–2015) and used sequence analysis to estimate types of self-reported health trajectories in older adulthood. We then explored the association between those health trajectories and socioeconomic determinants at different life stages, including education, occupation, employment, economic status, parental education, and adverse living conditions and illnesses during childhood. Our contributions are threefold. First, we identified four types of health trajectories for men and eight for women, representing a more nuanced longitudinal health status profile than previously shown. Second, we found that childhood and adult socioeconomic circumstances influence self-reported health trajectories at older age. Third, our results suggest there is no simple monotonic relationship between life course circumstances and self-reported health trajectories.
Keywords: Health trajectories, aging, life course, socioeconomic position, vulnerability, Mexico
1. Introduction
The relationship between health and socioeconomic position has been the subject of a great deal of research during the last decades. There is consensus that individuals with disadvantaged socioeconomic position (SEP) (Galobardes, Shaw, Lawlor, Lynch, & Smith, 2006; Krieger, Williams, & Moss, 1997), such as those living in poverty or deprivation, are more likely to have poor health and are at higher risk of disease than their peers with higher SEP (Brunner, 1997; Deaton, 2013; Marmot, 2005; Stringhini, et al., 2017). Despite the overwhelming amount of research pointing out social health inequalities, how health and socioeconomic position relate remains poorly understood, partially because most research has examined this association as a static phenomenon using a cross-sectional approach, considering a single point in time (Deaton, 2013). However, neither SEP nor health are stable phenomena throughout life.
Lives are ongoing processes and not just single states or events that can be adequately described using snapshots (Levy, et al., 2005). For example, an individual can change her SEP throughout life due to childhood experiences, education attainments, or working opportunities, among other events. Likewise, health trajectories follow dynamic variations, with individuals experiencing periods of health, sickness, or disability throughout time. These changes occur due to biological factors such as aging, illnesses, and genes, and contextual factors such as retirement age, ethnicity, gender, behavior, environment, and economic status (Aisenbrey & Fasang, 2010; Bernardi, Huinink, & Settersten Jr, 2019; Ferraro, Farmer, & Wybraniec, 1997; Haas, 2008; Kuh, Ben-Shlomo, Lynch, Hallqvist, & Power, 2003; McDonough & Berglund, 2003; Sacker, Clarke, Wiggins, & Bartley, 2005; Settersten, 2003). Socioeconomic position and health should not be understood as single events but as longitudinal phenomena. The dynamic interrelationship between health trajectories and socioeconomic at different life stages can help us better understand the underlying mechanisms of social health inequalities.
Thus, a life-course perspective allows a more dynamic and nuanced understanding of the association between SEP and health by modeling exposure to socioeconomic factors throughout the life-course and its effects on the health trajectories of older adults (van der Linden, et al., 2019; van der Linden, et al., 2018; World Health Organization, 2000; Yu, 2006). The life-course theory uses two main approaches to study how changing SEP over the life-course affects an individual’s health. First, the critical periods approach posits that adverse events related to SEP, such as undernutrition or exposure to pollution, during critical life periods (e.g., early childhood) may alter an individual’s health trajectory or illness risk over the life course. Second, the cumulative model approach underscores the length and intensity of exposure to adverse events as having long-term effects on health status through the accumulation of relative advantages and disadvantages over specific domains, such as education or labor, that may affect health (Cunningham, et al., 2018; Dannefer, 2003; Madero-Cabib, Azar, & Pérez-Cruz, 2019; Singh-Manoux, Marmot, & Adler, 2005). The number, duration, and severity of exposures to adverse events across different periods of life may reduce or even eliminate the reversibility of their negative health effects.
Research in high-income countries suggests that SEP gradients are associated with health status (Case & Deaton, 2005; Deaton & Paxson, 2001). This association persists into old age for a broad range of health measures, such as mortality (Demakakos, Biddulph, Bobak, & Marmot, 2016; Marmot & Shipley, 1996; Mortensen, et al., 2016) and self-reported health (Hu, et al., 2016; Huisman, Kunst, & Mackenbach, 2003; Semyonov, Lewin-Epstein, & Maskileyson, 2013; van Kippersluis, O’Donnell, van Doorslaer, & Van Ourti, 2010). Mortality is the most commonly used outcome to measure the relationship between SEP inequalities and health (Lobmayer & Wilkinson, 2002; J. W. Lynch, Smith, Kaplan, & House, 2000; Pickett & Wilkinson, 2015; Wilkinson & Pickett, 2006). However, mortality is of limited use when examining the way health changes throughout the life course. Self-reported health is more appropriate than mortality to describe dynamic variations over time (Case & Deaton, 2005). Self-reported health provides a simple, direct way of capturing health perceptions. It is a valid, reliable, low cost predictor of morbidity (Chandola & Jenkinson, 2000) and mortality (Kaplan & Camacho, 1983; Lee, 2000).
Despite referring to current circumstances, self-reported health reflects the accumulation of health over the life course. Research suggests that self-rated health adequately represents morbidity and disability (Idler & Benyamini, 1997). For example, Idler and Kasl (1995) found a significant association between self-rated and disability in a sample of American adults. In Mexico, self-rated health and mortality have been strongly associated with infectious and chronic diseases (Markides, Salinas, & Sheffield, 2008; Samper-Ternent, Michaels-Obregon, Wong, & Palloni, 2012). Similarly, using a national representative sample of the older Mexican population, Bustos-Vázquez, Fernández-Niño, and Astudillo-Garcia (2017) reported direct and indirect associations between self-rated health with disability and morbidity.
Previous studies show women perceive their health less favourably than men at older ages (Anson, Paran, Neumann, & Chernichovsky, 1993; Hunt, McEwen, & McKenna, 1984). Explanations of sex differences in self-reported health can reflect actual differences in health as a consequence of biological and social factors and reflect a difference in the tendency to report health problems with women having a greater awareness of the socioemotional effect of health (Ross & Bird, 1994). Therefore, self-reported health trajectories might differ by gender. Researchers have also found gender differences in the relationship between self-rated health and mortality. A systematic review conducted by (Idler & Benyamini, 1997) reported that poor self-rated health poses a greater risk of mortality for men than women. There are also documented gender differences in the association between self-reported health and SEP, especially when including occupation and income. For example, a Mexican study including individuals over 50 years old showed a stronger association between lifetime occupation and self-rated health on men compared to women (Torres, Rizzo, & Wong, 2018). Similarly, an analysis of urban adults 50 years and over in Latin America found that women were more likely to report poor health than men. Socioeconomic disadvantage over the life course did not fully explain gender differences (Zunzunegui, Alvarado, Béland, & Vissandjee, 2009).
Researchers have identified an association between low SEP and health indicators among the elder, including low educational attainment, income, self-esteem, and life satisfaction (Idler & Benyamini, 1997). This association is often smaller at older ages, possibly related to how studies measure SEP at different life stages (Sacker, et al., 2005). There is also some evidence supporting the age as-leveler hypothesis. This hypothesis posits that health inequalities may diminish as a consequence of older age if health declines surpass cumulative life-course disadvantages (Dupre, 2007; Siegel, Luengen, & Stock, 2013; van Kippersluis, et al., 2010). The higher mortality of poorer individuals at younger ages or the reduction in inequality with older age may explain this effect (Dupre, 2007; Siegel, et al., 2013; van Kippersluis, et al., 2010).
Furthermore, there is little evidence about the association between SEP and health trajectories before and after retirement. A recent systematic review by Cullati, Rousseaux, Gabadinho, Courvoisier, and Burton-Jeangros (2014) found that self-reported health trajectories of disadvantaged populations decline faster rate than health trajectories of relatively advantaged populations. Those authors also found that young age, high SEP, and entering a partnership are protective factors for health. Using hierarchical models for repeated measures, a recent study in Mexico found childhood SEP was associated with later-life health trajectories, suggesting persistent disparities into old age (Torres, et al., 2018). These findings highlight the relevance of early-life conditions in shaping late-life health and life-time health trajectories. While there is some evidence supporting the association between SEP and self-reported health for older adults in Latin America (K. V. Smith & Goldman, 2007; Subramanian, Delgado, Jadue, Vega, & Kawachi, 2003; Torres, et al., 2018; Wong, Michaels-Obregon, & Palloni, 2015), most studies have focused on western populations (i.e., conducted mostly in Europe and North America). This may limit the generalizability of results (Henrich, Heine, & Norenzayan, 2010). Further, most studies have not considered childhood SEP (see Shuey & Willson, 2014 for an exception), raising questions about how much of the association between SEP and health trajectories is explained by early life circumstances.
In sum, little is known about the association between lifetime SEP and health trajectories. Most previous research have used cross-sectional methods, modeled the association on a single point in time, focused on Western populations, and have not considered childhood SEP, baseline health status, and heterogeneity in time trends. The aims of this study are to (i) describe health trajectories using sequence analysis, (ii) to describe changes in SEP throughout the life course, and (iii) to estimate the association between SEP throughout life course with the health trajectories identified. We use data from a nationally representative panel survey of Mexican men and women between 50 and 65 years of age to address these questions and to capture the transition to retirement. Many biological and contextual factors can affect older adults’ self-reported health status during this period (Bernardi, et al., 2019). At least some of these negative impacts could be prevented if understood better. We explicitly draw from life-course theory to recognize the relevance of individual biographies shaped by social circumstances and their long-term effects (Bernardi, et al., 2019). Accounting for diversity at the individual level is the first step toward better understanding health over the life course and its dynamic relationship with social exposures (McDonough & Berglund, 2003). The sequence analysis is particularly useful for this purpose as it allows us to understand long-term patterns and differences between individuals through illustrative visualizations and a holistic perspective (Madero-Cabib & Fasang, 2016).
1.1. Study setting
We believe Mexico provides an apt setting to examine the association between lifetime SEP and health trajectories among older adults for several reasons. First, Mexico is a middle-income country going through a fast demographic transition in the context of high income inequality (Consejo Nacional de Población, 2000; OECD, 2016). Among OECD countries, Mexico has the highest income inequality and lowest life expectancy at age 60 (20.8 years for men and 23.0 years for women; Dicker, et al., 2018). Demographic projections suggest that by 2050 about 30% of Mexicans will be older than 60 years of age. Longer lives are associated with increased healthcare utilization and costs (de Meijer, Wouterse, Polder, & Koopmanschap, 2013; Payne, Laporte, Deber, & Coyte, 2007; Spillman & Lubitz, 2000). However, Mexico’s fast aging process occurs under conditions of limited social security and a fragmented health system (Aguila, 2014; Angel, Vega, & López-Ortega, 2017; De Souza, Queiroz, & Skirbekk, 2019). There is substantial inequality in healthcare access and quality (Atun, et al., 2015; Lozano, et al., 2020), and the health system has one of the highest out-of-pocket expenditures among OECD countries, imposing significant financial risks to the population from catastrophic expenditures (Atun, et al., 2015; OECD, 2016). The public health security system is based primarily on private contributions schemes linked to formal employment, although healthcare has been substantially extended in the past two decades to households that were not previously covered by the Seguro Popular (Angel, et al., 2017; Atun, et al., 2015). Access to social security is more limited in rural areas, where 20% of the population lives (World Bank, 2020). A large proportion of the employed population (53.4%) remains in informal employment (ILO, 2020), and a large majority of older adults (~80%) do not have a retirement pension. Many of those who can access a pension delay their retirement until after 65 years of age (median retirement age is 69.4 years), further enhancing income inequalities and leaving many older adults financially vulnerable (Consejo Nacional de Población, 2000; OECD, 2016).
2. Materials and Methods
We used data from the Mexican Health and Aging Study (MHAS), an ongoing longitudinal panel study with a nationally representative sample of ~21,500 adults ≥50 years old in Mexico (Wong, et al., 2015). MHAS, among other various life-course events, characterized socioeconomic status across life and health transitions in older adulthood. We used individual-level data from the four publicly available survey waves of MHAS (2001, 2003, 2012, and 2015).
2.1. Outcomes
We used self-reported health as our primary outcome to model health trajectories. Self-reported health captures physical, mental, and social well-being. Despite being “subjective in nature”, self-reported health has been validated as a reliable global health measure (Idler & Benyamini, 1997). The MHAS survey asked participants to rate their health on a five-point Likert scale (excellent, very good, good, fair, and poor health) using the following question: “Would you say that your health is…?”. We included a binary variable to indicate whether the person died between panel waves, resulting in six mutually-exclusive self-reported health status. We estimated individual health trajectories using self-reported health at baseline (first wave, 2001) and subsequent changes in self-reported health in the next three panels, through 2015.
2.2. Socioeconomic position
We used several indicators to account for the standard and differential effects of SEP dimensions on health and their interrelationships (Demakakos, et al., 2016; Singh-Manoux, et al., 2005). We measured SEP during childhood using four retrospective measures: parental education, living conditions, and illnesses (variable names are shown in italics). Mother’s and father’s education were defined as the highest educational level achieved by an individual’s father and mother, using four categories: no formal education, some elementary school (first to sixth grade), complete elementary school (graduated from sixth grade), and more than elementary school. Living conditions before the age of 10 were measured as the sum of six indicator variables (1=yes; 0=no), with higher scores indicating a more disadvantaged childhood. These indicator variables were: (i) household did not have a toilet; (ii) individual usually went to bed hungry; (iii) individual did not use footwear regularly; (iv) individual or sibling left school to support their parents; (v) household received support from relatives due to economic problems; (vi) family slept in the same room that was used for cooking. Last, we used the total number of illnesses a person had before the age of 10 as the sum of five indicator variables for serious childhood illnesses (range 0–5, a higher score indicates poorer health): tuberculosis, rheumatic fever, polio, typhoid fever, and severe head concussions.
We measured SEP during adulthood using four measures: education, employment status, occupation, and economic status. Education was measured as the person’s highest educational level achieved and categorized into four groups: no education, primary, secondary, and tertiary education. We used different education and parental education categories because of significant leaps in educational participation in the past decades in Mexico (Monroy & Trines, 2019). Employment status was defined as employed or unemployed at baseline (2001). Participants were asked to report their main lifetime occupation among three options: self-employed (including being the owner), employee, and unemployed (including home keeper). We measured baseline self-reported economic status (“would you say that your financial situation is:”) as a five-point Likert scale poor, fair, good, very good, and excellent (with higher scores indicating better economic situation). Self-reported subjective measures of economic status are correlated with health in older age (Demakakos, et al., 2016; Singh-Manoux, et al., 2005), and relate to objective SEP to the extent that the socioeconomic resources that a person possesses are part of an individual’s perception of her social position within society (Jackman & Jackman, 1973).
2.3. Sample definition and missing data
Our sample included participants that transitioned over the usual retirement age in Mexico (65 years of age)1 across the observation period, 2001 to 2015. Specifically, we analysed data from individuals born in between 1944 and 1945 who were followed through 14 years between 2001 (age 56) and 2015 (age 71) (n=3,229). Of this sample, 68% of participants had no missing values in self-reported health across the four panels (2001, 2003, 2012, and 2015), 18% had a missing value in one panel, 9% had two panels with no data, and 5% had data in a single panel. Our final sample included all participants (i) with no missing data in self-reported health, (ii) with data missing in only one panel in this health variable, and (iii) with two years of missing data in this health indicator only if the trajectory had at least nine years (i.e., one of those panels was 2001 or 2003, and the other was 2012 or 2015). Individuals who died after age 71 were part of the study sample. Based on these criteria, our final sample included 2,480 participants (1,154 men and 1,326 women). Of these, 79% had no missing data in self-reported health, 19% had one missing panel in this variable (among them, 42% were concentrated in panels 2001 and 2003, and 58% in panels 2012 and 2015), and 2% had two missing panels in this health indicator.
We used multiple imputations by chained equation models with predictive mean matching to replace missing observations in the corresponding 21% of our final sample. We used 50 iterative multivariate imputations for each missing value (we show results without multiple imputations in Appendix A; the results with complete and imputed data are analogous). We used gender, education, age at baseline, survey wave, and, if applicable, self-reported health status before and after the missing observation as predictors for estimating missing values on the multiple imputation model.
2.4. Statistical analysis
Our analysis proceeds in two parts. First, we used sequence analysis to identify clusters of self-reported health trajectories based on common patterns in our longitudinal sample. Sequence analysis is a longitudinal statistical tool for modeling chronological observations to represent and classify sequences. It allows identifying and clustering trajectories with common patterns (MacIndoe & Abbott, 2004). Each row in the data represents an individual’s sequence of self-reported health, and columns represent chronological time points in which health was reported (i.e., four time points from 2001 to 2015 in our study). We used Optimal Matching Analysis to estimate a distance matrix, which summarizes the modifications (substitution, insertion, and or deletion) that would be required to make individual sequences equivalent. We set substitution costs at two and indel costs at one, as is the field’s standard (MacIndoe & Abbott, 2004). We then used Ward’s hierarchical cluster analysis to identify similar individual sequences of 15-year self-reported health trajectories.
We used the average silhouette width (ASW) index to determine the optimal number of clusters to represent trajectories in our sample. Specifically, the ASW is an index used to evaluate the proximities or similarities between all individuals’ patterns (in our case study, in health trajectories) and, relying on such similarities, the partitioning quality of different cluster solutions that best summarize the people’s patterns. To this latter purpose, the index works by providing cluster solutions that maximize similarities between members within a given cluster while maximizing differences between members of different clusters (Rousseeuw, 1987). Each cluster has its own ASW index, ranging from 0 to 1, with numbers closer to 1 indicating a more robust solution, that is, individuals highly similar to each other gathered in the same group. Then, the average of ASW across all clusters corresponds to the overall ASW index reported in this study.2
We conducted sequence analysis separately for men and women. In Appendix B we show the ASW index and sequence analysis for women and men together.
Second, we used bivariate analyses (chi-squared or one-way ANOVA) and multinomial logistic regressions to estimate the association between SEP at childhood and adulthood and health trajectories clusters. We used the most prevalent health trajectory as the reference group. We weighted all analyses using an expansion factor that corrects for the effect of non-responses and adjusts the sample to known population characteristics to improve generalizability and be sure our results were not affected by sample selection bias. The used weights were those provided by MHAS. However, as a robustness check, we show unweighted univariate and bivariate analyses in Appendices C, F, and G.
All analyses were done with the statistical software R (R Core Team, 2019). Specifically, we used the libraries TraMineR (Gabadinho, Ritschard, Mueller, & Studer, 2011) for sequence analysis, nnet (Ripley, Venables, & Ripley, 2016) and effects (Fox & Hong, 2009) for multinomial logistic regressions, and mice (Buuren & Groothuis-Oudshoorn, 2010) for multivariate imputation by chained equations.
3. Results
3.1. Descriptive statistics
Table 1 shows weighted descriptive statistics separately for men and women in our sample (see Appendix C for unweighted descriptive statistics). The average age is 55.6 for men and women (median=56). Women show worse indicators of self-reported health than men at baseline and in the last observation. However, more men than women died during the study period (15.6 versus 10.6, respectively). About half the adults in our sample had a mother with no formal education (men: 51.3%, women: 54.5%), and about two out of five older adults had a father with no formal education (men: 44.8%, women: 45.4%). A substantial proportion of respondents experienced some childhood adversity (living conditions: men: 2.18, standard deviation, SD: 0.16; women: 2.24, SD: 0.22). Most adults had completed primary education (men: 55.8%, women: 57.6%); a relatively small share of the population had completed tertiary education (men: 6.4%; women: 3.0%). Approximately one out of five older adults had no formal education (men: 19.9%, women: 27.3%). A considerable share of participants was unemployed at baseline (men: 17.4%; women: 60.9%), and their economic status was similar at baseline, mostly good (men: 2.09, SD: 0.04: women: 2.03, SD: 0.04). Compared with men, women were significantly less educated (p=0.005) and less likely to be employed (p=0.009). However, we found no evidence of differences in childhood SEP by gender.
Table 1.
Weighted descriptive statistics of the study sample and across men and women
| Whole Sample | Men | Women | p-value | |
|---|---|---|---|---|
| Age (Mean, Median, SD) | 55.6 (1.64) | 55.6 (1.70) | 55.6 (1.61) | 0.351 |
| Self-reported health | ||||
| Baseline observation (%) | ||||
| Excellent | 2.1 | 3.1 | 1.3 | 0.001 |
| Very good | 4.2 | 5.4 | 3.2 | |
| Good | 31.6 | 36.5 | 27.5 | |
| Fair | 46.7 | 40.0 | 52.2 | |
| Poor | 11.1 | 9.8 | 12.1 | |
| Deceased | 0.0 | 0.0 | 0.0 | |
| Last observation (%) | ||||
| Excellent | 2.9 | 2.6 | 3.0 | 0.096 |
| Very good | 1.8 | 2.3 | 1.4 | |
| Good | 18.2 | 20.8 | 16.1 | |
| Fair | 46.0 | 41.6 | 49.7 | |
| Poor | 13.6 | 13.5 | 13.6 | |
| Deceased | 12.8 | 15.4 | 10.6 | |
| Childhood SEP | ||||
| Mother’s education (%) | ||||
| None | 53.0 | 51.3 | 54.5 | 0.430 |
| Some elementary | 25.9 | 25.1 | 26.6 | |
| Complete elementary | 9.7 | 11.6 | 8.1 | |
| More than elementary | 3.8 | 3.6 | 4.0 | |
| Missing | 7.6 | 8.4 | 6.8 | |
| Father’s education (%) | ||||
| None | 45.1 | 44.8 | 45.4 | 0.869 |
| Some elementary | 30.1 | 30.5 | 29.7 | |
| Complete elementary | 8.0 | 8.3 | 7.8 | |
| More than elementary | 5.9 | 6.8 | 5.2 | |
| Missing | 10.9 | 9.6 | 11.9 | |
| Living conditions (0–6)† (Mean, SD) | 2.21 (1.64) | 2.18 (1.55) | 2.24 (1.71) | 0.059 |
| Illnesses (0–5)ǂ (Mean, SD) | 0.07 (0.30) | 0.08 (0.34) | 0.07 (0.28) | 0.403 |
| Adult SEP | ||||
| Education (%) | ||||
| None | 23.9 | 19.9 | 27.3 | 0.005 |
| Primary | 56.8 | 55.8 | 57.6 | |
| Secondary | 14.8 | 18.0 | 12.1 | |
| Tertiary | 4.5 | 6.4 | 3.0 | |
| Missing | 0.0 | 0.0 | 0.0 | |
| Employment status‡ (%) | ||||
| Employed | 70.4 | 81.8 | 5.9 | 0.009 |
| Unemployed | 11.1 | 17.4 | 60.9 | |
| Missing | 18.5 | 0.8 | 33.2 | |
| Occupation (%) | ||||
| Self-employed | 37.7 | 48.3 | 28.9 | <0.001 |
| Employee | 42.7 | 49.1 | 37.3 | |
| Unemployed | 4.2 | 1.9 | 6.2 | |
| Missing | 15.4 | 0.7 | 27.6 | |
| Economic status‡ | 2.06 (0.64) | 2.09 (0.67) | 2.03 (0.63) | 0.825 |
| Sample size (n) | 2,480 | 1,154 | 1,326 |
Notes: SD: standard deviation. SEP: socioeconomic position.
Living conditions before the age of 10 years were measured as the sum of six indicator variables (1=yes; 0=no), with higher scores indicating a more disadvantaged childhood.
Total number of illnesses that person had before the age of 10 years as the sum of five indicator variables for serious childhood illnesses (range 0–5, higher scores indicates poorer health).
Measured at baseline *p-values testing differences of all variables by gender.
3.2. Self-reported health trajectories
Figure 1 shows the ASW index to estimate the optimal number of clusters of health trajectories in our sample for men and women. Figure 1A suggests that four clusters seem best to characterize men’s self-reported health trajectories. Figure 1B shows peaks at three and eight SHR clusters, with a marginally larger ASW index at the three-cluster solution (differences in ASW scores between three and eight clusters were only 0.0008 points using survey weights and 0.03 without weights). We decided to use the eight-cluster solution because it provides a richer interpretation of health pathways than the three-cluster solution (see Appendix H).3 In Appendix B, we show the ASW index and sequence analysis for women and men together. The analysis shows that four groups are the most representative number of health patterns when analyzing both genders simultaneously. A joint analysis would ignore substantial heterogeneity in health trajectories (especially among women) found when conducting analyses in separate samples for men and women.
Figure 1.

Average silhouette width index for older adults (A: men; B: women)
Figure 2 shows the weighted types of self-reported health trajectories around the retirement age for men and women. Chronogram plots (left panel) illustrate the overall path followed by individuals grouped within a specific self-reported health trajectory. Individual sequence graphs (right panel) show the path followed by every individual grouped in each type of self-reported health trajectory. Both figures were built based on the six mutually-exclusive health statuses, including ‘deceased’, represented by different colors to identify transitions between statuses along the health trajectory.
Figure 2.
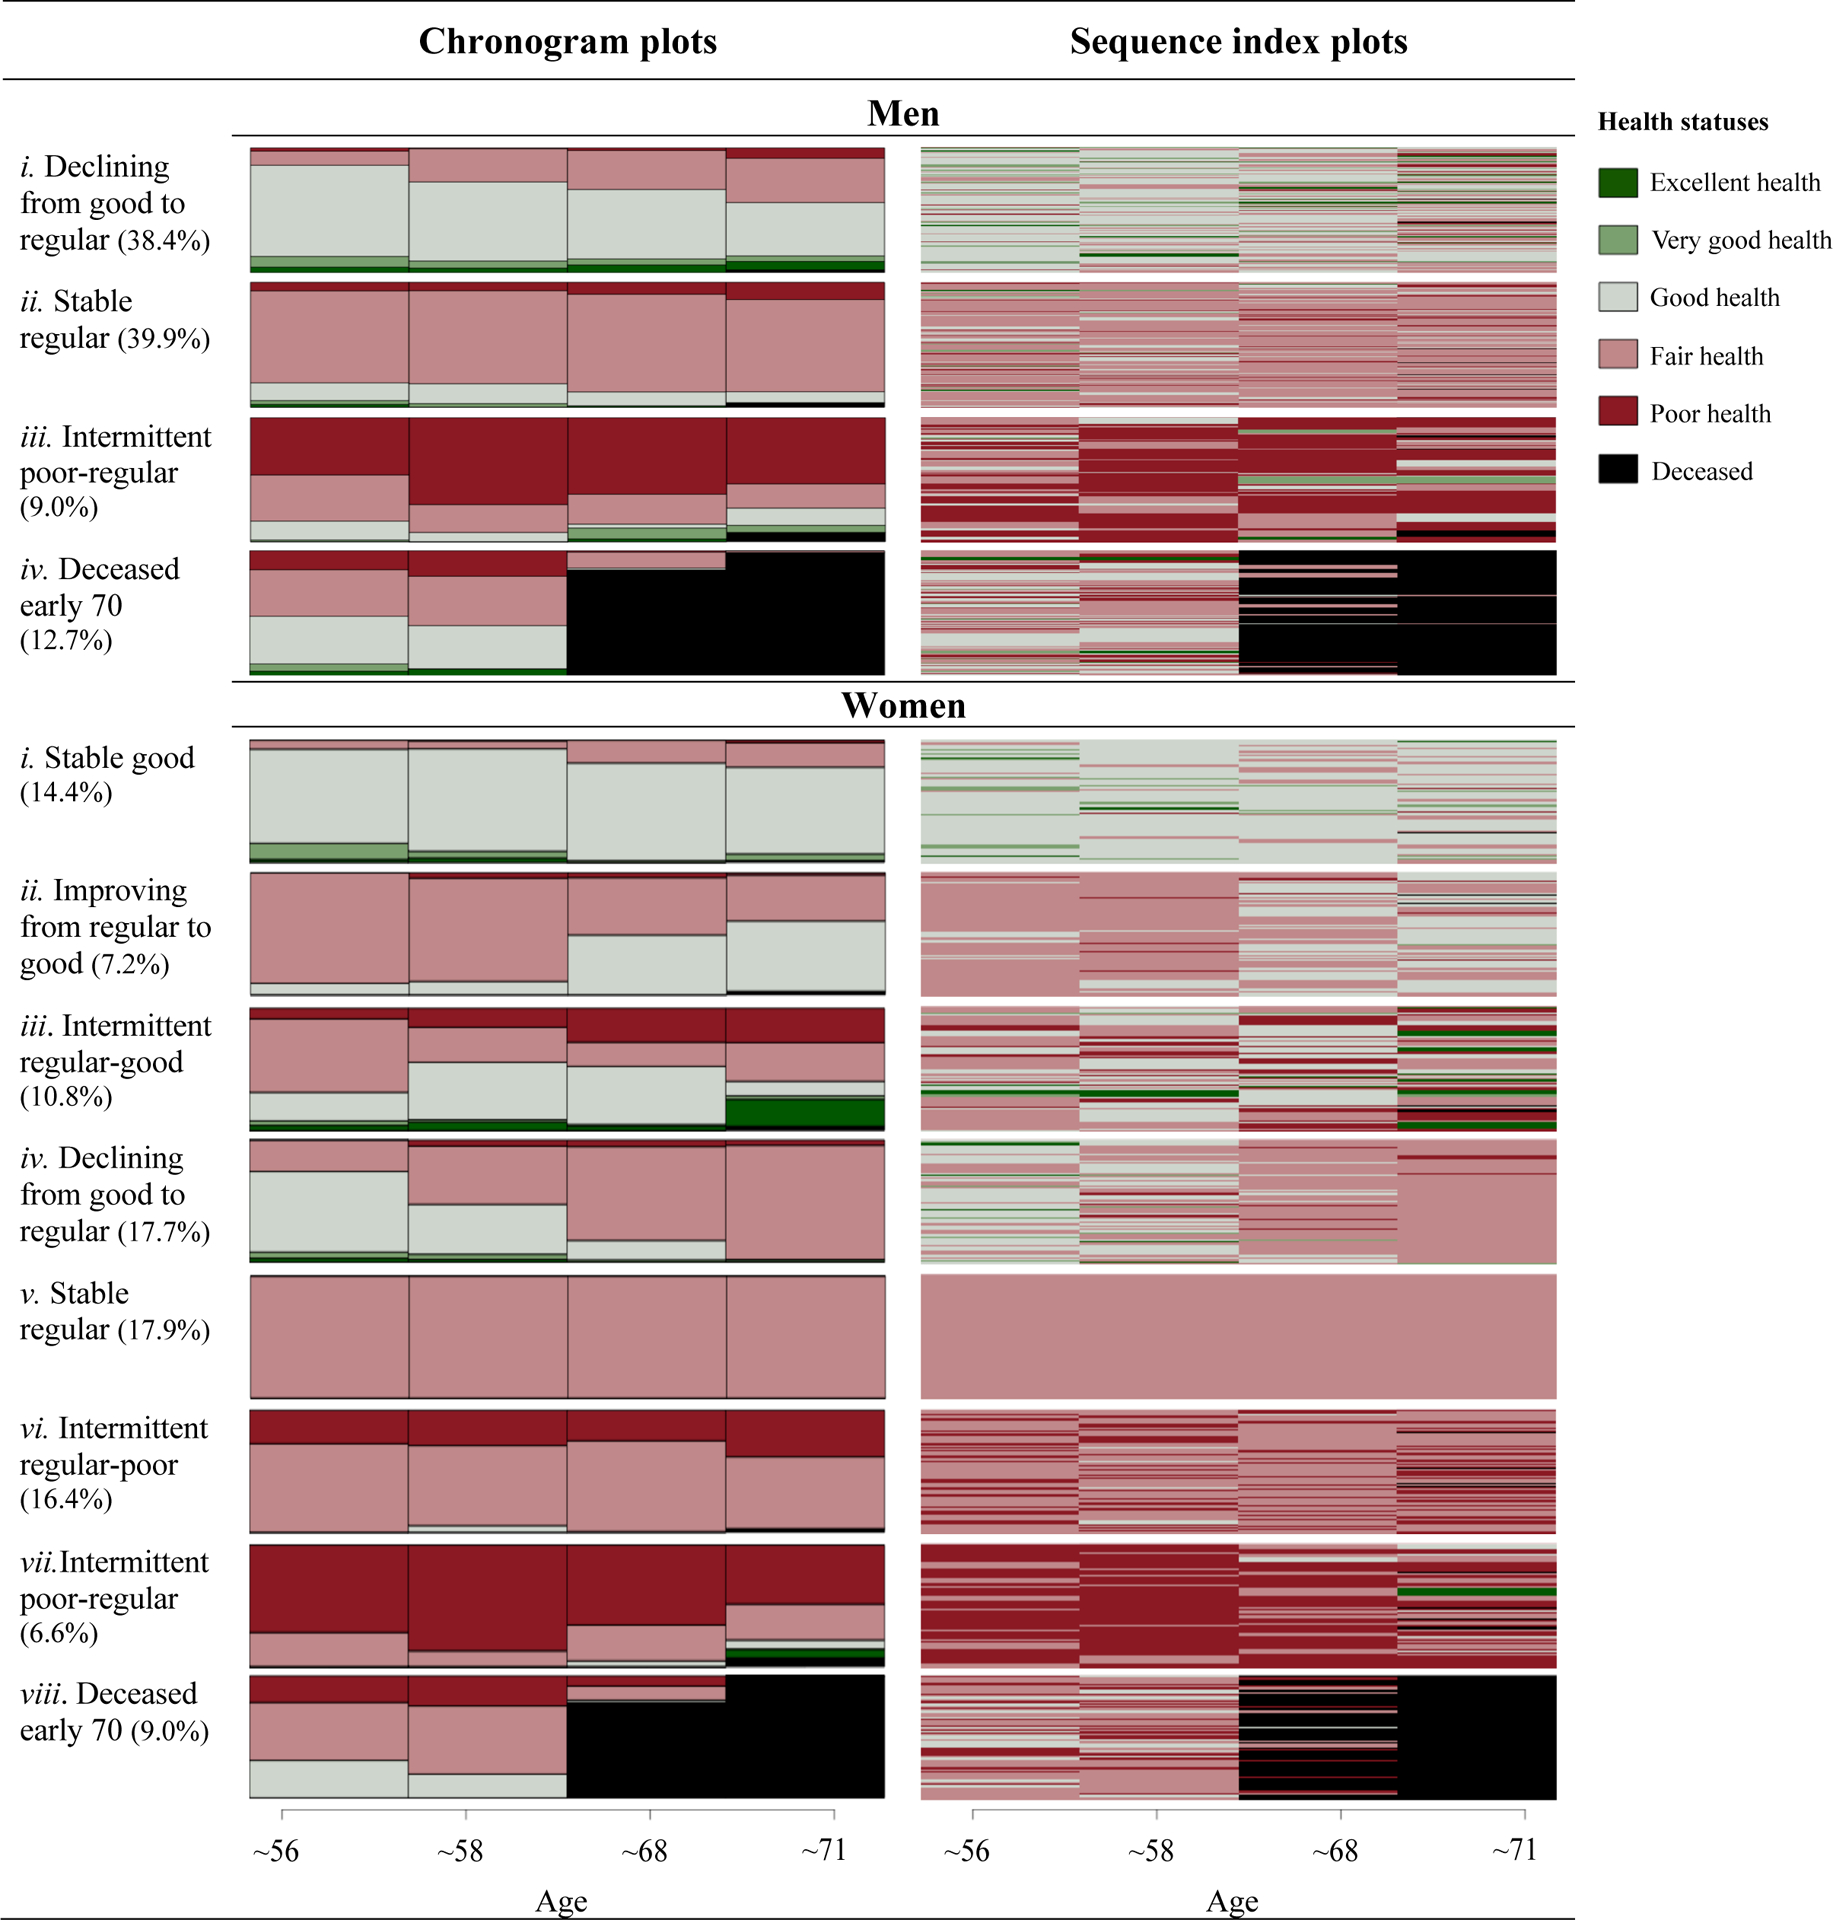
Weighted types of health trajectories for men and women
To support the interpretation of results (Sacker, Wiggins, Bartley, & McDonough, 2007), we labeled health trajectories in four categories based on observed health transitions: improving (less healthy at the start and healthier towards the end), stable (four or most waves in the same health state), intermittent (fluctuation between different health status) and declining (healthier at the start and declining health towards the end). We organized health trajectories by first sorting the stable trajectories (good, regular and/or poor) and then sorting the trajectories that were in-between stable groups. For example, improving from regular to good health was located between stable good and stable regular.
We identified the following clusters in men’s health trajectories (Figure 2, upper panel): cluster i, ‘declining from good to regular’ (38.4%), shows individuals that mostly reported good health at baseline and whose health declined towards fair; cluster ii, ‘stable regular’ (39.9%), included individuals whose health remained mostly fair during the 15-years period; cluster iii, ‘intermittent poor-regular’ (9.0%), reflects individuals reporting transitions back and forth from poor to fair health across the observation period; cluster iv, ‘deceased early 70’ (12.7%), shows men with premature death, that is before age 70.
We identified the following clusters in women’s health trajectories (Figure 2, lower panel): cluster i, ‘stable good’ (14.4%), shows women whose health remained largely good over the years; cluster ii, ‘improving from regular to good’ (7.2%), shows women whose perceived health improved from mostly fair to good;, cluster iii, ‘intermittent regular-good’ (10.8%), includes women reporting transitions back and forth from fair to good health over the years; cluster iv, ‘from good to regular’ (17.7%), for women with declining health, moving from good at baseline towards fair health at the end; cluster v, ‘stable regular’ (17.9%), represents women whose health remained fair during the 15-year period; cluster vi and vii, ‘intermittent regular-poor’ (16.4%) and ‘intermittent poor-regular’ (6.6%), indicating transitions back and forth from regular to poor health, and from poor to regular health, respectively; and cluster viii, ‘deceased early 70’ (9.0%), shows women with premature death in their early 70s.
3.3. Lifetime socioeconomic determinants of health trajectories: Multivariate analysis
Next, we assessed the association between types of self-reported health trajectories and SEP over the life-course, as a child and adult, through a multinomial analysis including all predictor variables. Table 2 shows the results for men and Table 3 for women4. Appendices D, E, F and G5 show both, weighted and unweighted bivariate analyses. We excluded from multinomial models socioeconomic predictors with high multicollinearity (i.e., indicating variance inflation factors VIF≥10) from our models. This multicollinearity was somewhat expected. In contexts of low social mobility and high socioeconomic stratification, parental education is highly correlated with adverse experiences and living conditions in childhood and to an individual’s educational level, SEP, and occupation.
Table 2.
Weighted multinomial regression (odds ratios) among older men (n=1,154)
| Self-reported health trajectory types (ref: ii. Stable regular) | i. Declining good to regular | iii. Intermittent poor-regular | iv. Deceased early 70 | |||
|---|---|---|---|---|---|---|
| Childhood SEP | ||||||
| Mother’s education | ||||||
| None or some elementary (ref) | 0 | 0 | 0 | |||
| Complete or more than elementary | 0.529*** | (0.011) | 1.999*** | (0.017) | 0.221*** | (0.014) |
| Father’s education | ||||||
| None or some elementary (ref) | 0 | 0 | 0 | |||
| Complete or more than elementary | 1.061*** | (0.010) | 0.496*** | (0.017) | 2.838*** | (0.012) |
| Living conditions | 0.793*** | (0.002) | 1.455*** | (0.003) | 0.865*** | (0.003) |
| Illnesses | 0.999 | (0.007) | 0.538*** | (0.015) | 1.134*** | (0.011) |
| Adult SEP | ||||||
| Educational level | ||||||
| None or primary (ref) | 0 | 0 | 0 | |||
| Secondary or tertiary | 2.093*** | (0.008) | 1.098*** | (0.015) | 3.457*** | (0.010) |
| Employment status | ||||||
| Employed | 0.863*** | (0.007) | 0.670*** | (0.009) | 0.773*** | (0.010) |
| Unemployed (ref) | 0 | 0 | 0 | |||
| Occupation | ||||||
| Self-employed | 0.886*** | (0.006) | 0.841*** | (0.008) | 0.416*** | (0.008) |
| Employee (ref) | 0 | 0 | 0 | |||
| Unemployed | 0.554*** | (0.027) | 1.800*** | (0.022) | 0.408*** | (0.039) |
| Economic status | 3.301*** | (0.005) | 0.677*** | (0.007) | 2.391*** | (0.006) |
| Constant | 0.149*** | (0.012) | 0.265*** | (0.017) | 0.093*** | (0.016) |
| Akaike Information Criterion | 1,829,847 | |||||
Notes: Standard deviations are shown in brackets. Employment status was measured in the initial observation year.
P-values: *p<0.1; **p<0.05; ***p<0.001.
SEP: Socioeconomic position.
Table 3.
Weighted multinomial regression (odds ratios) among older women (n=1,326)
| Self-reported health trajectory types (ref: v. Stable regular) | i. Stable good | ii. Improving regular to good | iii. Intermittent regular-good | iv. Declining good to regular | vi. Intermittent regular-poor | vii. Intermittent poor- regular | viii. Deceased early 70 | |||||||
|---|---|---|---|---|---|---|---|---|---|---|---|---|---|---|
| Childhood SEP | ||||||||||||||
| Mother’s education | ||||||||||||||
| None or some elementary (ref) | 0 | 0 | 0 | 0 | 0 | 0 | 0 | |||||||
| Complete or more than elementary | 2.318*** | (0.020) | 1.056* | (0.029) | 1.400*** | (0.021) | 0.544*** | (0.023) | 1.451*** | (0.022) | 4.063*** | (0.028) | 1.889*** | (0.025) |
| Father’s education | ||||||||||||||
| None or some elementary (ref) | 0 | 0 | 0 | 0 | 0 | 0 | 0 | |||||||
| Complete or more than elementary | 0.899*** | (0.016) | 0.486*** | (0.024) | 1.113*** | (0.016) | 1.169*** | (0.017) | 1.133*** | (0.017) | 0.357*** | (0.029) | 0.638*** | (0.024) |
| Living conditions | 0.677*** | (0.003) | 0.776*** | (0.004) | 0.712*** | (0.003) | 1.019*** | (0.003) | 1.088*** | (0.003) | 0.998 | (0.004) | 1.010*** | (0.004) |
| Illnesses | 0.048*** | (0.034) | 0.218*** | (0.025) | 0.008*** | (0.086) | 0.149*** | (0.019) | 0.569*** | (0.013) | 1.921*** | (0.014) | 0.851*** | (0.016) |
| Adult SEP | ||||||||||||||
| Educational level | ||||||||||||||
| None or primary (ref) | 0 | 0 | 0 | 0 | 0 | 0 | 0 | |||||||
| Secondary or tertiary | 2.777*** | (0.016) | 4.708*** | (0.020) | 2.428*** | (0.017) | 3.924*** | (0.017) | 1.047** | (0.019) | 3.329*** | (0.023) | 5.020*** | (0.019) |
| Employment status | ||||||||||||||
| Employed | 41.795*** | (0.029) | 10.388*** | (0.029) | 4.722*** | (0.015) | 3.873*** | (0.013) | 9.325*** | (0.018) | 3.801*** | (0.021) | 1.312*** | (0.013) |
| Unemployed (ref) | 0 | 0 | 0 | 0 | 0 | 0 | 0 | |||||||
| Occupation | ||||||||||||||
| Self-employed | 0.697*** | (0.010) | 0.876**** | (0.012) | 1.057*** | (0.009) | 0.835*** | (0.009) | 0.643*** | (0.009) | 0.591*** | (0.013) | 0.422*** | (0.012) |
| Employee (ref) | 0 | 0 | 0 | 0 | 0 | 0 | 0 | |||||||
| Unemployed | 4.946*** | (0.021) | 3.019*** | (0.026) | 3.081*** | (0.023) | 0.368*** | (0.034) | 6.273*** | (0.020) | 0.912*** | (0.042) | 4.192*** | (0.024) |
| Economic status | 1.574*** | (0.009) | 0.446*** | (0.012) | 0.584*** | (0.009) | 0.669*** | (0.009) | 0.559*** | (0.009) | 0.145*** | (0.013) | 0.290*** | (0.012) |
| Constant | 0.021*** | (0.035) | 0.352*** | (0.038) | 1.086*** | (0.025) | 0.622*** | (0.023) | 0.358*** | (0.026) | 3.198*** | (0.033) | 3.260*** | (0.028) |
| Akaike Information Criterion | 2,564,249 | |||||||||||||
Notes: Standard deviations are shown in brackets. Employment status was measured in the initial observation year.
P-values: *p<0.1; **p<0.05; ***p<0.001.
SEP: Socioeconomic position.
Table 2 shows that childhood living conditions, educational level, and economic status were significantly associated with cluster membership among men. Consistent with previous literature, lower mother’s education and disadvantaged childhood living conditions were associated with intermittent poor-regular health (cluster iii, OR=2.093, p<0.001, and OR=1.455, p<0.001, respectively). However, father’s education has the opposite effect on this trajectory (OR=0.496, p<0.001). As far as individual educational level is concerned, compared to men with less formal education, those with more formal education were more likely to experience the healthier trajectory (cluster i, OR=2.093, p<0.001), only slightly more likely to report intermittent poor-regular health (Cluster iii, OR=1.098, p<0.001), but clearly more likely to experience premature death (Cluster iv, OR=3.457, p<0.001). We observe a similar association for wealthier individuals, as they were more likely to face the healthier trajectory type (Cluster i, OR=3.301 p<0.001), but also early decease (Cluster iv, OR=2.391 p<0.001).
Table 3 shows that all childhood and adult socioeconomic variables were significantly associated with health trajectories for women. As in the case of men, women from more formally educated mothers and with more formal education were more likely to report healthier self-reported health trajectories (clusters i, ii, iii, and iv), than women with less educated mothers and less formal education. However, these groups of women were also more likely to experience trajectories with premature death and regular health. Women who reported more illnesses and more adverse experiences during childhood were less likely to experience more healthy self-reported health trajectories during old age (clusters i, ii, iii, and iv), consistent with previous literature (Cullati, et al., 2014; Haas, 2008; McDonough & Berglund, 2003). Also, employed women were more likely than unemployed women to experience healthier trajectories. Last, wealthier women were associated positively only with the healthiest trajectory (cluster i, OR=1.574, p<0.001).
4. Discussion
Drawing on life course theory and research, we explored how socioeconomic circumstances during childhood and adulthood shape self-reported health trajectories among older Mexican adults. The analysis showed at least three relevant findings. First, we found substantial heterogeneity in the health trajectories of Mexican adults around the age of retirement. Second, disadvantaged childhood living conditions and SEP during adulthood are significantly associated with changes in self-reported health at old age. Third, most childhood and adult SEP indicators were significantly associated with self-reported health trajectories. We put these findings in context and highlight their relevance below.
The first aim of this study was to describe the self-reported health trajectories of Mexican older adults. We found substantial heterogeneity in self-reported health trajectories, particularly for women compared to men (eight clusters compared to four clusters were required to describe health trajectories). In longitudinal studies, the association of gender with changes in self-reported health trajectories have found contradictory findings. Studies conducted by Rodin and McAvay (1992) and Leinonen, Heikkinen, and Jylhä (1998) found no differences by gender in self-reported health trajectories. In contrast, Rohlfsen and Jacobs Kronenfeld (2014) reported gender disparities in self-reported health trajectories. Haas (2008) found that women’s health trajectories were more heterogeneous than men’s trajectories, consistent with our results. Studies exploring the association between gender and perception of health have shown that health differences are strongly related to gender (Arber & Ginn, 1993; Idler, 2003).
We also found that women tended to rate their health more poorly than men. These results agree with previous studies conducted in Latin America, reporting higher prevalence of poor/fair self-rated health and higher morbidity in chronic diseases and mental health conditions among women (Zunzunegui, et al., 2009). Previous research suggests that women may be more aware of their health than men (Verbrugge, 1985). Furthermore, it may be more acceptable for women than men to discuss illness because of men’s perceived role as the family provider in groups where traditional gender roles are predominant (Curtis & Lawson, 2000; Zunzunegui, et al., 2009). Women in Mexico have on average less education than men, and many are not economically independent (Zabludovsky, 2007). The differences in health trajectories and health rating by gender might also be related to the health security system, based primarily on private contributions schemes linked to formal employment (ILO, 2020). Most Mexican women engage in housework and informal labor (Torres, et al., 2018) with no social security benefits. On average, women in the formal economy have worked fewer years than men and are often paid lower wages than men for doing the same job (ILO, 2020; OECD, 2017). The results of this study and previous literature show significant gender differences in reported health, suggesting different approaches to prevention, treatment, and care are probably needed. Differences in self-reported health trajectories by gender may be based on multiple interactions between gender, health, social, cultural, biological, and economic determinants (Hankivsky, 2012; Vlassoff, 2007; Warner & Brown, 2011).
The results also show that childhood SEP had a more substantial association with women’s self-reported health trajectories than men. Differences observed between men and women could be related to traditional gender roles, making women more likely to experience vulnerable health throughout their life course (Alderman & King, 1998; Rohlfsen & Jacobs Kronenfeld, 2014; Vlassoff, 2007). Multiple pathways could explain how vulnerability in critical periods like childhood could affect women and men differently. One specific example might relate to resource allocation. Studies in Latin America and elsewhere have reported differences by children’s gender in the household allocation of limited resources, including food and nutrition, school access, education, and unpaid work. These gender differences can vary by several factors, including headship gender, sibship structure, birth order, expected income, and poverty (Behrman, 1988; Butcher & Case, 1994; Garg & Morduch, 1998; Godoy, et al., 2006; Post, 2001; Qian, 2008). The allocation of limited resources often favors boys over girls, and disadvantages are often exacerbated during a crisis, such as unemployment or poverty (Behrman, 1988; Buchmann, 1996; Sen & Sengupta, 1983). Nevertheless, our results provide no closure over this topic. Additional qualitative analyses are needed to provide a more robust conclusion on the mechanism explaining these gender differences and their impact throughout the life-course.
The second aim of this study was to describe the association of health trajectories with lifetime SEP. We found that disadvantaged childhood living conditions and SEP during adulthood have a significant association with changes in self-reported health at older age, consistent with previous research (Cullati et al., 2014; Haas, 2008; McDonough and Berglund, 2003). Specifically, we found significant associations for childhood living conditions, education, and economic status for men and women. Women’s health trajectories were also associated with parental education, employment status, occupation, and illnesses before ten years of age. Overall, individuals with more advantaged conditions over the life course were at a lower risk of experiencing poorer health trajectories. However, as McDonough, Sacker, and Wiggins (2005) suggest, we found that this correlation was heterogeneous. How advantaged or disadvantaged socioeconomic conditions affect adult health trajectories may vary substantially from one individual to another. Because there is no simple way to rank the trajectories hierarchically, we could not establish a monotonous order. These results show health trajectories are complex and might be affected by variables not observed in our study. We had an unexpected finding. Compared to poorer and less educated men, our results suggest that wealthier and more highly educated men were more likely to have died before the age of 70, suggesting premature death; life expectancy for men in Mexico was 72.6 in 2017 (Dicker, et al., 2018). We lack data to explore potential mechanisms that could explain this association. One plausible hypothesis that could help understand this finding relates to the higher prevalence of obesity and other cardiovascular risk factors among wealthier individuals in Mexico. For example, a study by K. V. Smith and Goldman (2007) using MHAS data in Mexico found that higher income was associated with higher rates of obesity, smoking and alcohol consumption, a finding consistent with studies among younger age groups in Mexico (Caballero, De León, San Martín, & Villaseñor, 1999; Vázquez-Segovia, Sesma-Vázquez, & Hernández-Avila, 2002). Similarly, Barquera, et al. (2020) reported that the prevalence of obesity, overweight, and abdominal adiposity among Mexican adults is higher among wealthier individuals than their peers from lower socioeconomic position. These medical conditions are known risk factors for cardiovascular disease, the most common cause of death in Mexico (World Health Organization, 2018). While we lack data to confirm this hypothesis, it could be explored in future research.
Recall that life-course theory uses two main approaches to study the association between SEP and self-reported health: critical periods and cumulative model. The association between lifetime SEP and self-reported health trajectories can give some insight into which of the life course models described our data better. Establishing which mechanism has a larger effect is complex, as SEP and health are difficult to disentangle. These models are probably interrelated. Elucidating the relative influence of each approach is fundamental to understand how life course SEP relates to health (Ben-Shlomo & Kuh, 2002; Ben-Shlomo, Mishra, & Kuh, 2014). If the critical period model prevailed over the accumulative model, self-reported health trajectories would be mostly determined by SEP experienced at a specific point (e.g., adulthood or childhood). In contrast, if the cumulative model is predominant, we would expect a significant association between self-reported health trajectories and SEP at all times due to an accumulation of advantages or disadvantages through exposure to adverse circumstances that may positively or negatively affect self-reported health. Our results hint at the cumulative effect of SEP. Proximal (adult) and distal (childhood) SEP were associated with older adults’ self-reported health trajectories. Moreover, the results also show that childhood and adult SEP are correlated (Appendix J), suggesting that childhood SEP has a long-term effect determining adult SEP. Therefore, it is likely that the critical period and the accumulation model approaches operate throughout the life course.
One strength of our study is its focus on a limited age-range, thus minimizing the effect of age on the trajectories and factors that may affect them. Another strength is that our study focuses on Mexico, a developing middle-income country. We found that most individuals in our sample were likely to report either regular or poor health at the baseline (66% women; 55% men). These results are worrying; a substantial proportion of older Mexicans are reaching retirement age with poor perceived health. In contrast, longitudinal studies on European populations in a similar age range have generally shown better health indicators than those in our study (Rodin & McAvay, 1992; Stenholm, et al., 2016). Thus, conclusions from industrialized nations could not be generalizable for developing countries. These observed differences may be related to absolute income effects on health, relative income effects, as higher inequality may result in poorer health, or be related to healthcare access and quality (Brunner, 1997; Deaton, 2003; J. Lynch, et al., 2004; J. W. Lynch, et al., 2000; Pickett & Wilkinson, 2015; Undurraga, Behrman, Leonard, & Godoy, 2016; Wilkinson & Pickett, 2009). Understanding how social determinants affect health in developing countries like Mexico is more relevant than ever because the population in Mexico is aging rapidly, and will inevitably increase pressure over healthcare and social security (Aguila, 2014; Angel, et al., 2017; Riumallo-Herl & Aguila, 2019). Less than half of the current workforce has any pension o retirement benefits (Angel, et al., 2017). Lastly, a novel aspect of our study is that the primary outcome, self-reported health trajectories using sequence analysis to map individual change in self-reported health, shows that health is a dynamic phenomenon. Our model allowed us to explore the dynamics of the associations between SEP and health along the life course. This allowed us to explore different trajectories simultaneously. The combination of descriptive analysis and inferential modeling could help reach new milestones in understanding how health inequalities are created and maintained over time. Furthermore, sequence analysis provides a visual illustration of health pathways, facilitating the understanding of complex information such as longitudinal health trajectories (Gosselin, du Loû, & Lelièvre, 2018).
Our analysis also has limitations. First, the measurement of some SEP predictors, including employment status, occupation, and parental education, is self-reported. MHAS is based on a structured questionnaire, which may group different individuals under the same categories and potentially lose some relevant information. For example, the variable occupation, which measures the main lifetime occupation, has an “unemployed” category. Unemployed may include a very heterogeneous set of individuals. For instance, individuals who could not find a stable job during their adult life (for example, the homeless) and individuals who decided not to work in paid employment and focus instead on domestic chores (home keeper). Second, childhood measures were obtained retrospectively. An ideal scenario would be to obtain prospective long-term longitudinal data on a large cohort of individuals. In our favor, there is some evidence suggesting older individuals can accurately report their childhood socioeconomic conditions and health (Jivraj, Goodman, Ploubidis, & de Oliveira, 2017; J. P. Smith, 2009). Third, some studies suggest that participants with poor health may be more likely to drop out of the study than participants reporting better health (McDonough, Worts, & Sacker, 2010; K Orozco-Rocha, Michaels, & Wong, 2020; K. Orozco-Rocha, Wong, & Obregón, 2018). If so, the findings of our study could be conservative, as poor health trajectories could be underestimated. Fourth, the influence of childhood SEP on adult health may be contingent on SEP interaction over the life course. Establishing the relative magnitude of such effects is complex, as the relation between SEP and health during childhood and adulthood is difficult to disentangle (Feinstein, 2000). Last, there could be a cohort effect that we did not consider. However, even if a cohort effect existed, it would probably not substantial because our age range is minimal (54 to 58 years of age in 2001).
To conclude, this study is a first step towards understanding the long-term relationship between life course SEP and self-reported health trajectories in a dynamic framework in Mexico, which could illuminate our understanding of retirement transitions in other Latin American countries (De Souza, et al., 2019; Queiroz, 2017). Following Shuey and Willson (2014), we conceptualized health as a dynamic process rather than limiting the analysis to describing health status at one point in time or average effects throughout life. Our study fills an empirical void by examining the extent to which early life and adult circumstances shape self-reported health trajectories in the near-elderly. This dynamic approach presented us with research challenges, such as accounting for temporal heterogeneity across multiple domains and observation stages. Further research should explore heterogeneity in the contribution of early and later-life socioeconomic factors in determining adult health trajectories. For instance, results may vary by ethnicity and immigration status in addition to gender. Research in dynamic processes is still in an early stage conceptually and methodologically. However, the potential is nothing less than innovative policies targeting specific events or transitions in individuals’ lives.
5. Conclusion and Policy Implications
We examined the impact of lifetime SEP factors on self-reported health trajectories on a Mexican population. Understanding the link between childhood and adult disadvantage and later-life health is critical to help prevent negative impacts at an older age and inform policy design and implementation. Our results suggest that early and later life socioeconomic circumstances have lasting impacts on health trajectories. The dynamic approach to health supports that policies targeting transitions in life and or specific episodes could be more impactful than focusing on “problem” groups (McDonough & Berglund, 2003). Policies should focus on targeting events or structures that make people vulnerable to poverty in addition to alleviating poverty. Besides accumulation effects, sequence analysis stratified by adult gender indicated that self-reported health trajectories are different among men and women. Efforts to tackle health disparities by gender should consider these differences, which require the application of flexible and differentiated policies. Our research leaves open whether the association between life trajectories and health also differ by other social categories such as ethnicity, race, or sexual orientation. Last, we found evidence that there is no simple monotonic relation between life course circumstances and health.
Highlights.
We used a life course approach to examine health trajectories of adults ≥50 years old.
We used the Mexican Health and Aging panel survey from 2001 to 2015.
We identified four clusters of health trajectories for men and eight for women.
Childhood and adult socioeconomic factors shape health trajectories at older ages.
There is no simple monotonic relation between life-course circumstances and health.
Funding
This work was supported by:
ANID/Millennium Science Initiative/Grant NCS17_062 ‘Millennium Nucleus for the Study of the Life Course and Vulnerability (MLIV)’
ANID/FONDECYT/INICIACION/N°11180360
ANID/FONDAP/Nº15130009
Appendices
Appendix A.

Solution of weighted types of health trajectories for men and women with imputation and with no imputation on missing values
Appendix B.

Results of average silhouette width index (A) and weighted types of health trajectories over the whole sample (women and men together) (B)
Appendix C.
Unweighted descriptive statistics of the whole sample and across men and women
| Whole Sample | Men | Women | p-value | |
|---|---|---|---|---|
| Age (Mean, SD) | 55.6 (1.63) | 55.5 (1.65) | 55.6 (1.62) | 0.351 |
| Self-reported health | ||||
| Baseline observation (%) | ||||
| Excellent | 2.3 | 3.0 | 1.6 | <0.001 |
| Very good | 4.6 | 6.2 | 3.2 | |
| Good | 31.5 | 35.5 | 28.1 | |
| Fair | 44.8 | 39.1 | 49.8 | |
| Poor | 12.7 | 10.5 | 14.6 | |
| Deceased | 0.0 | 0.0 | 0.0 | |
| Last observation (%) | ||||
| Excellent | 2.2 | 2.4 | 2.0 | <0.001 |
| Very good | 2.0 | 2.8 | 1.4 | |
| Good | 19.4 | 21.5 | 17.7 | |
| Fair | 42.8 | 40.6 | 44.8 | |
| Poor | 13.0 | 11.0 | 14.8 | |
| Deceased | 15.8 | 18.2 | 13.7 | |
| Childhood SEP | ||||
| Mother’s education (%) | ||||
| None | 48.4 | 49.3 | 47.7 | 0.210 |
| Some elementary | 28.9 | 27.0 | 30.5 | |
| Complete elementary | 11.1 | 12.0 | 10.3 | |
| More than elementary | 4.0 | 3.8 | 4.1 | |
| Missing | 7.6 | 7.9 | 7.4 | |
| Father’s education (%) | ||||
| None | 40.0 | 43.0 | 37.5 | 0.152 |
| Some elementary | 31.3 | 30.1 | 32.4 | |
| Complete elementary | 10.1 | 9.9 | 10.3 | |
| More than elementary | 6.6 | 6.6 | 6.6 | |
| Missing | 12.0 | 10.4 | 13.2 | |
| Living conditions (0–6)† (Mean, SD) | 2.06 (1.52) | 2.12 (1.50) | 2.00 (1.53) | 0.059 |
| Illnesses (0–5)ǂ (Mean, SD) | 0.08 (0.32) | 0.08 (0.33) | 0.07 (0.31) | 0.403 |
| Adult SEP | ||||
| Education (%) | ||||
| None | 18.6 | 17.0 | 20.0 | <0.001 |
| Primary | 57.4 | 56.5 | 58.1 | |
| Secondary | 17.9 | 17.6 | 18.1 | |
| Tertiary | 6.2 | 8.9 | 3.0 | |
| Missing | 0.0 | 0.0 | 0.0 | |
| Employment status‡ (%) | ||||
| Employed | 70.4 | 80.8 | 5.4 | 0.009 |
| Unemployed | 11.1 | 18.1 | 64.6 | |
| Missing | 18.5 | 1.1 | 30.0 | |
| Occupation (%) | ||||
| Self-employed | 37.7 | 43.4 | 25.9 | <0.001 |
| Employee | 42.7 | 53.9 | 44.2 | |
| Unemployed | 4.2 | 2.0 | 4.6 | |
| Missing | 15.4 | 0.7 | 25.3 | |
| Economic status‡ | 2.09 (0.64) | 2.09 (0.07) | 2.08 (0.06) | 0.825 |
| Sample size (n) | 2,480 | 1,154 | 1,326 |
Notes: SD: standard deviation; SEP: socioeconomic position.
Living conditions before the age of 10 years were measured as the sum of six indicator variables (1=yes; 0=no), with higher scores indicating a more disadvantaged childhood.
Total number of illnesses that person had before the age of 10 years as the sum of five indicator variables for serious childhood illnesses (range 0–5, higher score indicates poorer health).
Measured at baseline *p-values testing differences of all variables by gender.
Appendix D.
Weighted bivariate analysis among older adult men (n=1,154)
| Self-reported health trajectories | i. Declining good to regular | ii. Stable regular | iii. Intermittent poor-regular | iv. Deceased early 70 | p-value |
|---|---|---|---|---|---|
| Sample size (%) | 38.4 | 39.9 | 9.0 | 12.7 | |
| Childhood SEP | |||||
| Mother’s education (%) | |||||
| None | 34.7 | 40.6 | 11.8 | 12.9 | 0.122 |
| Some elementary | 44.0 | 38.9 | 4.8 | 12.2 | |
| Complete elementary | 43.5 | 39.2 | 2.0 | 15.3 | |
| More than elementary | 67.3 | 8.5 | 12.1 | 12.0 | |
| Father’s education (%) | |||||
| None | 35.6 | 41.0 | 11.1 | 12.4 | 0.272 |
| Some elementary | 39.0 | 43.5 | 7.5 | 10.1 | |
| Complete elementary | 39.3 | 43.8 | 0.1 | 15.9 | |
| More than elementary | 55.2 | 16.8 | 6.8 | 21.1 | |
| Living conditions (mean) | 1.75 (1.36) | 2.45 (1.56) | 3.19 (1.48) | 1.77 (1.56) | <0.001 |
| Illnesses (mean) | 0.08 (0.38) | 0.09 (0.31) | 0.04 (0.21) | 0.11 (0.37) | 0.434 |
| Adult SEP | |||||
| Educational level (%) | |||||
| None | 32.7 | 39.6 | 15.8 | 11.9 | <0.001 |
| Primary | 34.0 | 47.2 | 9.4 | 9.4 | |
| Secondary | 53.3 | 29.4 | 1.0 | 16.1 | |
| Tertiary | 52.2 | 6.5 | 7.3 | 34.0 | |
| Employment status (%) | |||||
| Employed | 40.2 | 39.5 | 8.3 | 12.0 | 0.420 |
| Unemployed | 30.7 | 42.0 | 13.0 | 12.4 | |
| Occupation (%) | |||||
| Self-employed | 40.4 | 40.8 | 10.1 | 8.7 | 0.156 |
| Employee | 37.9 | 38.4 | 7.6 | 16.0 | |
| Unemployed | 14.9 | 62.7 | 18.6 | 3.7 | |
| Economic status (mean) | 2.31 (0.70) | 1.92 (0.54) | 1.70 (0.49) | 2.23 (0.82) | <0.001 |
Notes: Weighted percentages and means of imputed data. Standard deviations in parentheses. P-values of the ANOVA and χ2 test as corresponding. Employment status and economic situation were measured in the initial observation year. SEP: Socioeconomic position.
Appendix E.
Unweighted bivariate analysis among older adult men (n=1,154)
| Self-reported health trajectories | i. Declining good to regular | ii. Stable regular | iii. Intermittent poor-regular | iv. Deceased early 70 | p-value |
|---|---|---|---|---|---|
| Sample size (%) | 37.6 | 41.5 | 6.8 | 14.1 | |
| Childhood SEP | |||||
| Mother’s education (%) | |||||
| None | 33.2 | 44.3 | 8.3 | 14.2 | <0.001 |
| Some elementary | 41.3 | 40.4 | 4.8 | 13.5 | |
| Complete elementary | 49.3 | 32.6 | 3.6 | 14.5 | |
| More than elementary | 65.9 | 15.9 | 2.3 | 15.9 | |
| Father’s education (%) | |||||
| None | 33.2 | 43.5 | 8.3 | 14.9 | <0.001 |
| Some elementary | 37.8 | 44.7 | 5.8 | 11.8 | |
| Complete elementary | 51.8 | 28.9 | 2.6 | 16.7 | |
| More than elementary | 63.2 | 19.7 | 2.6 | 14.8 | |
| Living conditions (mean) | 1.82 (1.41) | 2.36 (1.51) | 2.87 (1.47) | 1.84 (1.45) | <0.001 |
| Illnesses (mean) | 0.06 (0.30) | 0.09 (0.35) | 0.09 (0.30) | 0.10 (0.34) | 0.434 |
| Adult SEP | |||||
| Educational level (%) | |||||
| None | 25.0 | 43.4 | 17.3 | 14.3 | <0.001 |
| Primary | 31.7 | 48.6 | 6.0 | 13.7 | |
| Secondary | 53.7 | 29.1 | 1.5 | 15.8 | |
| Tertiary | 67.0 | 17.5 | 1.9 | 13.6 | |
| Employment status (%) | |||||
| Employed | 40.1 | 41.5 | 6.3 | 12.1 | <0.001 |
| Unemployed | 26.8 | 41.6 | 9.1 | 22.4 | |
| Occupation (%) | |||||
| Self-employed | 38.3 | 42.5 | 7.8 | 11.0 | 0.103 |
| Employee | 37.6 | 40.4 | 5.8 | 16.2 | |
| Unemployed | 30.4 | 52.2 | 13.0 | 4.3 | |
| Economic status (mean) | 2.29 (0.68) | 1.98 (0.55) | 1.66 (0.58) | 2.07 (0.73) | <0.001 |
Notes: Weighted percentages and means of imputed data. Standard deviations are shown in parentheses. P-values of the ANOVA and χ2 test as corresponding. Employment status and economic situation were measured in the initial observation year. SEP: Socioeconomic position.
Appendix F.
Weighted bivariate analysis among older adult women (n=1,326)
| Self-reported health trajectories | i. Stable good | ii. Improving regular to good | iii. Intermittent regular-good | iv. Declining good to regular | v. Stable regular | vi. Intermittent regular-poor | vii. Intermittent poor- regular | viii. Deceased early 70 | p-value |
|---|---|---|---|---|---|---|---|---|---|
| Sample size (%) | 14.4 | 7.2 | 10.8 | 17.7 | 17.9 | 16.4 | 6.6 | 9.0 | |
| Childhood SEP | |||||||||
| Mother’s education (%) | |||||||||
| None | 10.9 | 8.6 | 9.6 | 19.0 | 17.2 | 18.0 | 7.1 | 9.8 | 0.001 |
| Some elementary | 11.8 | 5.8 | 13.2 | 19.0 | 22.4 | 16.0 | 5.1 | 6.9 | |
| Complete elementary | 31.6 | 3.3 | 11.1 | 11.8 | 21.4 | 10.8 | 3.6 | 6.3 | |
| More than elementary | 48.8 | 2.3 | 16.9 | 12.8 | 1.0 | 7.4 | 3.0 | 7.7 | |
| Father’s education (%) | |||||||||
| None | 10.9 | 8.8 | 9.8 | 16.9 | 17.0 | 21.4 | 6.1 | 9.1 | 0.006 |
| Some elementary | 12.7 | 7.2 | 11.1 | 19.3 | 24.4 | 11.0 | 6.6 | 7.7 | |
| Complete elementary | 30.0 | 4.1 | 16.8 | 16.9 | 17.8 | 6.1 | 2.9 | 5.4 | |
| More than elementary | 39.0 | 2.1 | 12.3 | 16.3 | 8.1 | 16.1 | 0.4 | 5.8 | |
| Living conditions (mean) | 1.27 (1.40) | 2.43 (1.76) | 1.90 (1.33) | 2.39 (1.86) | 2.28 (1.78) | 2.92 (1.67) | 2.65 (1.67) | 2.27 (1.55) | <0.001 |
| Illnesses (mean) | 0.02 (0.14) | 0.07 (0.27) | 0.05 (0.21) | 0.02 (0.14) | 0.10 (0.32) | 0.06 (0.25) | 0.21 (0.42) | 0.12 (0.44) | <0.001 |
| Adult SEP | |||||||||
| Education (%) | |||||||||
| None | 8.3 | 7.4 | 11.4 | 10.3 | 18.5 | 25.1 | 9.0 | 9.9 | <0.001 |
| Primary | 10.9 | 7.5 | 10.3 | 21.4 | 20.7 | 15.1 | 5.5 | 8.6 | |
| Secondary | 29.0 | 7.2 | 12.2 | 20.5 | 6.7 | 6.6 | 7.5 | 10.3 | |
| Tertiary | 78.0 | 1.7 | 8.5 | 3.8 | 2.3 | 2.6 | 0.0 | 2.9 | |
| Employment status (%) | |||||||||
| Employed | 19.3 | 6.3 | 12.1 | 16.4 | 15.0 | 18.0 | 6.7 | 6.2 | 0.024 |
| Unemployed | 1.9 | 1.6 | 9.8 | 12.2 | 37.3 | 9.8 | 11.4 | 16.1 | |
| Occupation (%) | |||||||||
| Self-employed | 10.6 | 5.2 | 14.2 | 24.0 | 20.9 | 14.9 | 6.2 | 4.0 | 0.102 |
| Employee | 20.4 | 6.4 | 11.4 | 14.8 | 14.2 | 16.3 | 7.5 | 9.0 | |
| Unemployed | 20.2 | 4.3 | 8.3 | 3.7 | 19.0 | 32.1 | 3.5 | 8.9 | |
| Economic status (mean) | 2.49 (0.76) | 1.99 (0.52) | 1.98 (0.65) | 2.08 (0.68) | 2.02 (0.41) | 1.87 (0.51) | 1.61 (0.55) | 1.93 (0.53) | <0.001 |
Notes: Weighted percentages and means of imputed data. Standard deviations in parenthesis. P-values of the ANOVA and χ2 test as corresponding. Employment status and economic situation measured in the initial observation year. SEP: Socioeconomic position.
Appendix G.
Unweighted bivariate analysis among older adult women (n=1,326)
| Self-reported health trajectories | i. Stable good | ii. Improving regular to good | iii. Intermittent regular-good | iv. Declining good to regular | v. Stable regular | vi. Intermittent regular-poor | vii. Intermittent poor- regular | viii. Deceased early 70 | p-value |
|---|---|---|---|---|---|---|---|---|---|
| Sample size (%) | 14.4 | 7.2 | 10.8 | 17.7 | 17.9 | 16.4 | 6.6 | 9.0 | |
| Childhood SEP | |||||||||
| Mother’s education (%) | |||||||||
| None | 9.5 | 9.7 | 8.5 | 17.5 | 14.2 | 18.0 | 8.7 | 13.8 | <0.001 |
| Some elementary | 11.6 | 9.4 | 8.9 | 23.2 | 16.5 | 15.8 | 5.9 | 8.6 | |
| Complete elementary | 24.8 | 8.0 | 5.8 | 21.2 | 12.4 | 10.9 | 7.3 | 9.5 | |
| More than elementary | 35.2 | 7.4 | 9.3 | 24.1 | 3.7 | 9.3 | 1.9 | 9.3 | |
| Father’s education (%) | |||||||||
| None | 8.5 | 10.3 | 8.0 | 18.9 | 12.3 | 20.1 | 8.6 | 13.3 | <0.001 |
| Some elementary | 11.4 | 10.2 | 9.3 | 18.1 | 17.7 | 15.3 | 8.1 | 9.8 | |
| Complete elementary | 24.3 | 7.4 | 8.1 | 25.0 | 12.5 | 8.8 | 3.7 | 10.3 | |
| More than elementary | 28.7 | 6.9 | 8.0 | 27.6 | 8.0 | 11.5 | 1.1 | 8.0 | |
| Living conditions (mean) | 1.29 (1.33) | 1.97 (1.46) | 1.83 (1.39) | 1.88 (1.51) | 1.94 (1.47) | 2.51 (1.59) | 2.70 (1.58) | 2.11 (1.48) | <0.001 |
| Illnesses (mean) | 0.02 (0.19) | 0.08 (0.31) | 0.03 (0.17) | 0.03 (0.17) | 0.08 (0.32) | 0.08 (0.29) | 0.15 (0.39) | 0.14 (0.52) | <0.001 |
| Adult SEP | |||||||||
| Education (%) | |||||||||
| None | 8.3 | 7.9 | 10.2 | 12.5 | 11.3 | 23.8 | 12.1 | 14.0 | <0.001 |
| Primary | 7.8 | 10.1 | 7.4 | 21.0 | 16.9 | 17.3 | 7.7 | 11.9 | |
| Secondary | 27.5 | 10.0 | 8.8 | 24.6 | 11.7 | 6.3 | 3.8 | 7.5 | |
| Tertiary | 44.0 | 6.0 | 16.0 | 16.0 | 6.0 | 4.0 | 0.0 | 8.0 | |
| Employment status (%) | |||||||||
| Employed | 15.2 | 8.9 | 9.2 | 19.5 | 14.5 | 15.5 | 8.3 | 8.9 | 0.052 |
| Unemployed | 8.45 | 4.2 | 9.6 | 14.1 | 14.1 | 21.2 | 8.5 | 19.7 | |
| Occupation (%) | |||||||||
| Self-employed | 7.0 | 8.5 | 11.1 | 23.6 | 15.7 | 17.8 | 8.5 | 7.9 | 0.001 |
| Employee | 18.1 | 9.4 | 8.2 | 18.1 | 14.0 | 14.3 | 8.0 | 9.9 | |
| Unemployed | 16.4 | 6.6 | 9.8 | 11.5 | 13.1 | 26.2 | 4.9 | 11.5 | |
| Economic status (mean) | 2.50 (0.71) | 2.02 (0.51) | 2.17 (0.73) | 2.14 (0.64) | 2.08 (0.55) | 1.90 (0.53) | 1.72 (0.53) | 2.02 (0.60) | <0.001 |
Notes: Weighted percentages and means of imputed data. Standard deviations are shown in parenthesis. P-values of the ANOVA and χ2 test as corresponding. Employment status and economic situation measured in the initial observation year. SEP: Socioeconomic position.
Appendix H.

Three-cluster solution of weighted types of health trajectories for women
Appendix I.
Weighted multinomial regression (odds ratios) among older women (n=1,326) using the three-cluster solution of weighted types of health trajectories for women
| Self-reported health trajectory types (ref: cluster i) | Cluster ii | Cluster iii | ||
|---|---|---|---|---|
| Childhood SEP | ||||
| Mother’s education | ||||
| None or some elementary (ref) | 0 | 0 | ||
| Complete or more than elementary | 0.416 *** | (0.017) | 0.885* | (0.019) |
| Father’s education | ||||
| None or some elementary (ref) | 0 | 0 | ||
| Complete or more than elementary | 2.097*** | (0.018) | 1.842*** | (0.020) |
| Living conditions | 0.951*** | (0.003) | 0.687*** | (0.004) |
| Illnesses | 0.320*** | (0.011) | 0.043*** | (0.034) |
| Adult SEP | ||||
| Educational level | ||||
| None or primary (ref) | 0 | 0 | ||
| Secondary or tertiary | 0.480*** | (0.013) | 0.615*** | (0.015) |
| Employment status | ||||
| Employed | 1.528*** | (0.012) | 20.717*** | (0.030) |
| Unemployed (ref) | 0 | 0 | ||
| Occupation | ||||
| Self-employed | 1.771*** | (0.009) | 1.397*** | (0.011) |
| Employee (ref) | 0 | 0 | ||
| Unemployed | 1.000*** | (0.016) | 1.801*** | (0.018) |
| Economic status | 3.079*** | (0.008) | 7.492*** | (0.010) |
| Constant | 0.582*** | (0.020) | 0.003*** | (0.037) |
| Akaike Information Criterion | ||||
Notes: Standard deviations are shown in brackets. Employment status was measured in the initial observation year.
P-values: *p<0.1; **p<0.05; ***p<0.001.
SEP: Socioeconomic position.
Appendix J.
Weighted association between childhood and adult socioeconomic position.
| Adult SEP | ||||||
|---|---|---|---|---|---|---|
| Educational level | ||||||
| Men | Women | |||||
| None or primary | Secondary or tertiary | p-value | None or primary | Secondary or tertiary | p-value | |
| Childhood SEP | ||||||
| Mother’s education (% row) | ||||||
| None or some elementary | 84.2 | 15.8 | <0.001 | 91.7 | 8.3 | <0.001 |
| Complete or more than elementary | 28.8 | 71.2 | 36.9 | 63.1 | ||
| Father’s education (% row) | ||||||
| None or some elementary | 84.5 | 15.5 | <0.001 | 92.4 | 7.6 | <0.001 |
| Complete or more than elementary | 33.6 | 66.4 | 42.7 | 57.3 | ||
Notes: Weighted percentages and means of imputed data. P-values of the χ2 test. SEP: Socioeconomic position.
Footnotes
There is no legal retirement age in Mexico. Individuals often retire from the labor force at age 65, conditional on a contribution period of about 24 years in formal employment (OECD, 2019), although a large proportion of the population remains in informal employment (ILO, 2020).
A solution with higher number of clusters does not necessarily lead to a better solution in the overall ASW index (i.e., closer to 1). For instance, in a solution with many split clusters, some clusters may include individuals weakly similar to each other (with a low ASW) and other clusters may include very similar individuals (with a high ASW) (Rousseeuw, 1987). This would result in an overall low ASW. The purpose of this index is not to find the smallest or greatest possible number of distinct clusters, but the cluster solution with the best overall ASW.
The choice of the number of clusters is one of the critical parts of sequence analysis. We chose the number of clusters driven exclusively by statistical cluster cut-off criteria. There is always a trade-off when one decides on choosing a cluster-solution with several groups, as for women in our study, particularly when there is heterogeneous distribution of individuals across clusters. However, distribution of women across clusters in our study remains fairly stable, ranging from 6.6% to 17.9%.
See appendix I for weighted multinomial regression among older women using the three-cluster solution of weighted types of health trajectories for women.
Appendices F and G show that unweighted analyses underestimated the magnitude of the associations between SEP and adult self-reported health trajectories compared to the weighted analysis, however, the associations showed the same trends.
Contributor Information
Alejandra Letelier, Instituto de Odontoestomatología, Facultad de Medicina, Universidad Austral de Chile, Valdivia, Chile; Millennium Nucleus for the Study of the Life Course and Vulnerability (MLIV), Santiago, Chile.
Ignacio Madero-Cabib, Instituto de Sociología & Departamento de Salud Pública, Pontificia Universidad Católica de Chile, Santiago, Chile; Millennium Nucleus for the Study of the Life Course and Vulnerability (MLIV), Santiago, Chile.
Eduardo A. Undurraga, Escuela de Gobierno, Pontificia Universidad Católica de Chile, Santiago, Chile; Millennium Nucleus for the Study of the Life Course and Vulnerability (MLIV), Chile..
Pedro Pérez-Cruz, Departamento de Medicina Interna, Pontificia Universidad Católica de Chile, Santiago, Chile.; Millennium Nucleus for the Study of the Life Course and Vulnerability (MLIV), Chile.
References
- Aguila E (2014). Male labor force participation and social security in Mexico. Journal of pension economics & finance, 13, 145. [DOI] [PMC free article] [PubMed] [Google Scholar]
- Aisenbrey S, & Fasang AE (2010). New life for old ideas: The” second wave” of sequence analysis bringing the” course” back into the life course. Sociological Methods & Research, 38, 420–462. [Google Scholar]
- Alderman H, & King EM (1998). Gender differences in parental investment in education. Structural Change and Economic Dynamics, 9, 453–468. [Google Scholar]
- Angel JL, Vega W, & López-Ortega M (2017). Aging in Mexico: Population trends and emerging issues. The Gerontologist, 57, 153–162. [DOI] [PMC free article] [PubMed] [Google Scholar]
- Anson O, Paran E, Neumann L, & Chernichovsky D (1993). Gender differences in health perceptions and their predictors. Social Science & Medicine, 36, 419–427. [DOI] [PubMed] [Google Scholar]
- Arber S, & Ginn J (1993). Gender and inequalities in health in later life. Social Science & Medicine, 36, 33–46. [DOI] [PubMed] [Google Scholar]
- Atun R, De Andrade LOM, Almeida G, Cotlear D, Dmytraczenko T, Frenz P, Garcia P, Gómez-Dantés O, Knaul FM, et al. (2015). Health-system reform and universal health coverage in Latin America. The Lancet, 385, 1230–1247. [DOI] [PubMed] [Google Scholar]
- Barquera S, Hernández-Barrera L, Trejo-Valdivia B, Shamah T, Campos-Nonato I, & Rivera-Dommarco J (2020). Obesidad en México, prevalencia y tendencias en adultos. Ensanut 2018–19. Salud Publica De Mexico, 62. [DOI] [PubMed] [Google Scholar]
- Behrman JR (1988). Intrahousehold Allocation of Nutrients in Rural India. Are boys favored? Do Parents Exhibit Inequality Aversion? Oxford Economic Papers-New Series, 40, 32–54. [Google Scholar]
- Ben-Shlomo Y, & Kuh D (2002). A life course approach to chronic disease epidemiology: conceptual models, empirical challenges and interdisciplinary perspectives. International Journal of Epidemiology, 31, 285–293. [PubMed] [Google Scholar]
- Ben-Shlomo Y, Mishra G, & Kuh D (2014). Life course epidemiology. Handbook of epidemiology, 1521–1549. [Google Scholar]
- Bernardi L, Huinink J, & Settersten RA Jr (2019). The life course cube: A tool for studying lives. Advances in Life Course Research, 41, 100258. [DOI] [PubMed] [Google Scholar]
- Brunner E (1997). Socioeconomic determinants of health. Stress and the biology of inequality. British Medical Journal, 314, 1472–1476. [DOI] [PMC free article] [PubMed] [Google Scholar]
- Buchmann C (1996). The debt crisis, structural adjustment and women’s education. International Journal of Comparative Sociology, 37, 5–30. [Google Scholar]
- Bustos-Vázquez E, Fernández-Niño JA, & Astudillo-Garcia CI (2017). Self-rated health, multimorbidity and depression in Mexican older adults: Proposal and evaluation of a simple conceptual model. Biomedica, 37, 92–103. [DOI] [PubMed] [Google Scholar]
- Butcher KF, & Case A (1994). The effect of sibling sex composition on women’s education and earnings. The Quarterly Journal of Economics, 109, 531–563. [Google Scholar]
- Buuren S. v., & Groothuis-Oudshoorn K (2010). mice: Multivariate imputation by chained equations in R. Journal of Statistical Software, 1–68. [Google Scholar]
- Caballero R, De León EM, San Martín AH, & Villaseñor A (1999). El consumo de tabaco, alcohol y drogas ilegales, en los adolescentes de diferentes estratos socioeconómicos de Guadalajara. Salud Mental, 22, 1–8. [Google Scholar]
- Case A, & Deaton AS (2005). Broken down by work and sex: How our health declines. In Analyses in the Economics of Aging (pp. 185–212): University of Chicago Press. [Google Scholar]
- Chandola T, & Jenkinson C (2000). Validating self-rated health in different ethnic groups. Ethnicity & Health, 5, 151–159. [DOI] [PubMed] [Google Scholar]
- Consejo Nacional de Población. (2000). Envejecimento demográfico de México: retos y perspectivas. Por una sociedad para todas las edades. Mexico: CONAPO. [Google Scholar]
- Cullati S, Rousseaux E, Gabadinho A, Courvoisier DS, & Burton-Jeangros C (2014). Factors of change and cumulative factors in self-rated health trajectories: A systematic review. Advances in Life Course Research, 19, 14–27. [DOI] [PubMed] [Google Scholar]
- Cunningham SA, Patel SA, Beckles GL, Geiss LS, Mehta N, Xie H, & Imperatore G (2018). County-level contextual factors associated with diabetes incidence in the United States. Annals of epidemiology, 28, 20–25.e22. [DOI] [PMC free article] [PubMed] [Google Scholar]
- Curtis S, & Lawson K (2000). Gender, ethnicity and self-reported health: the case of African–Caribbean populations in London. Social Science & Medicine, 50, 365–385. [DOI] [PubMed] [Google Scholar]
- Dannefer D (2003). Cumulative advantage/disadvantage and the life course: Cross-fertilizing age and social science theory. The Journals of Gerontology Series B: Psychological Sciences and Social Sciences, 58, S327–S337. [DOI] [PubMed] [Google Scholar]
- de Meijer C, Wouterse B, Polder J, & Koopmanschap M (2013). The effect of population aging on health expenditure growth: a critical review. European Journal of Ageing, 10, 353–361. [DOI] [PMC free article] [PubMed] [Google Scholar]
- De Souza LR, Queiroz BL, & Skirbekk VF (2019). Trends in health and retirement in Latin America: Are older workers healthy enough to extend their working lives? The Journal of the Economics of Ageing, 13, 72–83. [DOI] [PMC free article] [PubMed] [Google Scholar]
- Deaton A (2003). Health, inequality, and economic development. Journal of Economic Literature, 41, 113–158. [Google Scholar]
- Deaton A (2013). The great escape: health, wealth, and the origins of inequality. Princeton, NJ: Princeton University Press. [Google Scholar]
- Deaton A, & Paxson C (2001). Mortality, education, income, and inequality among American cohorts. In Wise DA (Ed.), Themes in the Economics of Aging (pp. 129–170). Chicago, IL: University of Chicago Press. [Google Scholar]
- Demakakos P, Biddulph JP, Bobak M, & Marmot MG (2016). Wealth and mortality at older ages: a prospective cohort study. Journal of Epidemiology and Community Health, 70, 346–353. [DOI] [PMC free article] [PubMed] [Google Scholar]
- Dicker D, Nguyen G, Abate D, Abate KH, Abay SM, Abbafati C, Abbasi N, Abbastabar H, Abd-Allah F, et al. (2018). Global, regional, and national age-sex-specific mortality and life expectancy, 1950–2017: a systematic analysis for the Global Burden of Disease Study 2017. The Lancet, 392, 1684–1735. [DOI] [PMC free article] [PubMed] [Google Scholar]
- Dupre ME (2007). Educational differences in age-related patterns of disease: reconsidering the cumulative disadvantage and age-as-leveler hypotheses. Journal of Health and Social Behavior, 48, 1–15. [DOI] [PubMed] [Google Scholar]
- Feinstein L (2000). The relative economic importance of academic, psychological and behavioural attributes developed on childhood: Centre for Economic Performance, London School of Economics and Political … [Google Scholar]
- Ferraro KF, Farmer MM, & Wybraniec JA (1997). Health trajectories: long-term dynamics among black and white adults. Journal of Health and Social Behavior, 38–54. [PubMed] [Google Scholar]
- Fox J, & Hong J (2009). Effect displays in R for multinomial and proportional-odds logit models: Extensions to the effects package. Journal of Statistical Software, 32, 1–24. [Google Scholar]
- Gabadinho A, Ritschard G, Mueller NS, & Studer M (2011). Analyzing and visualizing state sequences in R with TraMineR. Journal of Statistical Software, 40, 1–37. [Google Scholar]
- Galobardes B, Shaw M, Lawlor DA, Lynch JW, & Smith GD (2006). Indicators of socioeconomic position (part 1). Journal of Epidemiology & Community Health, 60, 7–12. [DOI] [PMC free article] [PubMed] [Google Scholar]
- Garg A, & Morduch J (1998). Sibling rivalry and the gender gap: Evidence from child health outcomes in Ghana. Journal of Population Economics, 11, 471–493. [DOI] [PubMed] [Google Scholar]
- Godoy RA, Reyes-Garcia V, McDade T, Tanner S, Leonard WR, Huanca T, Vadez V, & Patel K (2006). Why do mothers favor girls and fathers, boys? A hypothesis and a test of investment disparity. Human Nature, 17, 169–189. [DOI] [PubMed] [Google Scholar]
- Gosselin A, du Loû AD, & Lelièvre E (2018). How to use sequence analysis for life course epidemiology? An example on HIV-positive Sub-Saharan migrants in France. J Epidemiol Community Health, 72, 507–512. [DOI] [PubMed] [Google Scholar]
- Haas S (2008). Trajectories of functional health: The ‘long arm’of childhood health and socioeconomic factors. Social Science & Medicine, 66, 849–861. [DOI] [PubMed] [Google Scholar]
- Hankivsky O (2012). Women’s health, men’s health, and gender and health: Implications of intersectionality. Social Science & Medicine, 74, 1712–1720. [DOI] [PubMed] [Google Scholar]
- Henrich J, Heine SJ, & Norenzayan A (2010). Most people are not WEIRD. Nature, 466, 29–29. [DOI] [PubMed] [Google Scholar]
- Hu Y, van Lenthe FJ, Borsboom GJ, Looman CW, Bopp M, Burström B, Dzúrová D, Ekholm O, Klumbiene J, et al. (2016). Trends in socioeconomic inequalities in self-assessed health in 17 European countries between 1990 and 2010. J Epidemiol Community Health, 70, 644–652. [DOI] [PubMed] [Google Scholar]
- Huisman M, Kunst AE, & Mackenbach JP (2003). Socioeconomic inequalities in morbidity among the elderly; a European overview. Social Science & Medicine, 57, 861–873. [DOI] [PubMed] [Google Scholar]
- Hunt SM, McEwen J, & McKenna SP (1984). Perceived health: age and sex comparisons in a community. Journal of Epidemiology & Community Health, 38, 156–160. [DOI] [PMC free article] [PubMed] [Google Scholar]
- Idler EL (2003). Discussion: gender differences in self-rated health, in mortality, and in the relationship between the two. The Gerontologist, 43, 372–375. [Google Scholar]
- Idler EL, & Benyamini Y (1997). Self-rated health and mortality: a review of twenty-seven community studies. Journal of Health and Social Behavior, 21–37. [PubMed] [Google Scholar]
- Idler EL, & Kasl SV (1995). Self-ratings of health: do they also predict change in functional ability? The Journals of Gerontology Series B: Psychological Sciences and Social Sciences, 50, S344–S353. [DOI] [PubMed] [Google Scholar]
- International Labour Office (ILO). (2020). World Employment Social Outlook. In (pp. 121). Geneva: International Labour Office. [Google Scholar]
- Jackman MR, & Jackman RW (1973). An interpretation of the relation between objective and subjective social status. American Sociological Review, 569–582. [PubMed] [Google Scholar]
- Jivraj S, Goodman A, Ploubidis GB, & de Oliveira C (2017). Testing comparability between retrospective life history data and prospective birth cohort study data. The Journals of Gerontology: Series B. [DOI] [PMC free article] [PubMed] [Google Scholar]
- Kaplan GA, & Camacho T (1983). Perceived health and mortality: a nine-year follow-up of the human population laboratory cohort. American Journal of Epidemiology, 117, 292–304. [DOI] [PubMed] [Google Scholar]
- Krieger N, Williams DR, & Moss NE (1997). Measuring social class in US public health research: concepts, methodologies, and guidelines. Annual Review of Public Health, 18, 341–378. [DOI] [PubMed] [Google Scholar]
- Kuh D, Ben-Shlomo Y, Lynch J, Hallqvist J, & Power C (2003). Life course epidemiology. Journal of Epidemiology and Community Health, 57, 778. [DOI] [PMC free article] [PubMed] [Google Scholar]
- Lee Y (2000). The predictive value of self assessed general, physical, and mental health on functional decline and mortality in older adults. Journal of Epidemiology & Community Health, 54, 123–129. [DOI] [PMC free article] [PubMed] [Google Scholar]
- Leinonen R, Heikkinen E, & Jylhä M (1998). Self-rated health and self-assessed change in health in elderly men and women—a five-year longitudinal study. Social Science & Medicine, 46, 591–597. [DOI] [PubMed] [Google Scholar]
- Levy R, Deschamps J-C, Elcheroth G, Forney Y, Gauthier J, Ghisletta P, Kellerhals J, Lalive d’Epinay C, Le Goff J-M, et al. (2005). Why look at life courses in an interdisciplinary perspective? Toward an interdisciplinary perspective on the life course, 10, 3–32. [Google Scholar]
- Lobmayer P, & Wilkinson RG (2002). Inequality, residential segregation by income, and mortality in US cities. Journal of Epidemiology and Community Health, 56, 183–187. [DOI] [PMC free article] [PubMed] [Google Scholar]
- Lozano R, Fullman N, Mumford JE, Knight M, Barthelemy CM, Abbafati C, Abbastabar H, Abd-Allah F, Abdollahi M, et al. (2020). Measuring universal health coverage based on an index of effective coverage of health services in 204 countries and territories, 1990–2019: a systematic analysis for the Global Burden of Disease Study 2019. The Lancet, 396, 1250–1284. [DOI] [PMC free article] [PubMed] [Google Scholar]
- Lynch J, Smith GD, Harper S, Hillemeier M, Ross N, Kaplan GA, & Wolfson M (2004). Is income inequality a determinant of population health? Part 1. A systematic review. Milbank Quarterly, 82, 5–99. [DOI] [PMC free article] [PubMed] [Google Scholar]
- Lynch JW, Smith GD, Kaplan GA, & House JS (2000). Income inequality and mortality: importance to health of individual income, psychosocial environment, or material conditions. British Medical Journal, 320, 1200–1204. [DOI] [PMC free article] [PubMed] [Google Scholar]
- MacIndoe H, & Abbott A (2004). Sequence analysis and optimal matching techniques for social science data: Sage Research Methods. [Google Scholar]
- Madero-Cabib I, Azar A, & Pérez-Cruz P (2019). Advantages and disadvantages across the life course and health status in old age among women in Chile. International journal of public health, 64, 1203–1214. [DOI] [PubMed] [Google Scholar]
- Madero-Cabib I, & Fasang AE (2016). Gendered work–family life courses and financial well-being in retirement. Advances in Life Course Research, 27, 43–60. [Google Scholar]
- Markides K, Salinas J, & Sheffield K (2008). The health of older immigrants. Generations, 32, 46–52. [Google Scholar]
- Marmot MG (2005). Social determinants of health inequalities. The Lancet, 365, 1099–1104. [DOI] [PubMed] [Google Scholar]
- Marmot MG, & Shipley M. J. w. (1996). Do socioeconomic differences in mortality persist after retirement? 25 year follow up of civil servants from the first Whitehall study. BMJ, 313, 1177–1180. [DOI] [PMC free article] [PubMed] [Google Scholar]
- McDonough P, & Berglund P (2003). Histories of poverty and self-rated health trajectories. Journal of Health and Social Behavior, 198–214. [PubMed] [Google Scholar]
- McDonough P, Sacker A, & Wiggins RD (2005). Time on my side? Life course trajectories of poverty and health. Social Science & Medicine, 61, 1795–1808. [DOI] [PubMed] [Google Scholar]
- McDonough P, Worts D, & Sacker A (2010). Socioeconomic inequalities in health dynamics: a comparison of Britain and the United States. Social Science & Medicine, 70, 251–260. [DOI] [PubMed] [Google Scholar]
- Monroy C, & Trines S (2019). Education in Mexico. In (Vol. 2020): WENR. [Google Scholar]
- Mortensen LH, Rehnberg J, Dahl E, Diderichsen F, Elstad JI, Martikainen P, Rehkopf D, Tarkiainen L, & Fritzell J (2016). Shape of the association between income and mortality: a cohort study of Denmark, Finland, Norway and Sweden in 1995 and 2003. BMJ open, 6, e010974. [DOI] [PMC free article] [PubMed] [Google Scholar]
- OECD. (2016). OECD Reviews of Health Systems: Mexico 2016. Paris: OECD Publishing. [Google Scholar]
- OECD. (2017). The Pursuit of Gender Equality-An Uphill Battle. Paris: OECD publishing. [Google Scholar]
- OECD. (2019). Pensions at a Glance 2019. OECD and G20 Indicators. Paris: OECD Publishing. [Google Scholar]
- Orozco-Rocha K, Michaels A, & Wong R (2020). Recruitment and retention in aging research. In Gu D & Dupre ME (Eds.), Encyclopedia of Gerontology and Population Aging: Springer International Publishing. [Google Scholar]
- Orozco-Rocha K, Wong R, & Obregón AM (2018). Attrition in panel surveys in Mexico: The Mexican Health and Aging Study (MHAS). Realidad, Datos y Espacio: Revista Internacional de Estadistica y Geografia, 9, 64–83. [PMC free article] [PubMed] [Google Scholar]
- Payne G, Laporte A, Deber R, & Coyte PC (2007). Counting backward to health care’s future: using time-to-death modeling to identify changes in end-of-life morbidity and the impact of aging on health care expenditures. The Milbank Quarterly, 85, 213–257. [DOI] [PMC free article] [PubMed] [Google Scholar]
- Pickett KE, & Wilkinson RG (2015). Income inequality and health: a causal review. Social Science & Medicine, 128, 316–326. [DOI] [PubMed] [Google Scholar]
- Post D (2001). Region poverty, sibship, and gender inequality in Mexican education - Will targeted welfare policy make a difference for girls? Gender & Society, 15, 468–489. [Google Scholar]
- Qian N (2008). Missing women and the price of tea in China: The effect of sex-specific earnings on sex imbalance. The Quarterly Journal of Economics, 123, 1251–1285. [Google Scholar]
- Queiroz B (2017). Public pensions, economic development, and the labor force participation of older adults in Latin America in 1990–2010. International Journal of Population Studies, 3, 121–137. [Google Scholar]
- R Core Team. (2019). R: A language and environment for statistical computing. In. Vienna: R Foundation for Statistical Computing. [Google Scholar]
- Ripley B, Venables W, & Ripley MB (2016). Package ‘nnet’. R package version, 7, 3–12. [Google Scholar]
- Riumallo-Herl C, & Aguila E (2019). The effect of old-age pensions on health care utilization patterns and insurance uptake in Mexico. BMJ Global Health, 4. [DOI] [PMC free article] [PubMed] [Google Scholar]
- Rodin J, & McAvay G (1992). Determinants of change in perceived health in a longitudinal study of older adults. Journal of Gerontology, 47, P373–P384. [DOI] [PubMed] [Google Scholar]
- Rohlfsen LS, & Jacobs Kronenfeld J (2014). Gender differences in trajectories of self-rated health in middle and old age: an examination of differential exposure and differential vulnerability. Journal of aging and health, 26, 637–662. [DOI] [PubMed] [Google Scholar]
- Ross CE, & Bird CE (1994). Sex stratification and health lifestyle: consequences for men’s and women’s perceived health. Journal of Health and Social Behavior, 161–178. [PubMed] [Google Scholar]
- Rousseeuw PJ (1987). Silhouettes: a graphical aid to the interpretation and validation of cluster analysis. Journal of computational and applied mathematics, 20, 53–65. [Google Scholar]
- Sacker A, Clarke P, Wiggins RD, & Bartley M (2005). Social dynamics of health inequalities: a growth curve analysis of aging and self assessed health in the British household panel survey 1991–2001. Journal of Epidemiology & Community Health, 59, 495–501. [DOI] [PMC free article] [PubMed] [Google Scholar]
- Sacker A, Wiggins RD, Bartley M, & McDonough P (2007). Self-rated health trajectories in the United States and the United Kingdom: a comparative study. American Journal of Public Health, 97, 812–818. [DOI] [PMC free article] [PubMed] [Google Scholar]
- Samper-Ternent R, Michaels-Obregon A, Wong R, & Palloni A (2012). Older adults under a mixed regime of infectious and chronic diseases. Salud Publica De Mexico, 54, 487–495. [DOI] [PMC free article] [PubMed] [Google Scholar]
- Semyonov M, Lewin-Epstein N, & Maskileyson D (2013). Where wealth matters more for health: The wealth–health gradient in 16 countries. Social Science & Medicine, 81, 10–17. [DOI] [PubMed] [Google Scholar]
- Sen A, & Sengupta S (1983). Malnutrition of rural children and the sex bias. Economic and political weekly, 855–864. [Google Scholar]
- Settersten RA (2003). Invitation to the life course: Toward new understandings of later life: Baywood Pub Co. [Google Scholar]
- Shuey KM, & Willson AE (2014). Economic hardship in childhood and adult health trajectories: An alternative approach to investigating life-course processes. Advances in Life Course Research, 22, 49–61. [DOI] [PMC free article] [PubMed] [Google Scholar]
- Siegel M, Luengen M, & Stock S (2013). On age-specific variations in income-related inequalities in diabetes, hypertension and obesity. International journal of public health, 58, 33–41. [DOI] [PubMed] [Google Scholar]
- Singh-Manoux A, Marmot MG, & Adler NE (2005). Does subjective social status predict health and change in health status better than objective status? Psychosomatic Medicine, 67, 855–861. [DOI] [PubMed] [Google Scholar]
- Smith JP (2009). Reconstructing childhood health histories. Demography, 46, 387–403. [DOI] [PMC free article] [PubMed] [Google Scholar]
- Smith KV, & Goldman N (2007). Socioeconomic differences in health among older adults in Mexico. Social Science & Medicine, 65, 1372–1385. [DOI] [PubMed] [Google Scholar]
- Spillman BC, & Lubitz J (2000). The effect of longevity on spending for acute and long-term care. New England Journal of Medicine, 342, 1409–1415. [DOI] [PubMed] [Google Scholar]
- Stenholm S, Kivimäki M, Jylhä M, Kawachi I, Westerlund H, Pentti J, Goldberg M, Zins M, & Vahtera J (2016). Trajectories of self-rated health in the last 15 years of life by cause of death. European Journal of Epidemiology, 31, 177–185. [DOI] [PubMed] [Google Scholar]
- Stringhini S, Carmeli C, Jokela M, Avendaño M, Muennig P, Guida F, Ricceri F, d’Errico A, Barros H, et al. (2017). Socioeconomic status and the 25 × 25 risk factors as determinants of premature mortality: a multicohort study and meta-analysis of 1.7 million men and women. The Lancet, 389, 1229–1237. [DOI] [PMC free article] [PubMed] [Google Scholar]
- Subramanian S, Delgado I, Jadue L, Vega J, & Kawachi I (2003). Income inequality and health: multilevel analysis of Chilean communities. Journal of Epidemiology & Community Health, 57, 844–848. [DOI] [PMC free article] [PubMed] [Google Scholar]
- Torres JM, Rizzo S, & Wong R (2018). Lifetime socioeconomic status and late-life health trajectories: Longitudinal results from the Mexican Health and Aging Study. The Journals of Gerontology: Series B, 73, 349–360. [DOI] [PMC free article] [PubMed] [Google Scholar]
- Undurraga EA, Behrman JR, Leonard WR, & Godoy RA (2016). The effects of community income inequality on health: evidence from a randomized control trial in the Bolivian Amazon. Social Science & Medicine, 149, 66–75. [DOI] [PMC free article] [PubMed] [Google Scholar]
- van der Linden BW, Cheval B, Sieber S, Orsholits D, Guessous I, Stringhini S, Gabriel R, Aartsen M, & Blane D (2019). Life Course Socioeconomic Conditions and Frailty at Older Ages. The Journals of Gerontology: Series B. [DOI] [PMC free article] [PubMed] [Google Scholar]
- van der Linden BW, Courvoisier DS, Cheval B, Sieber S, Bracke P, Guessous I, Burton-Jeangros C, Kliegel M, & Cullati S (2018). Effect of childhood socioeconomic conditions on cancer onset in later life: an ambidirectional cohort study. International journal of public health, 63, 799–810. [DOI] [PMC free article] [PubMed] [Google Scholar]
- van Kippersluis H, O’Donnell O, van Doorslaer E, & Van Ourti T (2010). Socioeconomic differences in health over the life cycle in an Egalitarian country. Social Science & Medicine, 70, 428–438. [DOI] [PubMed] [Google Scholar]
- Vázquez-Segovia LA, Sesma-Vázquez S, & Hernández-Avila M (2002). El consumo de tabaco en los hogares en México: resultados de la Encuesta de Ingresos y Gastos de los Hogares, 1984–2000. Salud Publica De Mexico, 44, s76–s81. [PubMed] [Google Scholar]
- Verbrugge LM (1985). Gender and health: an update on hypotheses and evidence. Journal of Health and Social Behavior, 156–182. [PubMed] [Google Scholar]
- Vlassoff C (2007). Gender differences in determinants and consequences of health and illness. Journal of Health, Population, and Nutrition, 25, 47. [PMC free article] [PubMed] [Google Scholar]
- Warner DF, & Brown TH (2011). Understanding how race/ethnicity and gender define age-trajectories of disability: An intersectionality approach. Social Science & Medicine, 72, 1236–1248. [DOI] [PMC free article] [PubMed] [Google Scholar]
- Wilkinson RG, & Pickett KE (2006). Income inequality and population health: A review and explanation of the evidence. Social Science & Medicine, 62, 1768–1784. [DOI] [PubMed] [Google Scholar]
- Wilkinson RG, & Pickett KE (2009). The spirit level: why greater equality makes societies stronger. New York: Bloomsbury Press [Google Scholar]
- Wong R, Michaels-Obregon A, & Palloni A (2015). Cohort profile: the Mexican health and aging study (MHAS). International Journal of Epidemiology, 46, e2–e2. [DOI] [PMC free article] [PubMed] [Google Scholar]
- World Bank. (2020). Rural population (% of total population) - Mexico. In (Vol. 2020). Washington DC: World Bank. [Google Scholar]
- World Health Organization. (2000). The implications for training of embracing: a life course approach to health. In. Geneva: World Health Organization. [Google Scholar]
- World Health Organization. (2018). Noncommunicable diseases country profiles 2018. In (Vol. 2021). Geneva: WHO. [Google Scholar]
- Yu S (2006). The life-course approach to health. In: American Public Health Association. [Google Scholar]
- Zabludovsky G (2007). Las mujeres en México: trabajo, educación superior y esferas de poder. Política y cultura, 09–41. [Google Scholar]
- Zunzunegui M-V, Alvarado B-E, Béland F, & Vissandjee B (2009). Explaining health differences between men and women in later life: A cross-city comparison in Latin America and the Caribbean. Social Science & Medicine, 68, 235–242. [DOI] [PubMed] [Google Scholar]