

Abstract
Background
Inflammation‐nutritional markers of peripheral blood are easily assessed and can predict survival. The aim of this study was to investigate the association between inflammation‐nutritional parameters and survival of anti‐programmed death‐1 (PD‐1) therapy in non‐small‐cell lung cancer (NSCLC) patients.
Methods
We performed a retrospective study from March 2017 to April 2020 in advanced NSCLC patients treated with PD‐1 inhibitors. Univariable and multivariable analyses were conducted to evaluate the relationship between peripheral blood parameters (absolute lymphocyte count [ALC], absolute neutrophil count [ANC], absolute monocyte count [AMC], absolute eosinocyte count [AEC], lactic dehydrogenase [LDH], plasma‐albumin [ALB], neutrophil/lymphocyte ratio [NLR], and platelet/lymphocyte ratio [PLR]) measured before therapy initiation and prognosis.
Results
Among 184 evaluable patients, 134 (72.8%) were male and the median age was 58 years (range 33–87) with 31 (16.8%) ≥70 years. An elevated ANC (≥7500/ul), NLR (≥5), and PLR (≥200) was significantly associated with worse objective response rate (ORR), progression‐free survival (PFS), and overall survival (OS), while increased ALC (≥1000/ul) and ALB (≥3.5 g/dl) could significantly improve survival in terms of ORR, PFS, and OS. In multivariate analyses, higher AEC (≥150/ul) and AMC (≥650/ul) could significantly decrease the risk of death (hazard ratio [HR] 0.363, 95% confidence interval [CI] 0.141–0.931, p = 0.035; HR 0.370, 95% CI 0.203–0.675, p = 0.001). A higher NLR and PLR, and lower ALB were independent predictors of poor prognosis for OS (HR 1.964, 95% CI 1.027–3.755, p = 0.041; HR 4.255, 95% CI 2.364–7.658, p = 0.000; HR 1.962, 95% CI 1.213–3.174, p = 0.006, respectively).
Conclusion
Our research illustrated that pretreatment AEC, AMC, ALB, NLR, and PLR are independent predictors for survival in advanced NSCLC patients treated with PD‐1 inhibitors.
Keywords: inflammation‐nutritional markers, lung cancer, PD‐1 inhibitors, predictive parameters, survival
Pretreatment absolute eosinocyte count, absolute monocyte count, plasma‐albumin, neutrophil/lymphocyte ratio, and platelet/lymphocyte ratio were independent predictors of programmed death‐1 (PD‐1) inhibitors. These markers could help clinicians identify subpopulations who were more likely to benefit from anti‐PD‐1 therapy.
INTRODUCTION
Non‐small‐cell lung cancer (NSCLC) is the leading cause of cancer‐related deaths worldwide. 1 Although the genetic pathogenesis, like the epidermal growth factor mutations or anaplastic lymphoma kinase rearrangements, in some cases were associated with NSCLC therapy development, the prognosis remains poor. 2 Recently, the therapeutic results for advanced NSCLC have been significantly improved with the use of immune checkpoint inhibitors (ICIs) targeting programmed death‐1 (PD‐1) and programmed death‐ligand 1 (PD‐L1) in various clinical research studies. 3 , 4 , 5 Despite the unprecedented response rates and survival of ICIs, these outcomes only occur in a small number of patients with a rate ranging from 15% to 40%. 6 , 7
The identification of reliable biomarkers is therefore the optimal selection of candidates for ICIs. Previous reports have suggested that several markers might be potential predictive factors for ICIs in NSCLC, including PD‐L1 expression of tumor cells, tumor mutation burden (TMB) in blood, TMB in tumor tissue, and blood‐based immune biomarkers like neutrophil‐lymphocyte ratio (NLR), platelet‐lymphocyte ratio (PLR), C‐reactive protein (CRP), etc. 8 , 9 , 10 , 11 , 12 Among these candidates, serum inflammation‐nutritional markers are measurable variables from peripheral laboratory obtained in routine clinical settings that are easy to evaluate. Many inflammatory markers are also demonstrated to have a relationship with treatment response and survival in NSCLC patients treated with anti‐PD‐1 therapy. 13 , 14 , 15 , 16 However, the precise inflammation‐nutritional markers predicting the response to PD‐1 inhibitors are still unknown. The purpose of this study was to investigate the association between immune‐inflammation‐nutritional parameters and the clinical outcome of anti PD‐1 therapy in advanced NSCLC patients.
METHODS
Patients
The study was approved by the Medical Ethical Committee of the Ethics Administration Office of West China Hospital, Sichuan University. From March 2017 to April 2020, we retrospectively analyzed NSCLC patients treated with anti‐PD‐1 therapy in our hospital. The following clinical features were included: age, sex, smoking status, performance status (PS), histological type, metastatic sites, treatment line, and PD‐L1 expression by immunohistochemistry.
Patients were enrolled in analysis if they met the following criteria: pathological diagnostic NSCLC, inoperable stage IIIB or IV based on the American Joint Committee on Cancer (AJCC) TNM classification (8th edition), 17 no less than four doses of treatments, measurable mass, and more than one therapeutic efficacy evaluation based on computerized tomography (CT). Patients were eliminated from the study if they lacked complete clinical data or had undergone radiotherapy on measurable lesions before the initial evaluation. Ultimately, 184 cases were selected in our study.
Immune‐inflammation‐nutritional parameters
Patients with available baseline laboratory tests like absolute lymphocyte count (ALC), absolute neutrophil count (ANC), absolute eosinocyte count (AEC), absolute monocyte count (AMC), lactic dehydrogenase (LDH), or plasma‐albumin (ALB) within 1 week preceding the initiation of PD‐1 inhibitors (i.e. nivolumab, pembrolizumab). NLR and PLR were calculated by dividing absolute neutrophil counts and thrombocyte counts by ALC. Patients were classified based on the prespecified cut‐off values of NLR ≥5 versus <5 and PLR ≥200 versus <200, which have been previously validated. 10 , 13 , 18 , 19 , 20 Referring to the previous articles, the cut‐off values of blood cell counts were 1000/ul for ALC, 21 , 22 7500/ul for ANC, 23 , 24 150/ul for AEC, 25 and 650/ul for AMC. 26 The cut‐off value of ALB was 3.5 g/dl. 16 LDH levels exceeding the upper limit of normal (240 U/L) were considered high. 15 , 27
Statistical analysis
Categorical variables were recorded as numbers/percentages and were compared by a Fisher's exact or chi‐square test. Overall survival (OS) was defined as the interval between the date of anti‐PD‐1 therapy initiation and any cause related death. Progression‐free survival (PFS) was defined as the time between the date of PD‐1 inhibitors starting and the date of disease progression. The therapeutic evaluation was based on the RECIST criteria version 1.1. Objective response rate (ORR) was defined as the proportion of patients who achieved a complete response (CR) or partial response (PR) in all treated patients, while the disease control rate (DCR) was defined as the proportion of patients who obtained a CR or PR or stable disease (SD) in all evaluated patients. The OS and PFS were calculated by the Kaplan–Meier method, and differences were compared via log‐rank test. Hazard ratios (HRs) and their 95% confidence intervals (CIs) were estimated using the Cox proportional hazards model in both the univariate analyses and multivariate analyses. A p value of <0.05 was considered as statistical significance. All statistical analyses were performed using the SPSS (version 25) statistics software (IBM).
RESULTS
The clinical characteristics of patients
The baseline features of 184 enrolled advanced NSCLC patients are summarized in Table 1. The median age was 58 years (range 33–87 years); most patients were male (72.8%) and smokers (66.8%). Approximately half the patients had a good performance status (49.5%), and their main pathologic types was adenocarcinoma (54.3%). The most common metastatic site was lung (63.6%) followed by lymph node (52.7%), bone (42.9%), liver (32.6%), adrenal gland (27.7%), and brain (26.6%). With regarding to PD‐L1 expression, 26.6% of cases showed low expression, 16.8% showed moderate expression, and 27.2% showed high expression. The majority of cases (72.3%) received first‐ or second‐line therapy. Ninety‐eight (53.3%) patients were treated with pembrolizumab and 86 (46.7%) patients were treated with nivolumab. Each immune‐inflammation‐nutritional parameter (ANC, ALC, AEC, AMC, NLR, PLR, LDH, ALB) was calculated and their proportions are shown in Table 1.
TABLE 1.
Clinical characteristics of patients at baseline
| Characteristics | N (%) (n = 184) |
|---|---|
| Age(years) | |
| Median (range) | 58 (33–87) |
| <70 | 153 (83.2%) |
| ≥70 | 31 (16.8%) |
| Sex | |
| Male | 134 (72.8%) |
| Female | 50 (27.2%) |
| Smoking status | |
| Smoker | 123 (66.8%) |
| Never smoked | 61 (33.2%) |
| Performance status | |
| 0 | 91 (49.5%) |
| 1 | 83 (45.1%) |
| 2 | 10 (5.4%) |
| Histological type | |
| Adenocarcinoma | 100 (54.3%) |
| Squamous cell carcinoma | 68 (37.0%) |
| Other | 16 (8.7%) |
| Metastatic sites | |
| Lung | 117 (63.6%) |
| Brain | 49 (26.6%) |
| Adrenal grand | 51 (27.7%) |
| Liver | 60 (32.6%) |
| Bone | 79 (42.9%) |
| Lymph node | 97 (52.7%) |
| PD‐L1 expression | |
| <1% | 49 (26.6%) |
| 1–49% | 31 (16.8%) |
| ≥50% | 50 (27.2%) |
| Unknown | 54 (29.3%) |
| Treatment line | |
| 1st | 60 (32.6%) |
| 2nd | 73 (39.7%) |
| 3rd | 29 (15.8%) |
| ≥4th | 22 (12.0%) |
| Previous radiotherapy | |
| Yes | 87 (47.3%) |
| No | 97 (52.7%) |
| PD‐1 inhibitors | |
| Pembrolizumab | 98 (53.3%) |
| Nivolumab | 86 (46.7%) |
| ANC | |
| <7500/ul | 141 (76.6%) |
| ≥7500/ul | 43 (23.4) |
| ALC | |
| <1000/ul | 74 (40.2%) |
| ≥1000/ul | 110 (59.8%) |
| AEC | |
| <150/ul | 15 (8.2%) |
| ≥150/ul | 169 (91.8%) |
| AMC | |
| <650/ul | 121 (65.8%) |
| ≥650/ul | 63 (34.2%) |
| NLR | |
| <5 | 115 (62.5%) |
| ≥5 | 69 (37.5%) |
| PLR | |
| <200 | 99 (53.8%) |
| ≥200 | 85 (46.2%) |
| LDH | |
| <240 U/L | 140 (76.1%) |
| ≥240 U/L | 44 (23.9%) |
| ALB | |
| <3.5 g/dl | 79 (42.9%) |
| ≥3.5 g/dl | 105 (57.1%) |
Abbreviations: AEC, absolute eosinophil count; ALB, albumin; ALC, absolute lymphocyte count; AMC, absolute monocyte count; ANC, absolute neutrophil count; LDH, lactate dehydrogenase; NLR, neutrophil/lymphocyte ratio; PD‐L1, programmed death‐ligand 1; PLR, platelet/lymphocyte ratio.
The tumor response and survival outcomes
In the overall population of 184 cases, one patient achieved CR (0.5%), 64 patients (34.8%) achieved PR, 60 patients (32.6%) experienced SD, and 59 patients (32.1%) had PD as the best radiological response. The ORR was 35.3% and the DCR was 67.9%. (Table 2) The ORR for patients with ANC < 7500/ul was 40.4%, whereas those with ANC ≥7500/ul was only 18.6%, (p = 0.009). The ORR for patients with ALC < 1000/ul was 24.3%, whereas those with ALC ≧ 1000/ul was 42.7% (p = 0.010). The ORR for patients with NLR < 5 (40.9%) was significantly higher than for those with NLR ≥5 (26.1%) (p = 0.042). In terms of DCR, 73.0% of patients had ANC < 7500/ul, whereas 51.2% had ANC ≥ 7500/ul (p = 0.007). The percentage of patients with ALC < 1000/ul was 55.4%, whereas for those with ALC ≧ 1000/ul it was 76.4% (p = 0.003). The number of patients with NLR < 5 and PLR < 200 was significantly higher than for those with NLR ≥ 5 and PLR ≥ 200 (74.8% vs. 56.5%, p = 0.010; 79.8% vs. 54.1%, p < 0.001). In terms of AEC, AMC, LDH, and ALB, these indexes seemed to have no significant effect on ORR and DCR (Table 3).
TABLE 2.
PD‐1 inhibitors activity in enrolled population
| Type of response | N (%) (n = 184) |
|---|---|
| Complete response | 1 (0.5%) |
| Partial response | 64 (34.8%) |
| Stable disease | 60 (32.6%) |
| Progressive disease | 59 (32.1%) |
| Objective response rate | 35.3% |
| Disease control rate (%) | 67.9% |
| Progression‐free survival, months | |
| Median | 6.6 |
| 95% CI | 5.9–7.3 |
| Overall survival, months | |
| Median | 14.0 |
| 95% CI | 12.4–15.5 |
TABLE 3.
Overall response rate and disease control rate according to inflammation‐nutritional index
| Factor | Therapeutic response | |||
|---|---|---|---|---|
| ORR (%) | p value | DCR (%) | p value | |
| ANC | ||||
| <7500/ul | 40.4 | 0.009 | 73.0 | 0.007 |
| ≥7500/ul | 18.6 | 51.2 | ||
| ALC | ||||
| <1000/ul | 24.3 | 0.010 | 55.4 | 0.003 |
| ≥1000/ul | 42.7 | 76.4 | ||
| AEC | ||||
| <150/ul | 33.3 | 0.866 | 46.7 | 0.084 |
| ≥150/ul | 35.5 | 69.8 | ||
| AMC | ||||
| <650/ul | 34.7 | 0.809 | 66.9 | 0.689 |
| ≥650/ul | 36.5 | 69.8 | ||
| NLR | ||||
| <5 | 40.9 | 0.042 | 74.8 | 0.010 |
| ≥5 | 26.1 | 56.5 | ||
| PLR | ||||
| <200 | 41.4 | 0.062 | 79.8 | 0.000 |
| ≥200 | 28.2 | 54.1 | ||
| LDH | ||||
| <240 U/L | 36.4 | 0.577 | 69.3 | 0.484 |
| ≥240 U/L | 31.8 | 63.6 | ||
| ALB | ||||
| <3.5 g/dl | 35.4 | 0.977 | 63.0.3 | 0.242 |
| ≥3.5 g/dl | 35.2 | 71.4 | ||
Note: Bold values indicate that p < 0.05.
Abbreviations: AEC, absolute eosinophil count; ALB, albumin; ALC, absolute lymphocyte count; AMC, absolute monocyte count; ANC, absolute neutrophil count; DCR, disease control rate; LDH, lactate dehydrogenase; NLR, neutrophil/lymphocyte ratio; ORR, overall response rate; PLR, platelet/lymphocyte ratio.
At a median follow‐up of 9.2 months (range 1.9–27.6), the median PFS was 6.6 months (5.9–7.3) and the median OS was 14.0 months (12.4–15.5) (Table 2). The PFS and OS were significantly worse in patients with ANC ≧ 7500/ul (median PFS 5.6 vs. 6.7 months, p = 0.039, Figure 1(a); median OS 10.6 vs. 14.9 months, p = 0.015, Figure 1(b)). The low‐ALC group (<1000/ul) had a significantly worse PFS (5.6 vs. 7.6 months, p < 0.001; Figure 1(c)) and OS (10.5 vs. 15.6 months, p < 0.001; Figure 1(d)) compared with the high‐ALC (≥1000/ul) group. Patients with AEC < 150/ul or AMC< 650/ul had comparable PFS with those with AEC ≥ 150/ul (4.2 vs. 6.6 months, p = 0.511; Figure 1(e)) or AMC ≥ 650/ul (5.9 vs. 6.8 months, p = 0.516; Figure 1(g)). A similar trend was also observed for OS (Figure 1f,h). The expression of PD‐L1 was independent of PFS and OS (Supporting Information Figure S1).
FIGURE 1.
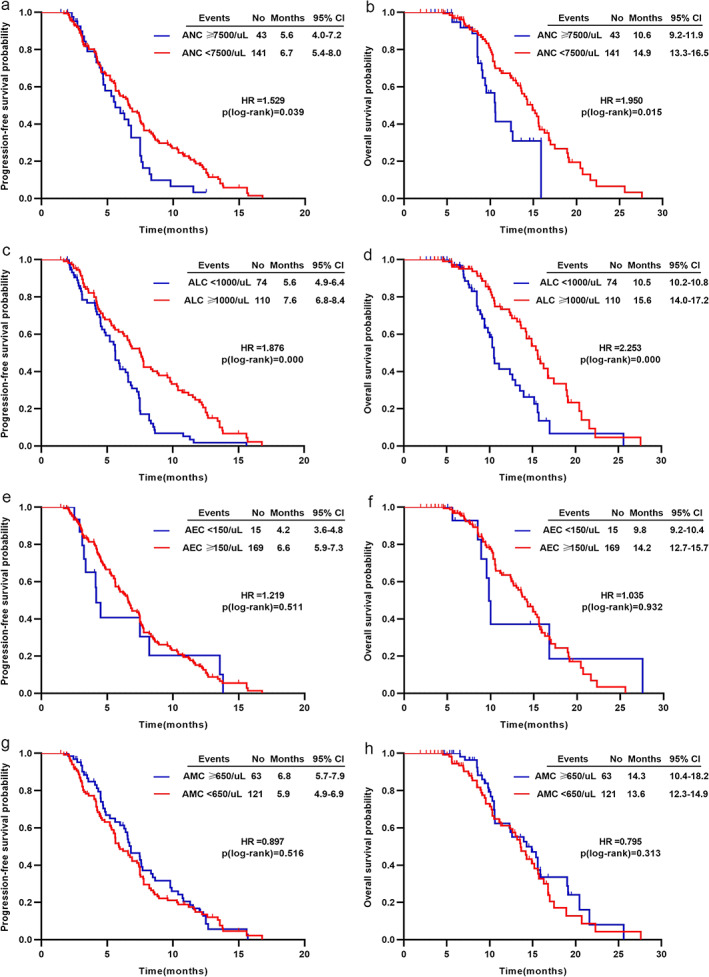
Kaplan–Meier analysis for PFS and OS based on (a) and (b) ANC, (c) and (d) ALC, (e) and (f) AEC, (g) and (h) AMC
Patients with low NLR levels (<5) had better survival in terms of PFS (7.5 vs. 5.6 months, p < 0.001; Figure 2a) and OS (15.6 vs. 10.5 months, p < 0.001; Figure 2b). Similarly, patients with low PLR levels (<200) had a significant improvement in PFS (8.3 vs. 5.2 months, p < 0.001; Figure 2c) and OS (15.9 vs. 10.2 months, p < 0.001; Figure 2d). Reduced pretreatment ALB level (<3.5 g/dl) was associated with inferior PFS (5.5 vs. 7.5 months, p = 0.002; Figure 2e) and OS (10.6 vs. 15.4 months, p = 0.022; Figure 2f). LDH levels were not significantly related to improved PFS (6.0 vs. 6.6 months, p = 0.566; Figure 2g) or OS (12.7 vs. 14.3 months, p = 0.270; Figure 2h).
FIGURE 2.
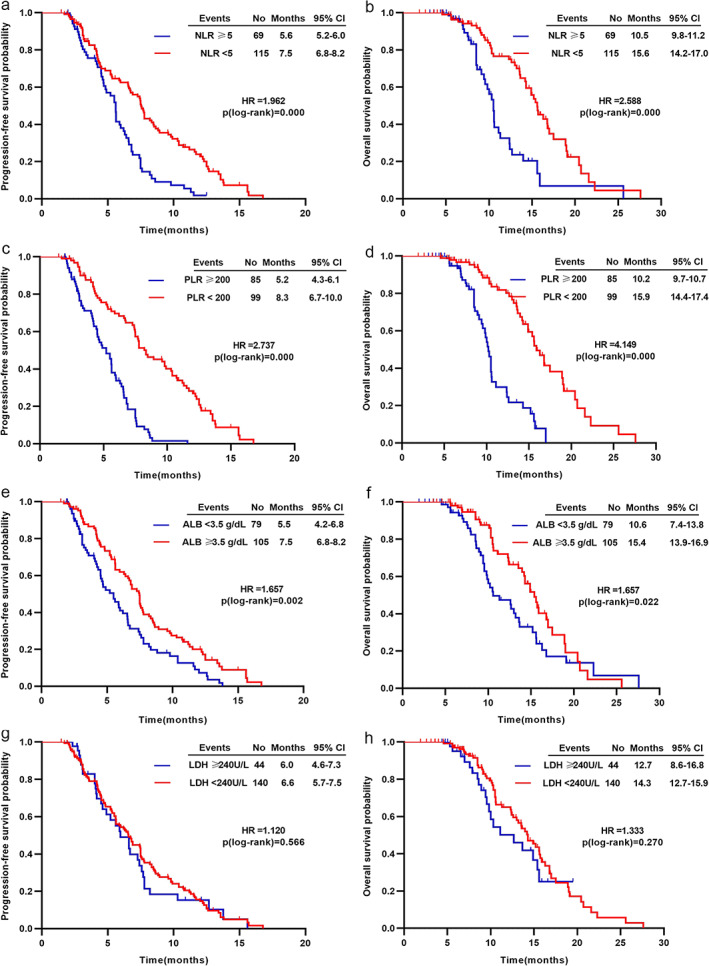
Kaplan–Meier analysis for PFS and OS based on (a) and (b) NLR, (c) and (d) PLR, (e) and (f) ALB, (g) and (h) LDH
Univariable and multivariable analysis of immune‐inflammation‐nutritional parameters for survival outcomes
In univariate analyses, we found that a relatively higher ANC (≥7500/ul), NLR (≥5), and PLR (≥200) was associated with a significantly worse OS, while a relatively lower ALC (<1000/ul) and ALB (<3.5 g/dl) tended to be associated with poor OS (Table 4). In multivariable analyses, a relatively higher AEC (≥150/ul) and higher AMC (≥650/ul) could significantly decrease the risk of death for advanced NSCLC patients. Consistent with univariate analyses, a higher NLR and PLR, and lower ALB were independent predictors of poor prognosis for OS (Figure 3). Other indexes, such as age, sex, smoking status, histological type, and previous radiotherapy, were not significantly associated with OS in both univariable and multivariable analysis (Table 4).
TABLE 4.
Univariate and multivariate cox proportional hazards regression analysis for overall survival
| Overall survival | |||||||
|---|---|---|---|---|---|---|---|
| Univariate | Multivariate | ||||||
| Variates | Category | HR | 95% Cl | p | HR | 95% Cl | p |
| Age | <70 | 1.016 | 0.541–1.910 | 0.961 | 1.360 | 0.673–2.751 | 0.392 |
| Sex | Male | 1.211 | 0.706–2.079 | 0.454 | 1.068 | 0.404–2.823 | 0.895 |
| Smoking | Yes | 1.035 | 0.651–1.647 | 0.884 | 1.485 | 0.591–3.735 | 0.400 |
| Histological type | AC | 1.234 | 0.872–1.746 | 0.235 | 1.108 | 0.763–1.609 | 0.590 |
| Previous radiotherapy | Yes | 0.890 | 0.566–1.400 | 0.615 | 0.577 | 0.331–1.005 | 0.052 |
| ANC | ≥7500/ul | 1.950 | 1.142–3.330 | 0.015 | 1.787 | 0.898–3.559 | 0.098 |
| ALC | <1000/ul | 2.253 | 1.443–3.518 | 0.000 | 1.153 | 0.611–2.176 | 0.661 |
| AEC | ≥150/ul | 0.971 | 0.464–2.030 | 0.931 | 0.363 | 0.141–0.931 | 0.035 |
| AMC | ≥650/ul | 0.795 | 0.509–1.241 | 0.313 | 0.370 | 0.203–0.675 | 0.001 |
| NLR | ≥5 | 2.588 | 1.641–4.080 | 0.000 | 1.964 | 1.027–3.755 | 0.041 |
| PLR | ≥200 | 4.149 | 2.553–6.741 | 0.000 | 4.255 | 2.364–7.658 | 0.000 |
| LDH | ≥240 U/L | 1.333 | 0.800–2.221 | 0.270 | 1.103 | 0.602–2.022 | 0.751 |
| ALB | <3.5 g/dl | 1.657 | 1.075–2.556 | 0.022 | 1.962 | 1.213–3.174 | 0.006 |
Note: Bold values indicate that p < 0.05.
Abbreviations: AC, adenocarcinoma; AEC, absolute eosinophil count; ALB, albumin; ALC, absolute lymphocyte count; AMC, absolute monocyte count; ANC, absolute neutrophil count; LDH, lactate dehydrogenase; NLR, neutrophil/lymphocyte ratio; PLR, platelet/lymphocyte ratio; SCC, squamous cell carcinoma.
FIGURE 3.
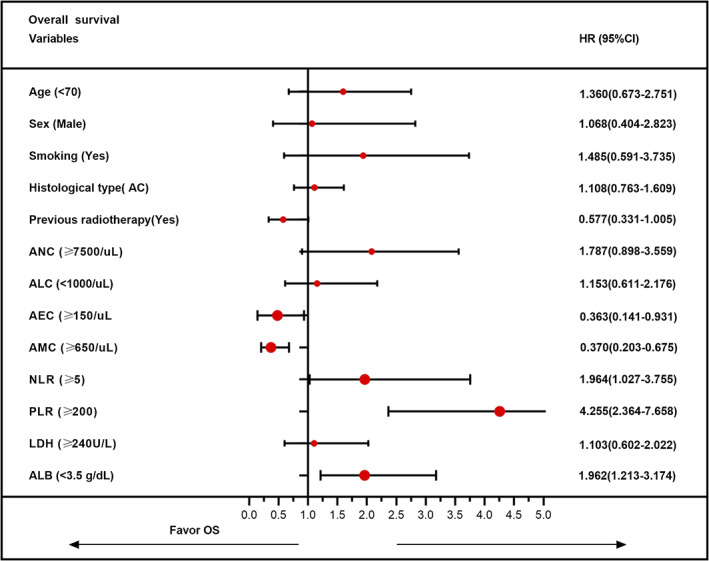
Multivariate analysis of overall survival to identify independent prognostic factors
DISCUSSION
ICIs as novel therapeutic strategies have achieved unprecedented benefit in advanced NSCLC patients. Nutritional status and inflammatory markers are reported as predictive factors of response to ICIs. 28 , 29 Peripheral blood parameters like ALC, AEC, ANV, LDH, and NLR before therapy have also been found to be associated with outcome in other types of cancer patients treated with pembrolizumab 25 or ipilimumab. 23 , 30 , 31 , 32 However, peripheral blood biomarkers for predicting response to PD‐1 inhibitors in advanced NSCLC remain unclear. This study comprehensively illustrates for the first time that baseline counts of inflammation‐nutritional markers such as ANC, ALC, AEC, AMC, NLR, PLR, LDH, and ALB are associated with ORR, DCR, PFS, and OS in advanced NSCLC patients treated with anti‐PD‐1 therapy. Our data revealed that an elevated AEC (≥150/ul), AMC (≥650/ul), and ALB (≥3.5 g/dl), and a low NLR (<5) and PLR (<200) were independently positive predictors of PD‐1 inhibitors.
These outcomes may be attributed to the following explanations. Neutrophils are correlated to tumor progression and metastasis by directly affecting tumor cells or indirectly affecting the tumor microenvironment via chemokines and cytokine secretion. 33 , 34 , 35 One study has indicated that higher ANC could reduce CD8+ T cells in NSCLC, 36 thus suppressing the antitumor immune response. 37 On the contrary, lymphocytes have an important role in antitumor immunity and lymphocytes infiltration increasement in tumor region has been demonstrated to have better response to therapy and survival in solid tumors. 38 Lymphopenia reflects the impairment of the cell‐mediated immune response. Therefore, an elevated NLR, either neutrophils increasing or lymphocytes decreasing, would result in a poor response to PD‐1 inhibitors in NSCLC patients. In the univariate analysis of our study, both neutrophilia (≥7500/ul) and lymphopenia (<1000/ul) had worse ORR, PFS, and OS, despite these negative results in multivariate analysis. Nevertheless, a low NLR (<5), in either univariate analysis or multivariate analysis (HR 1.964, 95% CI 1.027–3.755, p = 0.041), could significantly reduce the risk of death for advanced NSCLC patients receiving PD‐1 inhibitors as therapy.
Eosinophils have effects on tumor progression: activated eosinophils have a crucial role in tumor rejection by promoting tumor‐specific CD8+ T‐cell infiltration and modulating the tumor microenvironment. 39 Tanizaki et al. 15 demonstrated that a high AEC had improved PFS and OS. Similar to this research, an elevated AEC as an independent positive predictive factor for anti‐PD‐1 therapy was also obtained in our study. The prognostic nutrition index (PNI), a factor based on serum albumin level and lymphocyte count, can predict chronic inflammation and the nutritional status of patients. 40 Several reports have found a significant relationship between PNI and the survival of patients with a variety of malignant tumors. Peng et al. indicated that a baseline PNI ≥ 45 was associated with better PFS and OS. 41 The present study reveals that ALB ≥3.5 g/dl is a positive prognostic indicator of PD‐1 inhibitors. In addition, LDH is primarily produced by rapidly growing tumors and thus can reflect the tumor burden. 41 LDH was found to eb related to bad prognosis in melanoma patients treated with ICIs. 42 , 43 In patients with NSCLC, Taniguchi et al. utilized LDH to forecast the efficacy of nivolumab and discovered that patients with baseline LDH > 240 U/L was associated shorter PFS. 44 Similarly, patients with pretreatment LDH≥ 240 U/L related to a relatively shorter PFS and OS were also observed in our study.
As for baseline PLR levels, the findings are controversial in previously published papers: adopting different cut‐off values (PLR≥ 200 and ≥160, respectively), in terms of ORR or OS, no statistically significant difference was obtained between NSCLC patients treated with nivolumab with high PLR values and those with low levels. 20 , 45 By contrast, Russo et al. 13 demonstrated that a baseline PLR (≥200) was related to statistically significant worse ORR (p = 0.04), DCR (p = 0.001), PFS (p = 0.03), and OS (p = 0.05) in NSCLC patients treated with nivolumab. Our data analysis shows that a similar trend is obtained in DCR, PFS, and OS, but not in ORR.
The study has several limitations. First, the retrospective nature of the current research and the small number of patients may have introduced confounding factors and potential bias. Thus, these preliminary outcomes warrant further research and confirmation. Second, a control group in which patients did not receive PD‐1 inhibitors was lacking. Third, the cut‐off value of immune‐inflammation‐nutritional parameters referred to most published studies while other studies utilizing different cut‐off values might have a potential impact on the outcomes.
CONCLUSIONS
In conclusion, our research suggests that pretreatment AEC, AMC, ALB, NLR, and PLR were independently positive predictors of PD‐1 inhibitors in advanced NSCLC patients. These inflammation‐nutritional parameters could help clinicians identify subpopulations who were more likely to benefit from anti‐PD‐1 therapy before its initiation. Furthermore, considering the routine nature of assessment and the accessibility of these indexes at baseline, these results could be easily integrated into clinical practice.
CONFLICT OF INTEREST STATEMENT
The authors declare that they have no competing interests.
ETHICS APPROVAL
This study was approved by the Medical Ethical Committee of the West China Hospital of Sichuan University (Chengdu, China) and all patients in this research gave informed consent.
AUTHOR CONTRIBUTIONS
Y.Z. collected and reviewed the literature and wrote the manuscript. R.X. wrote and revised the manuscript. L.Z. and D.P. reviewed the manuscript and put forward meaningful comments on it. L.Z. assisted in drawing the figures. X.M. and J.L. designed the study and revised the manuscript. All authors read and approved the final manuscript.
Supporting information
Supporting Information Figure S1 Kaplan–Meier analysis for progression‐free survival (a) and overall survival (b) based on programmed death‐ligand 1 expression
ACKNOWLEDGMENTS
None.
Pu D, Xu Q, Zhou L‐Y, Zhou Y‐W, Liu J‐Y, Ma X‐L. Inflammation‐nutritional markers of peripheral blood could predict survival in advanced non‐small‐cell lung cancer patients treated with PD‐1 inhibitors. Thorac Cancer. 2021;12:2914–2923. 10.1111/1759-7714.14152
Contributor Information
Ji‐Yan Liu, Email: liujiyan1972@163.com.
Xue‐Lei Ma, Email: drmaxuelei@gmail.com.
DATA AVAILABILITY STATEMENT
The data that support the findings of this study are available from the corresponding author upon reasonable request.
REFERENCES
- 1. Siegel R, Miller K, Jemal A. Cancer statistics, 2020. CA Cancer J Clin. 2020;70(1):7–30. [DOI] [PubMed] [Google Scholar]
- 2. Matsubara T, Takamori S, Haratake N, Toyozawa R, Miura N, Shimokawa M. The impact of immune‐inflammation‐nutritional parameters on the prognosis of non‐small cell lung cancer patients treated with atezolizumab. J Thorac Dis. 2020;12(4):1520–8. [DOI] [PMC free article] [PubMed] [Google Scholar]
- 3. Borghaei H, Paz‐Ares L, Horn L, Spigel DR, Steins M, Ready NE, et al. Nivolumab versus docetaxel in advanced nonsquamous non‐small‐cell lung cancer. N Engl J Med. 2015;373(17):1627–39. [DOI] [PMC free article] [PubMed] [Google Scholar]
- 4. Garon E, Rizvi N, Hui R, Leighl N, Balmanoukian AS, Eder JP, et al. Pembrolizumab for the treatment of non‐small‐cell lung cancer. N Engl J Med. 2015;372(21):2018–28. [DOI] [PubMed] [Google Scholar]
- 5. Rittmeyer A, Barlesi F, Waterkamp D, Park K, Ciardiello F, von Pawel J, et al. Atezolizumab versus docetaxel in patients with previously treated non‐small‐cell lung cancer (OAK): a phase 3, open‐label, multicentre randomised controlled trial. Lancet. 2017;389(10066):255–65. [DOI] [PMC free article] [PubMed] [Google Scholar]
- 6. Saleh R, EJCl E. Treg‐mediated acquired resistance to immune checkpoint inhibitors. Cancer Lett. 2019;457:168–79. [DOI] [PubMed] [Google Scholar]
- 7. Pitt J, Vétizou M, Daillère R, et al. Resistance mechanisms to immune‐checkpoint blockade in cancer: tumor‐intrinsic and ‐extrinsic factors. Immunity. 2016;44(6):1255–69. [DOI] [PubMed] [Google Scholar]
- 8. Gandara D, Paul S, Kowanetz M, Schleifman E, Zou W, Yan L, et al. Blood‐based tumor mutational burden as a predictor of clinical benefit in non‐small‐cell lung cancer patients treated with atezolizumab. Nat Med. 2018;24(9):1441–8. [DOI] [PubMed] [Google Scholar]
- 9. Okuma Y, Hosomi Y, Nakahara Y, Watanabe K, Sagawa Y, Homma SJLC. High plasma levels of soluble programmed cell death ligand 1 are prognostic for reduced survival in advanced lung cancer. Lung Cancer. 2017;104:1–6. [DOI] [PubMed] [Google Scholar]
- 10. Bagley S, Kothari S, Aggarwal C, Bauml JM, Alley EW, Evans TL, et al. Pretreatment neutrophil‐to‐lymphocyte ratio as a marker of outcomes in nivolumab‐treated patients with advanced non‐small‐cell lung cancer. Lung Cancer. 2017;106:1–7. [DOI] [PubMed] [Google Scholar]
- 11. Rizvi N, Hellmann M, Snyder A, Kvistborg P, Makarov V, Havel JJ, et al. Cancer immunology. Mutational landscape determines sensitivity to PD‐1 blockade in non‐small cell lung cancer. Science. 2015;348(6230):124–8. [DOI] [PMC free article] [PubMed] [Google Scholar]
- 12. Shukuya T, Carbone DP. Predictive markers for the efficacy of anti‐PD‐1/PD‐L1 antibodies in lung cancer. J Thorac Oncol. 2016;11(7):976–88. [DOI] [PMC free article] [PubMed] [Google Scholar]
- 13. Russo A, Russano M, Franchina T, Migliorino MR, Aprile G, Mansueto G, et al. Neutrophil‐to‐lymphocyte ratio (NLR), platelet‐to‐lymphocyte ratio (PLR), and outcomes with Nivolumab in pretreated non‐small cell lung cancer (NSCLC): a large retrospective multicenter study. Adv Ther. 2020;37(3):1145–55. [DOI] [PubMed] [Google Scholar]
- 14. Passiglia F, Galvano A, Castiglia M, Incorvaia L, Calò V, Listì A, et al. Monitoring blood biomarkers to predict nivolumab effectiveness in NSCLC patients. Ther Adv Med Oncol. 2019;11:1758835919839928. [DOI] [PMC free article] [PubMed] [Google Scholar]
- 15. Tanizaki J, Haratani K, Hayashi H, Chiba Y, Nakamura Y, Yonesaka K, et al. Peripheral blood biomarkers associated with clinical outcome in non‐small cell lung cancer patients treated with nivolumab. J Thorac Oncol. 2018;13(1):97–105. [DOI] [PubMed] [Google Scholar]
- 16. Takada K, Takamori S, Yoneshima Y, Tanaka K, Okamoto I, Shimokawa M, et al. Serum markers associated with treatment response and survival in non‐small cell lung cancer patients treated with anti‐PD‐1 therapy. Lung Cancer. 2020;145:18–26. [DOI] [PubMed] [Google Scholar]
- 17. Nicholson A, Chansky K, Crowley J, Beyruti R, Kubota K, Turrisi A, et al. The International Association for the Study of Lung Cancer lung cancer staging project: Proposals for the revision of the clinical and pathologic staging of small cell lung cancer in the forthcoming eighth edition of the TNM classification for lung cancer. J Thorac Oncol. 2016;11(3):300–11. [DOI] [PubMed] [Google Scholar]
- 18. Ameratunga M, Chénard‐Poirier M, Moreno Candilejo I, Pedregal M, Lui A, Dolling D, et al. Neutrophil‐lymphocyte ratio kinetics in patients with advanced solid tumours on phase I trials of PD‐1/PD‐L1 inhibitors. Eur J Cancer. 2018;89:56–63. [DOI] [PubMed] [Google Scholar]
- 19. Fukui T, Okuma Y, Nakahara Y, Otani S, Igawa S, Katagiri M, et al. Activity of nivolumab and utility of neutrophil‐to‐lymphocyte ratio as a predictive biomarker for advanced non‐small‐cell lung cancer: A prospective observational study. Clin Lung Cancer. 2019;20(3):208–214.e202. [DOI] [PubMed] [Google Scholar]
- 20. Zer A, Sung M, Walia P, Khoja L, Maganti M, Labbe C, et al. Correlation of neutrophil to lymphocyte ratio and absolute neutrophil count with outcomes with PD‐1 axis inhibitors in patients with advanced non‐small‐cell lung cancer. Clin Lung Cancer. 2018;19(5):426–434.e421. [DOI] [PubMed] [Google Scholar]
- 21. Ku G, Yuan J, Page D, Schroeder SEA, Panageas KS, Carvajal RD, et al. Single‐institution experience with ipilimumab in advanced melanoma patients in the compassionate use setting: lymphocyte count after 2 doses correlates with survival. Cancer. 2010;116(7):1767–75. [DOI] [PMC free article] [PubMed] [Google Scholar]
- 22. Delyon J, Mateus C, Lefeuvre D, Lanoy E, Zitvogel L, Chaput N, et al. Experience in daily practice with ipilimumab for the treatment of patients with metastatic melanoma: an early increase in lymphocyte and eosinophil counts is associated with improved survival. Ann Oncol. 2013;24(6):1697–703. [DOI] [PubMed] [Google Scholar]
- 23. Ferrucci P, Ascierto P, Pigozzo J, Del Vecchio M, Maio M, Cappellini GCA, et al. Baseline neutrophils and derived neutrophil‐to‐lymphocyte ratio: prognostic relevance in metastatic melanoma patients receiving ipilimumab. Ann Oncol. 2016;27(4):732–8. [DOI] [PubMed] [Google Scholar]
- 24. Schmidt H, Suciu S, Punt C, Gore M, Kruit W, Patel P, et al. Pretreatment levels of peripheral neutrophils and leukocytes as independent predictors of overall survival in patients with American Joint Committee on Cancer Stage IV Melanoma: results of the EORTC 18951 Biochemotherapy Trial. J Clin Oncol. 2007;25(12):1562–9. [DOI] [PubMed] [Google Scholar]
- 25. Weide B, Martens A, Hassel J, Berking C, Postow MA, Bisschop K, et al. Baseline biomarkers for outcome of melanoma patients treated with pembrolizumab. Clin Cancer Res. 2016;22(22):5487–96. [DOI] [PMC free article] [PubMed] [Google Scholar]
- 26. Martens A, Wistuba‐Hamprecht K, Yuan J, Postow MA, Wong P, Capone M, et al. Increases in absolute lymphocytes and circulating CD4+ and CD8+ T cells are associated with positive clinical outcome of melanoma patients treated with ipilimumab. Clin Cancer Res. 2016;22(19):4848–58. [DOI] [PMC free article] [PubMed] [Google Scholar]
- 27. Mezquita L, Auclin E, Ferrara R, Charrier M, Remon J, Planchard D, et al. Association of the lung immune prognostic index with immune checkpoint inhibitor outcomes in patients with advanced non‐small cell lung cancer. JAMA Oncol. 2018;4(3):351–7. [DOI] [PMC free article] [PubMed] [Google Scholar]
- 28. Sacher A, LJJo G. Biomarkers for the clinical use of PD‐1/PD‐L1 inhibitors in non‐small‐cell lung cancer: a review. JAMA Oncol. 2016;2(9):1217–22. [DOI] [PubMed] [Google Scholar]
- 29. Lu S, Stein J, Rimm D, Wang DW, Bell JM, Johnson DB, et al. Comparison of biomarker modalities for predicting response to PD‐1/PD‐L1 checkpoint blockade: a systematic review and meta‐analysis. JAMA Oncol. 2019;5(8):1195–204. [DOI] [PMC free article] [PubMed] [Google Scholar]
- 30. Zaragoza J, Caille A, Beneton N, Bens G, Christiann F, Maillard H, et al. High neutrophil to lymphocyte ratio measured before starting ipilimumab treatment is associated with reduced overall survival in patients with melanoma. Br J Dermatol. 2016;174(1):146–51. [DOI] [PubMed] [Google Scholar]
- 31. Martens A, Wistuba‐Hamprecht K, Geukes Foppen M, Yuan J, Postow MA, Wong P, et al. Baseline peripheral blood biomarkers associated with clinical outcome of advanced melanoma patients treated with ipilimumab. Clin Cancer Res. 2016;22(12):2908–18. [DOI] [PMC free article] [PubMed] [Google Scholar]
- 32. Gebhardt C, Sevko A, Jiang H, Lichtenberger R, Reith M, Tarnanidis K, et al. Myeloid cells and related chronic inflammatory factors as novel predictive markers in melanoma treatment with ipilimumab. Clin Cancer Res. 2015;21(24):5453–9. [DOI] [PubMed] [Google Scholar]
- 33. Treffers L, Hiemstra I, Kuijpers T, van den Berg T, Matlung HJ. Neutrophils in cancer. Immunol Rev. 2016;273(1):312–28. [DOI] [PubMed] [Google Scholar]
- 34. Templeton A, McNamara M, Šeruga B, Vera‐Badillo FE, Aneja P, Ocaña A, et al. Prognostic role of neutrophil‐to‐lymphocyte ratio in solid tumors: a systematic review and meta‐analysis. J Natl Cancer Inst. 2014;106(6):dju124. [DOI] [PubMed] [Google Scholar]
- 35. Liang W, NJCIR F. The complex role of neutrophils in tumor angiogenesis and metastasis. Cancer Immunol Res. 2016;4(2):83–91. [DOI] [PubMed] [Google Scholar]
- 36. Kargl J, Busch S, Yang G, Kim K‐H, Hanke ML, Metz HE, et al. Neutrophils dominate the immune cell composition in non‐small cell lung cancer. Nat Commun. 2017;8:14381. [DOI] [PMC free article] [PubMed] [Google Scholar]
- 37. Souto J, Vila L, Brú AJMRR. Polymorphonuclear neutrophils and cancer: intense and sustained neutrophilia as a treatment against solid tumors. Med Res Rev. 2011;31(3):311–63. [DOI] [PubMed] [Google Scholar]
- 38. Gooden M, de Bock G, Leffers N, Daemen T, HJBJOC N. The prognostic influence of tumour‐infiltrating lymphocytes in cancer: a systematic review with meta‐analysis. Br J Cancer. 2011;105(1):93–103. [DOI] [PMC free article] [PubMed] [Google Scholar]
- 39. Carretero R, Sektioglu I, Garbi N, Salgado O, Beckhove P, GJNI H. Eosinophils orchestrate cancer rejection by normalizing tumor vessels and enhancing infiltration of CD8(+) T cells. Nat Immunol. 2015;16(6):609–17. [DOI] [PubMed] [Google Scholar]
- 40. Lee Y, Kim W, Han J, Han YD, Cho MS, Hur H, et al. Prognostic impact of immunonutritional status changes during preoperative chemoradiation in patients with rectal cancer. Ann Coloproctol. 2016;32(6):208–14. [DOI] [PMC free article] [PubMed] [Google Scholar]
- 41. Peng L, Wang Y, Liu F, Qiu X, Zhang X, Fang C, et al. Peripheral blood markers predictive of outcome and immune‐related adverse events in advanced non‐small cell lung cancer treated with PD‐1 inhibitors. Cancer Immunol Immunother. 2020;69(9):1813–22. [DOI] [PMC free article] [PubMed] [Google Scholar]
- 42. Kelderman S, Heemskerk B, van Tinteren H, van den Brom RRH, Hospers GAP, van den Eertwegh AJM, et al. Lactate dehydrogenase as a selection criterion for ipilimumab treatment in metastatic melanoma. Cancer Immunol Immunother. 2014;63(5):449–58. [DOI] [PMC free article] [PubMed] [Google Scholar]
- 43. Diem S, Kasenda B, Spain L, Martin‐Liberal J, Marconcini R, Gore M, et al. Serum lactate dehydrogenase as an early marker for outcome in patients treated with anti‐PD‐1 therapy in metastatic melanoma. Br J Cancer. 2016;114(3):256–61. [DOI] [PMC free article] [PubMed] [Google Scholar]
- 44. Taniguchi Y, Tamiya A, Isa S, Nakahama K, Okishio K, Shiroyama T, et al. Predictive factors for poor progression‐free survival in patients with non‐small cell lung cancer treated with nivolumab. Anticancer Res. 2017;37(10):5857–62. [DOI] [PubMed] [Google Scholar]
- 45. Russo A, Franchina T, Ricciardi G, Battaglia A, Scimone A, Berenato R, et al. Baseline neutrophilia, derived neutrophil‐to‐lymphocyte ratio (dNLR), platelet‐to‐lymphocyte ratio (PLR), and outcome in non small cell lung cancer (NSCLC) treated with nivolumab or docetaxel. J Cell Physiol. 2018;233(10):6337–43. [DOI] [PMC free article] [PubMed] [Google Scholar]
Associated Data
This section collects any data citations, data availability statements, or supplementary materials included in this article.
Supplementary Materials
Supporting Information Figure S1 Kaplan–Meier analysis for progression‐free survival (a) and overall survival (b) based on programmed death‐ligand 1 expression
Data Availability Statement
The data that support the findings of this study are available from the corresponding author upon reasonable request.