

Abstract
Purpose:
Precision medicine approaches in pancreatic ductal adenocarcinoma (PDAC) are imperative for improving disease outcomes. With molecular subtypes of PDAC gaining relevance in the context of therapeutic stratification, the ability to characterize heterogeneity of cancer specific gene expression patterns is of great interest. Additionally, understanding patterns of immune evasion within PDAC is of importance as novel immunotherapeutic strategies are developed.
Experimental Design:
Single-cell RNA sequencing (scRNA-seq) is readily applicable to limited biopsies from human primary and metastatic PDAC and identifies most cancers as being an admixture of previously described epithelial transcriptomic subtypes.
Results:
Integrative analyses of our data provide an in-depth characterization of the heterogeneity within the tumor microenvironment, including cancer-associated fibroblast (CAF) subclasses, and predicts for a multitude of ligand-receptor interactions, revealing potential targets for immunotherapy approaches.
Conclusion:
Our analysis demonstrates that the use of de novo biopsies from PDAC patients paired with scRNA-seq may facilitate therapeutic prediction from limited biopsy samples.
Keywords: pancreatic ductal adenocarcinoma, single-cell RNA sequencing, cancer biopsy, molecular subtypes, tumor microenvironment
Introduction
The majority of patients with pancreatic ductal adenocarcinoma (PDAC) present with locally advanced or metastatic disease, which precludes surgical resection of their cancer (1). The gold standard for diagnosis is a tissue biopsy prior to initiation of systemic therapy, which is obtained by either endoscopic ultrasound-guided fine needle aspiration (EUS-FNA) of the primary lesion or through interventional radiology (IR)-guided percutaneous biopsy of a metastatic site. While typically adequate for histopathological assessment, PDAC biopsies, especially those obtained via EUS-FNA without rapid onsite cytopathology assessment, can be limited by low neoplastic cellularity (2,3). Nonetheless, such biopsies may be the only source of tissue from patients with locally advanced or metastatic PDAC who are likely to derive the most benefit from tailored approaches.
Multiple recent studies have demonstrated the feasibility of using next generation sequencing (NGS) platforms for mutational analysis as applied to these limited “real world” biospecimens obtained from PDAC patients (4,5). Notably, although targeted NGS panels can identify somatic or germline DNA mutations in a clinically meaningful timeframe, no more than a quarter of PDAC patients, at best, harbor such actionable mutations (6). On the other hand, transcriptomic profiling of PDAC has revealed the presence of molecular subtypes that may guide therapeutic stratification as is seen in other cancer types (7). Single cell RNA sequencing (scRNA-seq) has also aided in elucidating intratumoral heterogeneity with implications in evolution of cancer cells, resistance to therapy, and effects of stromal cells such as immune cells and fibroblasts on tumor behavior.
We explore the feasibility of using scRNA-seq on de novo limited biopsies obtained from patients with primary and metastatic PDAC. As recently described in studies using surgically resected PDAC samples, scRNA-seq provides an unprecedented level of insight into the architecture of the neoplastic cells and their tumor microenvironment (TME), including compartment specific heterogeneity (8–11). We demonstrate that scRNA-seq on limited fine-needle and core biopsies captured nearly all of the previously reported repertoire of cell types in surgical resections, including the tumor-stromal heterogeneity inherent to this disease, and revealed putative mechanisms for immune evasion within the TME. We believe that precision medicine approaches to a near universally lethal disease such as PDAC should deploy multiple orthogonal approaches, including NGS for actionable DNA alterations and scRNA-seq on contemporaneous de novo biopsies for assessment of the tumor-stromal architecture.
Materials and Methods
Sample Acquisition
A total of 9 patients were recruited at the University of Texas MD Anderson Cancer Center through informed written consent following institutional review board approval (Lab00–396 and PA15–0014). The study was conducted in accordance with Good Clinical Practices concerning medical research in humans per the Declaration of Helsinki. Five primary pancreatic cancers and four metastatic lesions in liver (LiM), lung (LuM), peritoneum (PM), and vaginal apex (VM) were used. P2-P5 primary samples came from treatment-naïve patients, while P1 was a second FNA from a patient who had been treated with gemcitabine/paclitaxel. For metastatic samples, the most recent therapies prior to sample acquisition were 5-fluorouracil/liposmal irinotecan, evofosfamide/ipilimumab and capecitabine for VM, LuM, and PM, respectively. LiM was a treatment-naïve sample. Histologic confirmation of PDAC was performed by a pathologist.
Single Cell Dissociation
Pancreatic cancer biopsies were collected in high-glucose Dulbecco’s Modified Eagle Medium (DMEM) supplemented with GlutaMAX, HEPES buffer, and 1% bovine serum albumin (BSA; all Thermo Fisher). Samples were delivered to the laboratory within 2 hours after the procedure. Single cell dissociation was performed as previously described (8). Briefly, samples were minced with sterile surgical scalpels to 0.5–1 mm fragments in approximately 1 ml of media. After centrifugation for 5 minutes at 125 g, cells were resuspended in DMEM with 0.5 mg/ml Liberase TH (Sigma-Aldrich) and 1% penicillin-streptomycin (Corning) and incubated in an orbital shaker for 15 min at 37°C. Liberase was quenched with equal volume of 1% BSA in DMEM followed by centrifugation for 5 minutes at 125 g. Cells were resuspended in 2 ml Accutase (Sigma-Aldrich) and incubated in an orbital shaker for 15 minutes at 37°C. Dissociated cells were passed through a 40 μm strainer and centrifuged for 5 minutes at 125 g. Isolated cells were resuspended in 0.04% BSA in phosphate buffered saline (Corning) for subsequent viability analysis and counting.
Single-Cell RNA Library Preparation and Sequencing
Single-cell transcriptomic amplification and library preparation was performed using the 5’ or 3’ Library Construction Kit (10x Genomics) following the manufacturer’s recommendations. Final library quality and concentration were measured on TapeStation System using High Sensitivity D5000 ScreenTape (Agilent). Libraries were sequenced on NextSeq 500 (Illumina) according to the manufacturer’s instructions.
Sequencing Data Processing and Analysis
Raw base call (BCL) files were demultiplexed and converted to FASTQ files, which were subsequently used to generate feature-barcode matrices using Cell Ranger RNA v3.1 (10x Genomics) and hg19 was used as a reference. Additional analytical methods are included in the Supplementary Information.
Data availability
The datasets generated during the current study are available in the Gene Expression Omnibus repository under accession number GSE156405
Results
scRNA-seq of Limited De Novo Biopsies Recapitulates the Tumor-Stromal Heterogeneity of PDAC Observed in Surgical Resections
We explored the feasibility of conducting scRNA-seq in a panel of limited “real world” biopsies obtained from primary and metastatic PDAC patients. Five primary samples (P1-P5) were obtained via EUS-FNAs of the pancreas, while four metastatic samples were obtained as core needle biopsies (liver, lung) or segmental biopsies (vaginal apex, peritoneal). Pooled analysis of all samples yielded a total of 31,720 cells organized into 8 clusters (Figure 1A), and highly expressed genes in each cluster were used to identify cell types (Figure 1B). Epithelial cells were the most commonly represented cell type (47%), followed by T cells (28%) and myeloid cells (12%; Figure 1A). Across primary and metastatic lesions, all cell types were represented and the average cell composition was similar (Supplementary Figure S1A, Supplementary Table S1).
Figure 1. PDAC biopsies contain diverse cell types.

A. UMAP plot of single cells from 9 biopsy samples (left) and bar plot showing proportions of cell types in pooled primary and metastatic samples (right).
B. Bubble plot showing highly expressed marker genes in each cell type, with cell types in rows and genes in columns. Size of each bubble represents percent of cells expressing marker and color represents the level of expression.
C. UMAP plot of epithelial cells re-clustered from A (left) and bar plot showing proportions of epithelial cell sub-clusters in pooled primary and metastatic samples (right).
D. Violin plots showing relative expression levels of selected marker genes in all epithelial sub-clusters.
To assess the heterogeneity specific to cancer cells, we extracted the epithelial cluster for further analysis, which revealed six distinct transcriptomic sub-clusters (Figure 1C; Supplementary Table S1). Epithelial 1 sub-cluster was characterized by enrichment of antigen presentation, type I IFN response, and response to IFNγ pathways (Supplementary Figure S1B). Along the same line, epithelial 2 sub-cluster was enriched for response to reactive oxygen species (ROS) and intrinsic apoptosis, while epithelial sub-clusters 3 and 4 were enriched for epigenetic process and DNA replication/cell cycle, respectively, altogether demonstrating diverse transcriptomic programs present in PDAC tumor cells. A previous scRNA-seq analysis of PDAC demonstrated lipid processing and secretory cells within ductal epithelial cells (9), which were also present in our samples. Specifically, sub-cluster 5 expressed lipid processing cell markers APOA1, FABP1, and DNASE1, while sub-cluster 6 expressed secretory cell markers CFTR, SOD3, and COL18A1 (Figure 1D). All epithelial sub-clusters were present in both primary and metastatic tissues, but lipid processing and secretory sub-clusters were proportionately less common in metastases (Supplementary Figure S1C; Supplementary Table S2). Furthermore, signature genes for ductal and acinar cells were applied to the lipid processing and secretory sub-clusters (12). This analysis demonstrated that the former was enriched in acinar cells while the latter was enriched in ductal cells (Supplementary Table S3).
Copy number inference from scRNA-seq showed numerous alterations in sub-clusters 1–4, whereas lipid processing and secretory sub-clusters did not contain matching alterations (Supplementary Figure S1D), suggesting that the latter were derived from normal epithelium, as previously postulated (9). In addition, this combined inferred copy number analysis demonstrated how limited biopsies can readily capture tumor heterogeneity of primary and metastatic PDAC.
Molecular Subtyping of Single Cells Reveals Intratumoral Subtype Heterogeneity
Previous studies have classified PDAC into molecular subtypes based on their bulk transcriptome. These classifications include Bailey subtypes (pancreatic progenitor, squamous, aberrantly differentiated endocrine exocrine or ADEX, and immunogenic), Collisson subtypes (classical, quasimesenchymal or QM, and exocrine-like), and Moffitt subtypes (classical and basal-like) (13–15). A subsequent study demonstrated two common epithelial subtypes, namely classical (or pancreatic progenitor) and basal-like (or squamous/QM), whereas immunogenic and ADEX or exocrine-like subtypes were associated with low tumor purity (16). To precisely delineate the cellular contributions to bulk molecular subtypes, we used nearest template prediction (17) to classify all single cells into a subtype based on the three classifiers (Supplementary Figures S2A–S2D; Supplementary Table S4). Aligning the cell type to molecular subtypes confirmed that immunogenic, ADEX, and exocrine-like subtypes were mostly composed of non-epithelial cells (Supplementary Figures S2E), consistent with the previous finding of low tumor purity in these subtypes (16).
To understand the molecular subtypes in the context of epithelial cells, we reapplied the classifiers on the epithelial subset (Supplementary Figures S2A–S2D and S2F; Supplementary Table S5). Of note, while subtype prediction from pseudo-bulk projection yielded one molecular subtype for each biopsy sample (Supplementary Figure S2G), all tumor samples were composed of more than one subtype at single-cell level regardless of the classifier (Figures 2A–C; Supplementary Figures S2H–S2J), consistent with recent reports that Moffitt classical and basal-like subtypes coexist in a single tumor (18,19)
Figure 2. PDAC molecular subtypes at single-cell resolution.

A-C. Bar plots showing proportions of epithelial cells classifying into Bailey (A), Collisson (B), and Moffitt (C) subtypes with FDR < 0.2 in pooled primary and metastatic samples (left) and individual samples (right).
D. Pseudotime trajectory of epithelial cells from all biopsy samples labeled with Moffitt molecular subtypes or Raghavan hybrid subtype (top) and bar plot representing the proportions of cells in each pseudotime bin (50 bins total) classifying into one of three subtypes (bottom).
E. Pseudotime trajectory plot from D labeled with sample identification separated into primary lesions (top) and metastatic lesions (bottom).
F. Branched heatmap showing dynamic gene expression changes in epithelial cells along the pseudotime trajectory, with pseudotime progressing from left to right. Enriched Hallmark or Gene Ontology biological process (GO-BP) terms for each gene cluster are listed on the right.
P1–5, primary 1–5; VM, vaginal apex metastasis; LiM, liver metastasis; LuM, lung metastasis; PM, peritoneal metastasis.
We performed pseudotime analysis on the epithelial cells to elucidate potential evolutionary trajectories of PDAC tumor cells, which revealed two major branches (Figure 2D). Interestingly, cells from the liver metastasis formed their own branch in the trajectory (Cell fate 1; Figure 2E; Supplementary Figure S3A) and showed upregulation of epithelial-mesenchymal transition (EMT) and hypoxia pathways (Figure 2F), which may contribute to their more aggressive phenotype. Cell fate 2 mostly consisted of lung and vaginal metastases, with lung metastatic cells lying towards the end of the trajectory (Figure 2E; Supplementary Figure S3A). Lung metastatic cells were enriched for aerobic metabolism pathways, such as oxidative phosphorylation and electron transport chain (Figure 2F), which may be expected given the presence of ample oxygen in the microenvironment. Of note, given that the liver- and lung-metastatic cells form diverging trajectories with enrichment of distinct gene sets even though cells in both sites mostly classified as basal-like (Figures 2C and 2D), our results suggest that there may be heterogeneity even within a single subtype that may be responsive to the metastatic site. In addition, we included a third molecular “hybrid” subtype which has recently reported by Raghavan et al (20) and found it to be present in every case studied (Supplementary Figure S3B).
scRNA-seq on PDAC Biopsies Capture Cancer-Associated Fibroblast Diversity
In the PDAC TME, functionally and transcriptomically distinct subtypes of cancer-associated fibroblasts (CAFs) are present (21,22). Inflammatory CAFs (iCAFs) secrete cytokines, whereas myofibroblastic CAFs (myCAFs) are characterized by the expression of extracellular matrix (ECM) components (21,23). A third subtype of CAFs, named antigen-presenting CAFs or apCAFs, express class II major histocompatibility complex (MHC) genes (9). Initial analysis of the CAF population from our scRNA-seq revealed two transcriptomically distinct sub-clusters, which were designated as iCAFs and myCAFs based on the expression of PDGFRA, CXCL12, ACTA2, and TAGLN as previously described (Supplementary Figures S4A and S4B). To assess the presence of apCAFs, we looked for co-expression of the invariant chain of MHC II molecule CD74 with HLA-DPA1, HLA-DRA, and HLA-DRB1, which was present in a subset of CAFs (Figure 3A). Utilizing nearest template prediction (17), we categorized each fibroblast into one of the three subtypes (Figures 3B and 3C) and found no significant difference in the proportions of the CAF subtypes in primary and metastatic tumors (Supplementary Figure S4C; Supplementary Table S6). In our samples, apCAFs did not co-express PTPRC or MSLN (Supplementary Figure S4D), confirming that these cells are not immune or mesothelial cells, as has been suggested in a recent study using murine PDAC (24). While apCAFs express MHC II molecules and can present antigens to CD4 T cells, they lack the co-stimulatory molecules required to activate an immune response. Therefore, it was hypothesized that apCAFs would contribute to the immunosuppressive environment in PDAC by leading to anergy or differentiation of CD4 T cells into regulatory T (Treg) cells (9). Indeed, the proportion of apCAFs in biopsy samples was negatively correlated with the ratio of memory and effector CD8 T cells to Tregs (Figure 3D). Our results recapitulate a potential mechanism by which stromal cells within the PDAC microenvironment may lead to immune suppression.
Figure 3. Stromal heterogeneity of PDAC is captured by biopsies.

A. Co-expression of selected apCAF marker genes projected onto UMAP plot of CAFs. CD74 expression is represented by black (low) to red (high), whereas the expression of HLA genes is represented by black (low) to green (high). High expression of both CD74 and variant MHC II molecule is shown as yellow.
B. CAF subtypes from nearest template prediction projected onto UMAP plot.
C. Heatmap showing scaled expression of apCAF, iCAF, and myCAF marker genes ordered by subtype.
D. Correlation plot between apCAF abundance in each sample and the ratio of CD8 T cells (memory and effector) to regulatory T (Treg) cells.
PDAC-Infiltrating Immune Cells Acquire an Immune Suppressive Signature
PDAC is characterized by immunosuppressive microenvironment (1). To understand how immune cells change from the circulation to the PDAC TME, we performed scRNA-seq on peripheral blood mononuclear cells (PBMCs) from 8 of 9 patients obtained at or around the time of their tissue biopsies. Global comparison of all cell types revealed that there was a subpopulation of myeloid cells that were found only in the PDAC but not in the periphery (Figure 4A; Supplementary Figure S5A), and sub-clustering analysis revealed this unique population to be macrophages (Figure 4B; Supplementary Figures S5B and S5C). Given the potential polarization of tumor-associated macrophages into classical M1 and alternative M2 phenotypes (25), we performed trajectory inference analysis on monocytes and macrophages from PBMCs and tumors, which revealed a single unbranched trajectory representing the differentiation from monocytes to macrophages (Figure 4C). The expression of immune suppressive genes such as MARCO and TREM2 increased with pseudotime (Figure 4D). Global gene expression changes along the pseudotime trajectory revealed upregulation of macrophage activation, acute and chronic inflammation, and negative regulation of myeloid-mediated immunity pathways (Figure 4E). Furthermore, macrophages were characterized by an upregulation of angiogenesis and hypoxia pathways (Figure 4E), which are associated with the M2 phenotype (25), confirming the immune suppressive role of tumor-infiltrating macrophages.
Figure 4. Acquisition of immune suppressive phenotype by tumor-infiltrating immune cells.

A. UMAP plot of immune cells from peripheral blood mononuclear cells (PBMC) and tumors colored by cell type.
B. UMAP of myeloid cells re-clustered from A colored by cell type (left) and bar plot showing proportions of each myeloid cell type as percent of all cells in PBMC, primary, and metastatic samples (right).
C. Pseudotime trajectory of monocytes and macrophages.
D. Dot plot representing the expression of MARCO (top) and TREM2 (bottom) along the pseudotime trajectory from D colored by cell type. Solid black line indicates the mean expression at a given pseudotime.
E. Heatmap showing dynamic gene expression changes through pseudotime (left) and enrichment of Gene Ontology biological processes (GO-BP) terms for selected gene cluster (right).
F. UMAP of myeloid cells re-clustered from Figure 1A (left) and bar plot showing proportions of myeloid cell types in pooled primary and metastatic samples (right). Mono, monocyte; mac, macrophage; DC, dendritic cell; pDC, plasmacytoid DC.
G. Heatmap showing scaled expression of select marker genes in each myeloid sub-cluster.
H. UMAP of T and NK cell re-clustered from Figure 1A (left) and bar plot showing proportions of T and NK cell types in pooled primary and metastatic samples (right). Trm, tissue resident memory; MAIT, mucosal-associated invariant T; Treg, regulatory T; IFN, interferon.
I. Heatmap showing scaled expression of select marker genes in each T and NK sub-cluster.
To elucidate the different types of myeloid cells present in the PDAC TME, we performed sub-clustering analysis of tumor-infiltrating myeloid cells and found 8 distinct cell types (Figure 4F; Supplementary Table S7). Using previously published subtyping of monocytes and dendritic cells (DCs) based on scRNA-seq profiles (26), we classified these sub-clusters as monocyte 1 (equivalent to CD14high cells), monocyte 2 (equivalent to CD16high cells), macrophage 1 (expressing APOE and SPP1), macrophage 2 (expressing complement molecules), DC1 (CLEC9A), DC2/3 (CD1C), plasmacytoid (p)DCs (TCF4, IRF7), and mast cells (TPSAB1, CPA3; Figure 4G; Supplementary Figure S5D). All sub-clusters were represented in primary tumors and metastases without significant differences in their proportions (Supplementary Figure S5E). In addition to MARCO and TREM2, tumor-associated macrophages expressed PPARG and IL6 transcripts (Supplementary Figure S5F), the products of which are also implicated in immune suppression (27). Of note, a recent study comparing the immune compartments of PDAC and lung cancer revealed reduced numbers of DC infiltration in PDAC that led to the attenuation of anti-tumor T cell activity (28). Consistent with these findings, DCs represented smallest subsets of myeloid cells in our samples. Moreover, given that the DC1 subset expressed IDO1 (Figure 4G), which inhibits T-cell proliferation (9,29), the DC1 subset may contribute to the immune suppressive phenotype in PDAC.
Analysis of tumor-infiltrating T and natural killer (NK) cells revealed 12 distinct sub-clusters (Figure 4H; Supplementary Table S8). Based on known markers for T and NK cells (30,31), we identified memory (ANXA1) and naïve (SELL, CCR7) CD4 T cells, memory and effector (CX3CR1) CD8 T cells, naïve CD8 T cells, mucosal-associated invariant T (MAIT) cells (SLC4A10), tissue resident memory CD8 T (Trm) cells (ZNF683), Tregs (FOXP3, CTLA4), CD56 NK cells, CD16 NK cells, IFN-response T cells (IFI44L, ISG15), and NK T cells (TYMS, MKI67; Figure 4I; Supplementary Figure S6A). Many T cells expressed inhibitory receptors PDCD1, LAG3, and BTLA (Supplementary Figure S6B), suggesting that T cells are present in the PDAC TME but their functions may be inhibited. Next, we compared T and NK cells in PBMCs and tumors (Supplementary Figures S6C–S6E). There was a trend of naïve CD4 T cells decreasing in proportion from periphery to primary to metastatic tumors, whereas memory CD4 and CD8 T cells showed a reverse trend (Supplementary Figure S6F), likely reflecting antigen exposure and creation of memory T cell populations predating metastatic spread. Gene set enrichment analysis (GSEA) of tumor-infiltrating T and NK cells revealed the enrichment of hypoxia and negative regulation of immune response pathways (Supplementary Figure S6G), demonstrating the acquisition of immune suppressive phenotype similar to tumor-associated macrophages.
Prediction of the PDAC Ligand-Receptor Interactome Reveals Multiple Immune Regulatory Pathways and Potentially Actionable Nodes
scRNA-seq has been used to predict potential ligand-receptor (LR) interactions, which we utilized to reveal potential mechanisms by which the crosstalk between tumor cells and immune cells may contribute to immunosuppression in PDAC. We applied an average expression-based LR interaction prediction (32,33) to assess potential relationships between major cell types of two primary (P3, P4) and two metastatic (liver, lung) tumors, as they contained the highest cell numbers and represented the most cellular diversity. We did not combine multiple samples for analysis to rule out potentially false interactions (e.g. T cell from liver metastasis to epithelial cells in a primary tumor). Global overview of the interactomes revealed that myeloid and dendritic cells were the most connected, and epithelial cells interacted closely with these two cell types (Figures 5A and 5B; Supplementary Figures S7A and S7B). One of the most significant LR pairs responsible for these connections was predicted to be between macrophage migration inhibitory factor (MIF) and the transcript for the invariant HLA-DR allele, CD74 (Figure 5C). This interaction has been implicated in promoting myeloid-derived suppressor cell-mediated immunosuppression in melanoma and breast cancer (34,35), while tumor cell MIF expression has been linked to a more aggressive phenotype in PDAC (36).Another prevalent interaction between tumor epithelial cells and myeloid/dendritic cells involved amyloid precursor protein (APP) and CD74; of interest, we have previously described that APP overexpression in PDAC cells upregulates proliferation (37). The potential role of neoplastic APP in subverting antigen presentation via CD74 interaction on immune cells in the PDAC TME is uncharted. In addition to myeloid cells, CD74 expression in B cells has been linked to promote their proliferation (38) and recent work has demonstrated the role of tumor-infiltration B cells in the initiation and proliferation of PDAC (39–41). Our LR analysis predicted a putative interaction between CD74 receptor on B cells and its cognate ligand, MIF, expressed by neoplastic epithelial cells, respectively. We were able to validate this putative interaction in a panel of archival PDAC samples by multiplex immunofluorescence, confirming the proximity of the two cell types expressing the corresponding receptor-ligand pair (Supplementary Figure S8).
Figure 5. Ligand-receptor interaction predictions between major cell types.
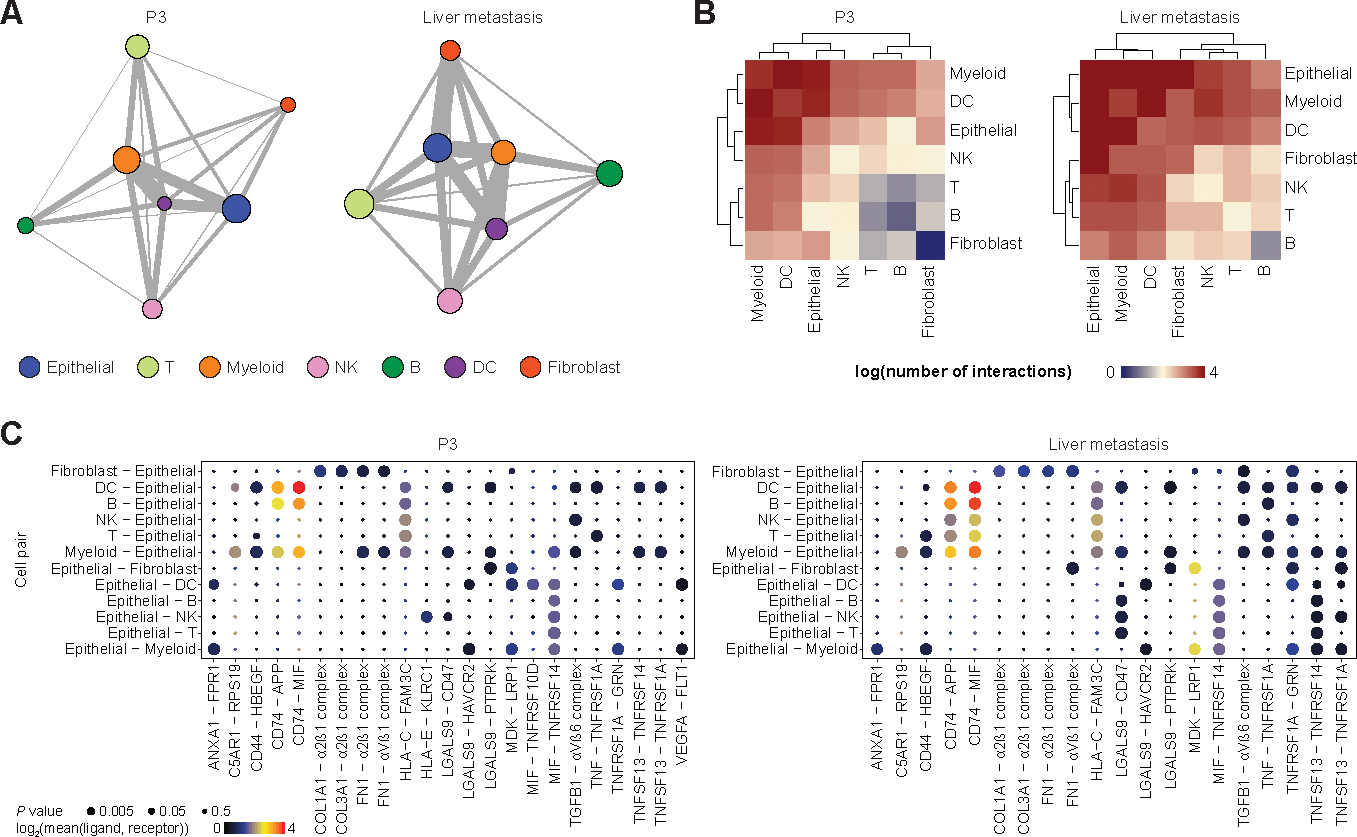
A. Network plots of a primary PDAC (P3, left) and liver metastasis (right) demonstrating potential ligand-receptor interactions. Each node represents a cell type and size reflects relative number of cells. Each edge represents the number of significant interactions between each cell-type pair and its thickness is proportional to the number of interactions.
B. Heatmaps of log-transformed number of significant interactions between cell-type pairs in a primary PDAC (P3, left) and liver metastasis (right).
C. Bubble plots representing top significant ligand-receptor interactions between different cell-type pairs involving epithelial cells in a primary PDAC (P3, left) and liver metastasis (right). Size of each bubble represents P value and color represents the mean expression of ligand and receptor genes.
Given that scRNA-seq data can be biased by gene dropout, thereby diminishing the average expression of genes in each cell type, we next predicted LR interactions at single-cell level (42). When looking at predicted interactions involving ligands from cells in the TME and cognate receptors on epithelial cells, we found that epithelial cells were more strongly connected to fibroblasts and myeloid cells, whereas there were fewer connections with T and B cells (Figure 6A; Supplementary Figures S9A and S9B). Many predicted interactions between epithelial cells and fibroblasts involved components of the ECM (Figure 6B), which is expected given that one of the major functions of fibroblasts is the production of ECM proteins. There were many pro-inflammatory interactions such as IFNG from T/NK cells and IFNGR1/2 on epithelial cells (Figure 6B), once again pointing to inflammatory signals present in the PDAC microenvironment.
Figure 6. Ligand-receptor interaction predictions between single cells.

A. Network plots of a primary PDAC (P3, left) and liver metastasis (right) demonstrating potential ligand-receptor interactions in which epithelial cells express the receptor. Each node represents a single cell and the edge represents the number of ligand-receptor pairs between two cells.
B. Heatmap showing top interaction scores (normalized number of ligand-receptor interactions) for each cell-type pair where epithelial cells express the receptor. Sample origin, stage, and ligand-expressing cells are annotated above the heatmap. See bottom of figure for legend.
C. Network plots of a primary PDAC (P3, left) and liver metastasis (right) demonstrating potential ligand-receptor interactions in which epithelial cells express the ligand.
D. Heatmap showing top interaction scores for each cell-type pair where epithelial cells express the ligand. Sample origin, stage, and receptor-expressing cells are annotated above the heatmap. Ligand-receptor interaction class is annotated to the left. P1–5, primary 1–5; VM, vaginal apex metastasis; LiM, liver metastasis; LuM, lung metastasis; PM, peritoneal metastasis.
We also explored the reverse interactions in which ligands were expressed on epithelial cells and receptors on TME cells, which again revealed more connections with fibroblasts and myeloid cells (Figure 6C; Supplementary Figure S9C and S9D). Most prominent interactions with fibroblasts were growth factors, and interactions with immune cells involved cytokine and checkpoint genes (Figure 6D). Of note, epithelial cells interacted with T/NK cells via IL18-IL18R1 and LGALS9-HAVCR2. IL18 has been shown to promote IFNγ production in T/NK cells (43), and the interaction between LGALS9 and HAVCR2 can suppress T cell-mediated immunity (44). Additional immunosuppressive interactions between epithelial and T cells included PVR-TIGIT and CD274-PDCD1. Interactions with myeloid and dendritic cells included CD24-SIGLEC10, which promotes immune evasion and is a potential target in cancer immunotherapy (45). One of the most common interactions between B and epithelial cells was BTLA-TNFRSF14 (also known as herpesvirus entry mediator or HVEM), which can suppress both T and B cell-mediated immunity (46). Overall, these results suggest that PDAC tumor cells can drive an immunosuppressive microenvironment by affecting multiple immune cell types.
Discussion
We systematically analyzed scRNA-seq from “real world” biopsies of primary and metastatic PDAC, demonstrating that even these scant samples recapitulate significant cellular heterogeneity. Recently, there have been multiple studies utilizing single-cell technologies in human and murine PDAC demonstrating heterogeneity in both tumor epithelial and TME compartments (8–11,24,47–49). Our data showed higher proportion of epithelial cells compared to a recent scRNA-seq studies on surgically resected PDAC tumors (9,10), while the most common immune cell types were myeloid and T cells, consistent with these studies. We performed comprehensive analyses on our dataset including transcriptomics subtyping at single-cell resolution, which revealed two subtypes specific to tumor epithelial cells, namely classical (or pancreatic progenitor) and basal-like (or QM/squamous), confirming the results from a previous analysis of bulk tumors (16). Furthermore, metastatic lesions were more likely to harbor a higher proportion of aggressive basal-like subtype of cells, which was also previously reported in a separate PDAC cohort using bulk transcriptome (50). Notably, we show that although projected bulk transcriptome of each tumor sample classifies PDAC dichotomously as one of two subtypes, at single cell resolution, even limited PDAC biopsies are comprised of more than one subtype. This finding may be of clinical importance in light of the COMPASS trial, which showed that classical PDAC is more likely to respond to first-line chemotherapy, while basal-like tumors tend to be chemo-resistant (51). The existence of basal-like cells within an “apparently classical” tumor could lead to preferential enrichment of basal-like cells and emergence of resistance. Thus, future iterations of trials such as COMPASS that rely on subtyping using core biopsies may need to provide a quantitative measure of cellular subtypes present rather than a qualitative dichotomous readout. The coexistence of multiple subtypes within each tumor also raises the possibility of transcriptomic plasticity between epithelial and mesenchymal phenotypes with disease progression or response to therapy, as demonstrated previously (52).
Furthermore, the overall gene expression profile and cell type proportions revealed several putative mechanisms of immune suppression in PDAC, such as the expression of immune suppressive genes by myeloid cells and inhibitory receptors in T cells, polarization of macrophages towards M2 phenotype, as well as the presence of apCAFs that may inhibit T cell-mediated immune response. A recent study demonstrated the expression of immune checkpoint receptors such as TIGIT and HAVCR2 in T and NK cells, as well as the expression of their corresponding ligands PVR and LGALS9 in cancer cells, demonstrating alterations of the immune environment of PDAC (11). Prediction of the prevalent ligand-receptor “interactome” in our data also revealed multiple mechanisms by which tumor-TME interactions may contribute to inflammation and immune evasion including PVR-TIGIT and LGALS9-HAVCR2. Furthermore, CAFs have been shown to drive PDAC plasticity and heterogeneity via TGF-β1 upregulation of MAPK/STAT3 (53). Accordingly, our LR interactome predicted TGFB-TGFBR axis to be upregulated between fibroblasts and cancer cells.
Through integrative analysis of scRNA-seq data from “real world” biopsies, we uncovered implicit heterogeneity of low-input biopsy samples in PDAC that demonstrates potential mechanisms for immune evasion and provide high-resolution data correlating cell types to clinically relevant molecular subtypes. Deep characterization using a contemporaneous biopsy may provide a valid orthogonal approach to precision medicine approaches when paired with further precision strategies such as NGS for actionable DNA alterations and drug sensitivity testing on patient derived ex vivo cultures such as organoids.
Supplementary Material
Statement of Translational Relevance.
The application of single-cell RNA sequencing to diagnostic pancreatic cancer biopsies provides in-depth transcriptomic characterization of the tumor epithelium and microenvironment. This reveals the presence of subpopulations of cancer and stromal cells which may predict the emergence of chemoresistance and putative immunotherapeutic targets.
Acknowledgements
We thank Mark W. Hurd (The University of Texas MD Anderson Cancer Center) for assistance with sample acquisition.
Financial Support:
A.M. is supported by the MD Anderson Pancreatic Cancer Moon Shot Program, the Khalifa Bin Zayed Al-Nahyan Foundation, and the National Institutes of Health (NIH U01CA196403, U01CA200468, P50CA221707). C.M.T. is supported by the NIH (R01CA227518-01A1), Cancer Prevention and Research Institute of Texas (CPRIT RR140012), Mark Foundation, V Foundation (V2015-22), Kimmel Foundation, McNair Foundation, and Reaumond Family Foundation. A.S. is supported by the German Research Foundation (SE-2616/2-1). V.B. is supported by the NIH (U54CA096300, U54CA096297, T32CA217789). J.J.L. is supported by the NIH (T32CA009599).
Footnotes
Disclosures: A.M. receives royalties for a pancreatic cancer biomarker test from Cosmos Wisdom Biotechnology, and this financial relationship is managed and monitored by the UTMDACC Conflict of Interest Committee. A.M. is also listed as an inventor on a patent that has been licensed by Johns Hopkins University to Thrive Earlier Detection. C.L.H. is on the Scientific Advisory Board of BriaCell and has no conflict of interest relevant to this study.
References
- 1.Kleeff J, Korc M, Apte M, Vecchia CL, Johnson CD, Biankin AV, et al. Pancreatic cancer. Nat Rev Dis Primers. 2016;2:16022. [DOI] [PubMed] [Google Scholar]
- 2.Conrad R, Castelino-Prabhu S, Cobb C, Raza A. Cytopathology of the pancreatobiliary tract-the agony, and sometimes, the ease of it. J Gastrointest Oncol. 2013;4:210–9. [DOI] [PMC free article] [PubMed] [Google Scholar]
- 3.VanderLaan PA. Fine‐needle aspiration and core needle biopsy: An update on 2 common minimally invasive tissue sampling modalities. Cancer Cytopathol. 2016;124:862–70. [DOI] [PubMed] [Google Scholar]
- 4.Chantrill LA, Nagrial AM, Watson C, Johns AL, Martyn-Smith M, Simpson S, et al. Precision Medicine for Advanced Pancreas Cancer: The Individualized Molecular Pancreatic Cancer Therapy (IMPaCT) Trial. Clin Cancer Res. 2015;21:2029–37. [DOI] [PubMed] [Google Scholar]
- 5.Aguirre AJ, Nowak JA, Camarda ND, Moffitt RA, Ghazani AA, Hazar-Rethinam M, et al. Real-time genomic characterization of advanced pancreatic cancer to enable precision medicine. Cancer Discov. 2018;8:CD-18–0275. [DOI] [PMC free article] [PubMed] [Google Scholar]
- 6.Dreyer SB, Chang DK, Bailey P, Biankin AV. Pancreatic Cancer Genomes: Implications for Clinical Management and Therapeutic Development. Clin Cancer Res. 2017;23:1638–46. [DOI] [PubMed] [Google Scholar]
- 7.Collisson EA, Bailey P, Chang DK, Biankin AV. Molecular subtypes of pancreatic cancer. Nat Rev Gastroentero. 2019;16:207–20. [DOI] [PubMed] [Google Scholar]
- 8.Bernard V, Semaan A, Huang J, Lucas FAS, Mulu FC, Stephens BM, et al. Single Cell Transcriptomics of Pancreatic Cancer Precursors Demonstrates Epithelial and Microenvironmental Heterogeneity as an Early Event in Neoplastic Progression. Clin Cancer Res. 2018;25:clincanres.1955.2018. [DOI] [PMC free article] [PubMed] [Google Scholar]
- 9.Elyada E, Bolisetty M, Laise P, Flynn WF, Courtois ET, Burkhart RA, et al. Cross-Species Single-Cell Analysis of Pancreatic Ductal Adenocarcinoma Reveals Antigen-Presenting Cancer-Associated Fibroblasts. Cancer Discov. 2019;9:1102–23. [DOI] [PMC free article] [PubMed] [Google Scholar]
- 10.Peng J, Sun B-F, Chen C-Y, Zhou J-Y, Chen Y-S, Chen H, et al. Single-cell RNA-seq highlights intra-tumoral heterogeneity and malignant progression in pancreatic ductal adenocarcinoma. Cell Res. 2019;29:725–38. [DOI] [PMC free article] [PubMed] [Google Scholar]
- 11.Steele NG, Carpenter ES, Kemp SB, Sirihorachai VR, The S, Delrosario L, et al. Multimodal mapping of the tumor and peripheral blood immune landscape in human pancreatic cancer. Nat Cancer. 2020;1:1097–112. [DOI] [PMC free article] [PubMed] [Google Scholar]
- 12.Muraro MJ, Dharmadhikari G, Grün D, Groen N, Dielen T, Jansen E, et al. A Single-Cell Transcriptome Atlas of the Human Pancreas. Cell Syst. 2016;3:385–394.e3. [DOI] [PMC free article] [PubMed] [Google Scholar]
- 13.Initiative APCG, Bailey P, Chang DK, Nones K, Johns AL, Patch A-M, et al. Genomic analyses identify molecular subtypes of pancreatic cancer. Nature. 2016;531:47–52. [DOI] [PubMed] [Google Scholar]
- 14.Collisson EA, Sadanandam A, Olson P, Gibb WJ, Truitt M, Gu S, et al. Subtypes of pancreatic ductal adenocarcinoma and their differing responses to therapy. Nat Med. 2011;17:500–3. [DOI] [PMC free article] [PubMed] [Google Scholar]
- 15.Moffitt RA, Marayati R, Flate EL, Volmar KE, Loeza SGH, Hoadley KA, et al. Virtual microdissection identifies distinct tumor- and stroma-specific subtypes of pancreatic ductal adenocarcinoma. Nat Genet. 2015;47:1168–78. [DOI] [PMC free article] [PubMed] [Google Scholar]
- 16.Raphael BJ, Hruban RH, Aguirre AJ, Moffitt RA, Yeh JJ, Stewart C, et al. Integrated Genomic Characterization of Pancreatic Ductal Adenocarcinoma. Cancer Cell. 2017;32:185–203.e13. [DOI] [PMC free article] [PubMed] [Google Scholar]
- 17.Hoshida Y Nearest Template Prediction: A Single-Sample-Based Flexible Class Prediction with Confidence Assessment. Plos One. 2010;5:e15543. [DOI] [PMC free article] [PubMed] [Google Scholar]
- 18.Chan-Seng-Yue M, Kim JC, Wilson GW, Ng K, Figueroa EF, O’Kane GM, et al. Transcription phenotypes of pancreatic cancer are driven by genomic events during tumor evolution. Nat Genet. 2020;52:231–40. [DOI] [PubMed] [Google Scholar]
- 19.Hayashi A, Fan J, Chen R, Ho Y, Makohon-Moore AP, Lecomte N, et al. A unifying paradigm for transcriptional heterogeneity and squamous features in pancreatic ductal adenocarcinoma. Nat Cancer. 2020;1:59–74. [DOI] [PMC free article] [PubMed] [Google Scholar]
- 20.Raghavan S, Winter PS, Navia AW, Williams HL, DenAdel A, Kalekar RL, et al. The tumor microenvironment drives transcriptional phenotypes and their plasticity in metastatic pancreatic cancer. Biorxiv. 2021;2020.08.25.256214. [Google Scholar]
- 21.Öhlund D, Handly-Santana A, Biffi G, Elyada E, Almeida AS, Ponz-Sarvise M, et al. Distinct populations of inflammatory fibroblasts and myofibroblasts in pancreatic cancerFibroblast heterogeneity in pancreatic cancer. J Exp Medicine. 2017;214:579–96. [DOI] [PMC free article] [PubMed] [Google Scholar]
- 22.Biffi G, Oni TE, Spielman B, Hao Y, Elyada E, Park Y, et al. IL-1-induced JAK/STAT signaling is antagonized by TGF-beta to shape CAF heterogeneity in pancreatic ductal adenocarcinoma. Cancer Discov. 2018;9:CD-18–0710. [DOI] [PMC free article] [PubMed] [Google Scholar]
- 23.Hosein AN, Brekken RA, Maitra A. Pancreatic cancer stroma: an update on therapeutic targeting strategies. Nat Rev Gastroentero. 2020;17:487–505. [DOI] [PMC free article] [PubMed] [Google Scholar]
- 24.Hosein AN, Huang H, Wang Z, Parmar K, Du W, Huang J, et al. Cellular heterogeneity during mouse pancreatic ductal adenocarcinoma progression at single-cell resolution. JCI Insight. 2019;4. [DOI] [PMC free article] [PubMed] [Google Scholar]
- 25.Henze A-T, Mazzone M. The impact of hypoxia on tumor-associated macrophages. J Clin Invest. 2016;126:3672–9. [DOI] [PMC free article] [PubMed] [Google Scholar]
- 26.Villani A-C, Satija R, Reynolds G, Sarkizova S, Shekhar K, Fletcher J, et al. Single-cell RNA-seq reveals new types of human blood dendritic cells, monocytes, and progenitors. Science. 2017;356:eaah4573. [DOI] [PMC free article] [PubMed] [Google Scholar]
- 27.Lavin Y, Kobayashi S, Leader A, Amir ED, Elefant N, Bigenwald C, et al. Innate Immune Landscape in Early Lung Adenocarcinoma by Paired Single-Cell Analyses. Cell. 2017;169:750–765.e17. [DOI] [PMC free article] [PubMed] [Google Scholar]
- 28.Hegde S, Krisnawan VE, Herzog BH, Zuo C, Breden MA, Knolhoff BL, et al. Dendritic Cell Paucity Leads to Dysfunctional Immune Surveillance in Pancreatic Cancer. Cancer Cell. 2020;37:289–307.e9. [DOI] [PMC free article] [PubMed] [Google Scholar]
- 29.Munn DH, Sharma MD, Lee JR, Jhaver KG, Johnson TS, Keskin DB, et al. Potential Regulatory Function of Human Dendritic Cells Expressing Indoleamine 2,3-Dioxygenase. Science. 2002;297:1867–70. [DOI] [PubMed] [Google Scholar]
- 30.Guo X, Zhang Y, Zheng L, Zheng C, Song J, Zhang Q, et al. Global characterization of T cells in non-small-cell lung cancer by single-cell sequencing. Nat Med. 2018;24:978–85. [DOI] [PubMed] [Google Scholar]
- 31.Crinier A, Milpied P, Escalière B, Piperoglou C, Galluso J, Balsamo A, et al. High-Dimensional Single-Cell Analysis Identifies Organ-Specific Signatures and Conserved NK Cell Subsets in Humans and Mice. Immunity. 2018;49:971–986.e5. [DOI] [PMC free article] [PubMed] [Google Scholar]
- 32.Vento-Tormo R, Efremova M, Botting RA, Turco MY, Vento-Tormo M, Meyer KB, et al. Single-cell reconstruction of the early maternal–fetal interface in humans. Nature. 2018;563:347–53. [DOI] [PMC free article] [PubMed] [Google Scholar]
- 33.Efremova M, Vento-Tormo M, Teichmann SA, Vento-Tormo R. CellPhoneDB: inferring cell–cell communication from combined expression of multi-subunit ligand–receptor complexes. Nat Protoc. 2020;15:1484–506. [DOI] [PubMed] [Google Scholar]
- 34.Yaddanapudi K, Rendon BE, Lamont G, Kim EJ, Rayyan NA, Richie J, et al. MIF Is Necessary for Late-Stage Melanoma Patient MDSC Immune Suppression and Differentiation. Cancer Immunol Res. 2016;4:101–12. [DOI] [PMC free article] [PubMed] [Google Scholar]
- 35.Simpson KD, Templeton DJ, Cross JV. Macrophage Migration Inhibitory Factor Promotes Tumor Growth and Metastasis by Inducing Myeloid-Derived Suppressor Cells in the Tumor Microenvironment. J Immunol. 2012;189:5533–40. [DOI] [PMC free article] [PubMed] [Google Scholar]
- 36.Funamizu N, Hu C, Lacy C, Schetter A, Zhang G, He P, et al. Macrophage migration inhibitory factor induces epithelial to mesenchymal transition, enhances tumor aggressiveness and predicts clinical outcome in resected pancreatic ductal adenocarcinoma. Int J Cancer. 2013;132:785–94. [DOI] [PMC free article] [PubMed] [Google Scholar]
- 37.Hansel DE, Rahman A, Wehner S, Herzog V, Yeo CJ, Maitra A. Increased Expression and Processing of the Alzheimer Amyloid Precursor Protein in Pancreatic Cancer May Influence Cellular Proliferation. Cancer Research. 2003;63:7032–7037. [PubMed] [Google Scholar]
- 38.Klasen C, Ziehm T, Huber M, Asare Y, Kapurniotu A, Shachar I, et al. LPS-mediated cell surface expression of CD74 promotes the proliferation of B cells in response to MIF. Cell Signal. 2018;46:32–42. [DOI] [PubMed] [Google Scholar]
- 39.Pylayeva-Gupta Y, Das S, Handler JS, Hajdu CH, Coffre M, Koralov SB, et al. IL35-Producing B Cells Promote the Development of Pancreatic Neoplasia. Cancer Discov. 2016;6:247–55. [DOI] [PMC free article] [PubMed] [Google Scholar]
- 40.Lee KE, Spata M, Bayne LJ, Buza EL, Durham AC, Allman D, et al. Hif1a Deletion Reveals Pro-Neoplastic Function of B Cells in Pancreatic Neoplasia. Cancer Discov. 2016;6:256–69. [DOI] [PMC free article] [PubMed] [Google Scholar]
- 41.Gunderson AJ, Kaneda MM, Tsujikawa T, Nguyen AV, Affara NI, Ruffell B, et al. Bruton Tyrosine Kinase–Dependent Immune Cell Cross-talk Drives Pancreas Cancer. Cancer Discov. 2016;6:270–85. [DOI] [PMC free article] [PubMed] [Google Scholar]
- 42.Camp JG, Sekine K, Gerber T, Loeffler-Wirth H, Binder H, Gac M, et al. Multilineage communication regulates human liver bud development from pluripotency. Nature. 2017;546:533–8. [DOI] [PubMed] [Google Scholar]
- 43.Nakanishi K, Yoshimoto T, Tsutsui H, Okamura H. Interleukin-18 Regulates Both Th1 and Th2 Responses. Annu Rev Immunol. 2001;19:423–74. [DOI] [PubMed] [Google Scholar]
- 44.Rabinovich GA, Toscano MA. Turning “sweet” on immunity: galectin–glycan interactions in immune tolerance and inflammation. Nat Rev Immunol. 2009;9:338–52. [DOI] [PubMed] [Google Scholar]
- 45.Barkal AA, Brewer RE, Markovic M, Kowarsky M, Barkal SA, Zaro BW, et al. CD24 signalling through macrophage Siglec-10 is a target for cancer immunotherapy. Nature. 2019;572:392–6. [DOI] [PMC free article] [PubMed] [Google Scholar]
- 46.Vendel AC, Calemine-Fenaux J, Izrael-Tomasevic A, Chauhan V, Arnott D, Eaton DL. B and T Lymphocyte Attenuator Regulates B Cell Receptor Signaling by Targeting Syk and BLNK. J Immunol. 2009;182:1509–17. [DOI] [PubMed] [Google Scholar]
- 47.Lin W, Noel P, Borazanci EH, Lee J, Amini A, Han IW, et al. Single-cell transcriptome analysis of tumor and stromal compartments of pancreatic ductal adenocarcinoma primary tumors and metastatic lesions. Genome Med. 2020;12:80. [DOI] [PMC free article] [PubMed] [Google Scholar]
- 48.Schlesinger Y, Yosefov-Levi O, Kolodkin-Gal D, Granit RZ, Peters L, Kalifa R, et al. Single-cell transcriptomes of pancreatic preinvasive lesions and cancer reveal acinar metaplastic cells’ heterogeneity. Nat Commun. 2020;11:4516. [DOI] [PMC free article] [PubMed] [Google Scholar]
- 49.Dominguez CX, Müller S, Keerthivasan S, Koeppen H, Hung J, Gierke S, et al. Single-Cell RNA Sequencing Reveals Stromal Evolution into LRRC15+ Myofibroblasts as a Determinant of Patient Response to Cancer Immunotherapy. Cancer Discov. 2020;10:232–53. [DOI] [PubMed] [Google Scholar]
- 50.Connor AA, Denroche RE, Jang GH, Lemire M, Zhang A, Chan-Seng-Yue M, et al. Integration of Genomic and Transcriptional Features in Pancreatic Cancer Reveals Increased Cell Cycle Progression in Metastases. Cancer Cell. 2019;35:267–282.e7. [DOI] [PMC free article] [PubMed] [Google Scholar]
- 51.Aung KL, Fischer SE, Denroche RE, Jang G-H, Dodd A, Creighton S, et al. Genomics-Driven Precision Medicine for Advanced Pancreatic Cancer - Early Results from the COMPASS Trial. Clin Cancer Res. 2017;24:clincanres.2994.2017. [DOI] [PMC free article] [PubMed] [Google Scholar]
- 52.Porter RL, Magnus NKC, Thapar V, Morris R, Szabolcs A, Neyaz A, et al. Epithelial to mesenchymal plasticity and differential response to therapies in pancreatic ductal adenocarcinoma. Proc National Acad Sci. 2019;116:26835–45. [DOI] [PMC free article] [PubMed] [Google Scholar]
- 53.Ligorio M, Sil S, Malagon-Lopez J, Nieman LT, Misale S, Pilato MD, et al. Stromal Microenvironment Shapes the Intratumoral Architecture of Pancreatic Cancer. Cel. 2019;178:160–175.e27. [DOI] [PMC free article] [PubMed] [Google Scholar]
Associated Data
This section collects any data citations, data availability statements, or supplementary materials included in this article.
Supplementary Materials
Data Availability Statement
The datasets generated during the current study are available in the Gene Expression Omnibus repository under accession number GSE156405