Abstract
Postherpetic neuralgia (PHN) is a painful neuropathic complication resulting from herpes zoster (HZ). The pain manifests in peripheral nerves infected by herpesviruses, mostly from reactivation of latent varicella zoster virus. Mechanistic descriptions suggest that PHN develops because of disrupted immune system signaling and inflammation or peripheral nerve damage; however, the pathophysiology is not clear. It is difficult to predict/prevent PHN manifestations of HZ patients due to the lack of accurate diagnostics. In this study, sera from healthy controls, HZ patients, and PHN patients were subjected to an interferon (IFN) expression profile (IEP) study. The corresponding cDNAs were analyzed by quantitative reverse transcription-polymerase chain reaction (qRT-PCR) using primer pairs against a panel of 21 different IFN subtypes. The results showed that distinct IEPs were observed among HZ and PHN cohorts in comparison to the healthy controls. Together, this pilot study suggested that the IEP study may be used as a molecular tool for diagnosis of PHN and assist in designing new PHN therapeutic protocols.
Keywords: interferons, herpes zoster, Postherpetic Neuralgia, diagnoses
Introduction
Postherpetic neuralgia (PHN) is a long-lasting neurological condition. It is associated with excruciating pain following remittance of herpes zoster (HZ) (9,22). HZ manifestations range from a mild itch to agonizing rash and lesions or shingles, all results of the reactivation of dormant or latent varicella zoster virus (VZV) infections (23). Furthermore, PHN can manifest regardless of clinical presentation of zoster (12). PHN generally arises in elderly individuals or in patients with compromised immune systems (8). The PHN-mediated pain resulted from the inflammation to nerve fibers caused by the onset of viral infection, generally appears in the same area of the HZ (23). Ironically, affected skin areas may be either oversensitive or numb with reduced sensation (4). As of today, idiopathic neuralgia is diagnosed as PHN for patients who recently experienced HZ followed by pain sustaining 3 months or longer after the onset of HZ. In the moment, there is no molecular tool for objective, rapid diagnosis (11).
Several pathophysiological mechanistic theories describe PHN as a result of neuronal damage from virus-infected cell lysis, disrupted inflammatory signaling, vasoconstriction with consequent ischemic nerve damage, and increased gray matter volume (16,17). All these concepts, however, include an immunological component. Each of these circumstances would arise from or cause the generation of either pathogen-associated molecular patterns (PAMPs); or damage-associated molecular patterns (DAMPs) (13,14,18,20,21). The immune system has developed to be sensitive to both PAMPs and DAMPs. Each is recognized by toll-like receptors (TLRs), of neuronal, proximal, and immune cells. PAMP/DAMP recognition by TLRs leads to distinct causation-specific expression of immune-mediating cytokines and chemokines that orchestrate the immune response (10). Interferons (IFNs) are the master regulation messengers of immune system, which regulate downstream cytokine and chemokine production, immune cell maturation, and immune cell translocation (1–3,5,19,21,25,26). These IFN signaling activities are conducted by complex IFN subtype expression profiles (IEPs). IFN subtypes are classically organized into three major sequence homology subtypes: alpha, beta, and gamma (13). Recent progress now describes a complex family of over 20 subtypes, each with distinct biological roles (21). More conventional IFN subtype nomenclature organizes IFNs by receptor/function; IFN type I, IFN type II, and IFN type III classes. The type I IFNs are composed of 13 unique IFN-alpha subtypes, an IFN-beta, an epsilon, a kappa, and an omega (18,21). The remaining IFN types include a single type II gene, IFN gamma, and three type III genes: IFN-lambda 1, 2, and 3. In this study, the expression of 21 unique IFN genes is characterized in patient blood samples (21). Numerous publications have shown that IFNs are powerful regulators of the innate and adaptive immune response in a wide variety of clinical conditions (18). The IFNs are produced in combinations that are specific to the stimulus. These specific IFN combinations orchestrated a coordinated immune response. The expression patterns and functionality of type I and III patterns exhibit considerable overlap that will likely confound the IFN stimulated gene (ISG) patterns (10,14).
The type I IFN (IFN-I) family is extensively studied and has been implicated in autoimmune and infectious diseases for decades (3,21). Despite this fact, their exact subtype role remains unclear (3,20,24). In terms of the roles of IFN-I in the pathophysiology, the specific IFN-I genes per se and each of their absolute amounts have not been thoroughly interrogated due to technical limitations. Instead, the genes turned on by IFN-I, the ISGs, are used to indirectly detect the likely presence of IFN-I. This concept has further evolved into an idea of type I “interferon signature” based on a wide number of studies (5). One key aspect important to IFN diagnostic and therapeutic development remains that the ISGs are not exclusively responsive to only IFN-I. This can confound the ability to understand what IFNs are markers for disease, and what IFNs are not involved at all.
Herpes virus infections cause pathogen-specific IFN signaling, whereas aberrant but discrete IFN expression is observed (20). When considered collectively, the differential expression of these IFNs may have the power to describe its underlying pathogen, likely effective therapies, disease progress, and pharmacological remedies. Prior establishment of using IFNs as biomarkers include transcriptomic and proteomic analysis, but were limited to the analysis of one or a few IFN subtypes (20,21). Transcriptomic analysis of IFN mRNAs is restricted by polymerase chain reaction (PCR) primer specificity due to the lack of intron in IFN genes. This and mRNA sequence homology has led to a lack of IFN subtype primers satisfying Minimum Information for Publication of Quantitative Real-Time PCR Experiments (MIQE) guidelines. High sequence homology of IFN proteins also limits the specificity of proteomic analysis and leads to substantial cross reactivity. Thus, early investigations lacked specificity and sensitivity to detect, analyze, and consider each subtype as an individual biomarker and could not consider the sum of each expression to develop an expression array profile (10).
In this study, a licensed patented array of PCR primer pairs and probes with MIQE sufficiency, specificity, and efficiency was used to differentially amplify and detect 21 IFN subtypes via quantitative PCR. These primers utilize molecular beacons and locked nucleic acids to impart their specificity and sensitivity. This technology was used to investigate if there is a difference of IFN signatures between HZ and PHN in comparison to healthy controls.
Materials and Methods
Sample collection
A variety of blood samples containing ICD10 codes of HZ or PHN (Table 1) were purchased from Discovery Life Sciences (800 Hudson Way, Suite 1700, Huntsville, AL 35806). The demographic data such as the date of collection, age, gender, and ethnicity are provided. All patient samples collected are under prior IRB/EC approval with a unique ID number. Upon acquisition, the samples will be stored in −80°C freezer and subjected to RNA isolation and purification immediately. The sera of healthy controls were purchased from Discovery Life Sciences with an approved IRB. The samples have been tested by U.S. Food and Drug Administration (FDA) Licensed Nucleic Acid Testing and the results are negative for hepatitis B virus (HBV) DNA, HIV-1 RNA, hepatitis C virus (HCV) RNA, West Nile RNA, ZIKA, and so on.
Table 1.
ICD10 Codes of the Purchased Blood Samples Associated with Herpes Zoster or Postherpetic Neuralgia
| B02.23: Postherpetic polyneuropathy |
| B02.29: Other postherpetic nervous system involvement |
| B02.30: Zoster ocular disease |
| B02.33: Herpes zoster keratitis |
| B02.8: Zoster with other complication |
| B02.9: Zoster without complications |
RNA purification and cDNA synthesis
The sample RNA was purified from whole blood cell lysates by TRIzol™ (Cat. no.: 15596026, Fisher Scientific) essentially described by manufacturer. The concentration and purity were measured by Abs of 260:280 with a NanoVue spectrophotometer (Cat no.: 28-9569-66; GE Health care) and stored at −80°C until use. First-strand cDNA synthesis was performed by iScript™ cDNA Synthesis kit (Cat. no.: 1708890; Bio-Rad). It is primed with both random hexamers and oligo-dT primers followed by RNase H treatment according to manufacturer's instructions.
Synthesis of PCR primers and TaqMan probe
The sequence design of the primers and the probes (Table 2) was previously published in the supplementary information of the article (15).
Table 2.
Primer Sequences
| Gene | Accession no. | Forward primer | Sequence position | Conc (nM) | Inhibitor | Conc | Probe | Inhibitor | Sense | Sequence_position | Conc (nM) | Reverse primer | Sequence_position | Conc (nM) | Inhibitor | Conc |
|---|---|---|---|---|---|---|---|---|---|---|---|---|---|---|---|---|
| IFNA1/13 | J00210/V00538 | tagacaaattctgcaccgaac | 245–265 | 300 | ctCccaCccTctcCtc | (−) | 307–322 | 31.25 | agatggagtccicattcatc | 333–352 | 300 | |||||
| IFNA5 | X02956 | cacttctagacaaattctacactg | 239–262 | 150 | ttcCacTccAacCtcct | (−) | 305–321 | 125 | ggatagagtccacattcatcag | 331–352 | 150 | |||||
| IFNA6 | X02958 | tgattcagcagaccttcaatc | 179–199 | 200 | agcCtcTcaTccCaagc | (−) | 226–242 | 62.5 | tgctggtaaagttcagtatagag | 253–275 | 200 | |||||
| IFNA7 | X02960 | cagacccacagcctgcgt | 13–30 | 150 | cgcgatctggcacaaatgggaagaatctctcctttgatcgcg | (+) | 53–80 | 125 | aaactcctcctctgggaatctg | 108–129 | 150 | |||||
| IFNA8 | X03125 | gatgataaacagttccagaagg | 130–151 | 150 | ctcaTccAaaGcaGcag | (−) | 221–237 | 31.25 | aagttcgatgtagaattcatctag | 244–267 | 150 | |||||
| IFNA10 | X02961 | gggacaaatgggaagaatctc | 54–74 | 350 | agacatGatTtccGaaTcccc | (+) | 97–117 | 62.5 | aactggttgccatcaaactc | 124–143 | 350 | |||||
| IFNA14 | X02959 | aggaggaatttgatggcaac | 119–138 | 150 | tccaGaaAgcTcaAgcc | (+) | 143–159 | 62.5 | agcagcagatgagttctttg | 209–228 | 150 | |||||
| IFNA16 | X02957 | attgaacttttccagcaactg | 259–279 | 300 | atgaCctAgaAgcCtgt | (+) | 281–297 | 31.25 | ttcatcagggcaatctcttc | 319–338 | 300 | |||||
| IFNA17 | V00532 | aagaatctctcctttctcctgcctg | 66–90 | 250 | acagacCtgActTtggaCtt | (+) | 95–114 | 125 | gatcatctcatggaggacag | 164–183 | 250 | |||||
| IFNA21 | V00540 | tcatctgctacttgggaacag | 217–237 | 250 | cgcgatctcctgtatcacgcaggcttccatgatcgcg | (−) | 286–308 | 125 | cacattcatcaggggagtctc | 322–342 | 250 | |||||
| IFNB | NM_002176 | ttgacatccctgaggagattaagc | 812–822 | 300 | ccagaaggaggacgccgcattgacc | (+) | 823–840 | 62.5 | ttagccaggaggttctcaacaatag | 872–891 | 300 | |||||
| IFNG | NM_000619 | ttggaaagaggagagtgacag | 174–194 | 300 | cgcgatctggatgctctggtcatctttaaagtttgatcgcg | (−) | 242–269 | 62.5 | acattcatgtcttccttgatgg | 284–305 | 300 | |||||
| IL29 | NM_172140 | gttcaaatctctgtcaccac | 123–142 | 150 | cgaGctTcaAgaAggcc | (+) | 152–168 | 125 | ttcagcttgagtgactcttc | 181–200 | 150 | |||||
| IL28A | NM_172138 | gccaaagatgccttagaagag | 166–186 | 150 | cgcgatcgcaggtgccactcccgcctctgatcgcg | (+) | 206–226 | 250 | cagaaccttcagcgtcagg | 297–315 | 150 | |||||
| IL28B | NM_172139 | gccaaagatgccttagaagag | 166–186 | 300 | cgcgatcgcaagtgccgctcccgcctctgatcgcg | (+) | 206–226 | 62.5 | cagaaccttcagcgtcagg | 297–315 | 300 | |||||
| IFNA2 | V00549/V00548 | ggtagcaggaggaccttgatg | 28–48 | 200 | ccccaggaggagtttggcaac | (+) | 115–138 | 250 | ggaggacagggatggtttcag | 152–173 | 200 | |||||
| IFNA4 | NM_012068/X02955 | tcatttctcctgcctgaagg | 75–94 | 100 | TCCTTTCTCC | 1 μM | ctCgggGaatcCgaaAtc | (−) | 103–120 | 125 | gaggacagagatggcttgag | 152–171 | 100 | GAAGGCAGA | 100 nM | |
| IFNA4A | NM_012068 | gatactcctggcacaaatgg | 45–64 | 300 | cgcgatcgcttgagccttctggaactggtgggatcgcg | CTGGTTGCC | (−) | 135–158 | 125 | aaggtctgctggatcatctc | 175–194 | 300 | ||||
| IFNA4b | X02955 | gatactcctggcacaaatgg | 45–64 | 300 | cgcgatcgcttgagtcttctggaactggtgggatcgcg | CTGGTTGCC | (−) | 135–158 | 250 | aaggtctgctggatcatctc | 175–194 | 300 |
IFN, interferon.
Quantitative polymerase chain reaction (qPCR)
The quantitative gene expression will be measured by Bio-Rad's CFX96 Touch™ Real-Time PCR Detection System (Cat no.: 1855196; Bio-Rad). Experiments were performed in triplicate with one set of primers of interest or control peptidylprolyl isomerase A (PPIA) (5′-AGC ATA CGG GTC CTG GCA TCT-3′ and 5′-CAT GCT TGC CAT CCA ACC ACT CA-3′) per reaction. The sequences of the IFN assay primers are listed in Table 2. The quantitative reverse transcription- polymerase chain reaction (qRT-PCR) reactions were carried out at 45°C for 10 min, 94°C for 2 min, and then 35 cycles of 94°C for 15 sec, 69°C for 15 sec, and 72°C for 15 sec. The calculations of normalized gene expression and viral genome copy number were described previously (6,24).
Data analyses
Statistical analyses were conducted by analysis of variance (ANOVA) with post hoc Dunnett's test, while two sets of samples were analyzed by Student's t-test by Excel. Statistical significance was determined while the p-value is <0.05 (p < 0.05).
Clustergram
Bio-Rad CFX Manager software was used to visualize and cluster samples and targets clustered in a hierarchy based on the similarity of relative gene expression Delta-Delta-Ct. The data point color indicates greater expression (red), lower expression (blue), or no change in relative expression (black). The lighter the color the greater the expression level is. The principal component analyses (PCA) was performed using PARTEK® (St. Louis, Missouri 63005).
Results
Examination of patients' diagnostic codes
The samples were grouped into five cohorts based on their ICD10 codes: Cohort A, patients with HZ codes only (B02.XX). Cohort B, patients with HZ codes and total number of ICD10 codes less than 12. Cohort C, patients with PHN codes (B02.23 and B02.29) with total number of ICD10 codes more than 13. Cohort D, patients with PHN codes only. Cohort E, healthy controls without known history of diagnosis. It turns out that there are three in the Cohort A, 10 in the Cohort B, six in the Cohort C, four in the Cohort D, and four in the Cohort E.
Expression profile analysis of patients with only HZ diagnostic codes (Cohort A)
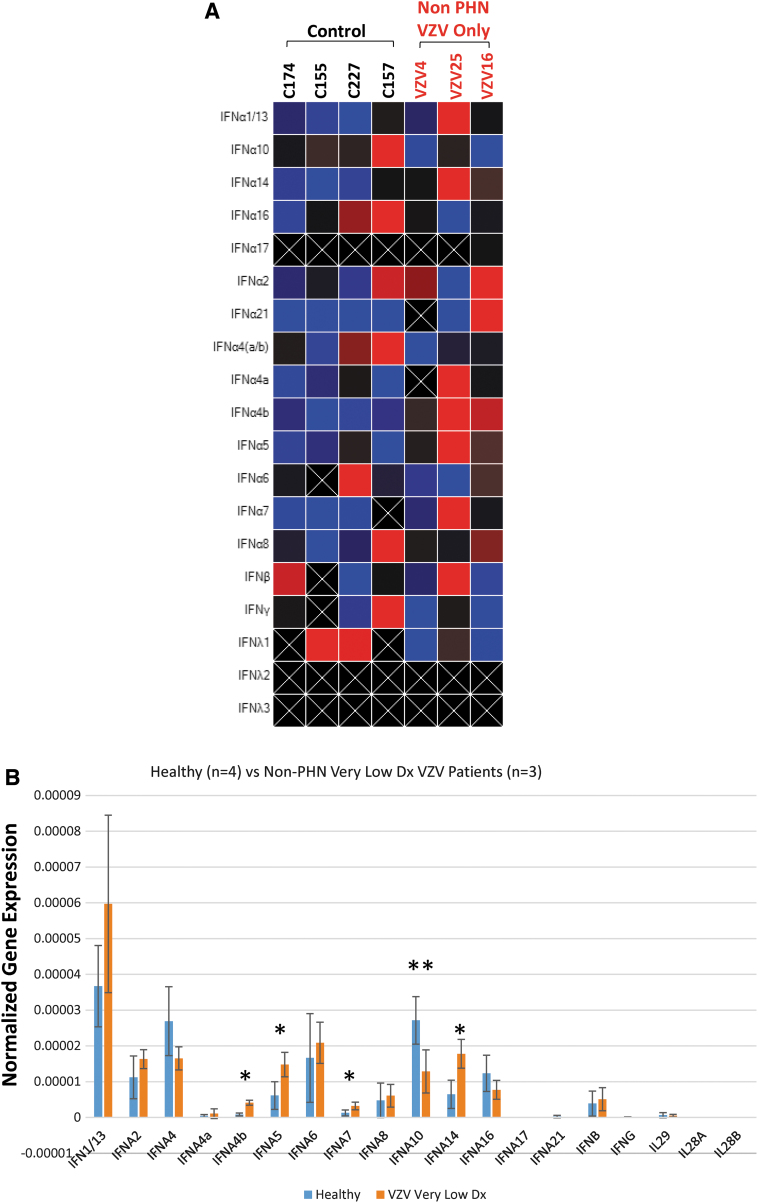
The samples in the correspondent cohorts were subjected to qRT-PCR followed by studies using clustergram heatmapping to visualize expression clustering and ANOVA for statistical analysis. The individual analysis by the clustergram heatmap revealed the complexity of the IEP (Fig. 1A). The statistical analysis showed that IFN A4b, IFN A5, IFN A7, and IFN A14 were significantly increased compared to the controls (Cohort E), whereas the IFN A10 was reduced significantly (Fig. 1B).
FIG. 1.
IEP analyses of non-PHN HZ patients (Cohort A) comparing to HC. The IEP of 19 IFN subtypes were analyzed among four HC and three patients with HZ diagnosis only. (A) Heatmap individual analysis. (B) Statistical analyses showed that four IFN subtypes IFN A4b, A5, A7, and A14 exhibited significant increase (*p < 0.05). IFN A10, otherwise, presented a significant reduction (**p < 0.05). HC, healthy controls; HZ, herpes zoster; IEP, expression profile; IFN, interferon; PHN, postherpetic neuralgia.
IEP analysis of HZ patients with 12 or less diagnoses (Cohort B)
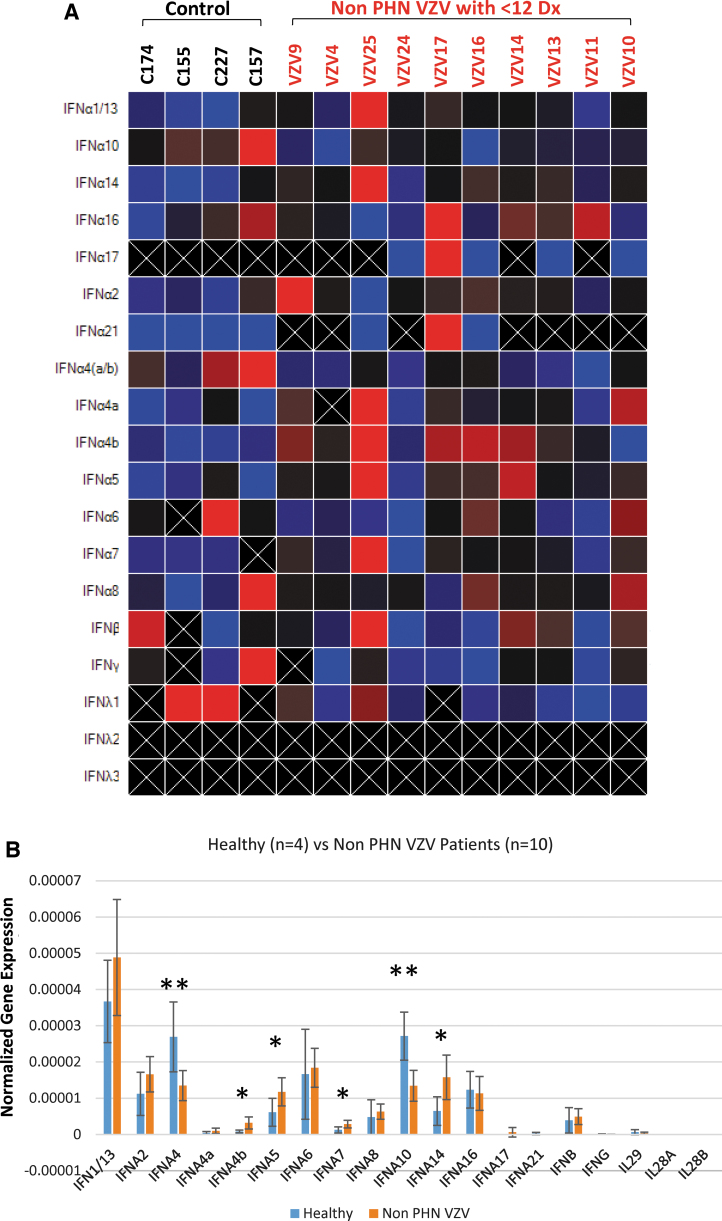
Patients usually have multiple diagnoses and it is important to comprehend if the IEP generated in Figure 1 can be applied to the patients with more diagnoses. Similar experiments were performed using Cohort B in comparison to controls and the heatmap suggested a profile with enhanced intensity IFN A4b, IFN A5, IFN A7, and IFN A14 (Fig. 2A). IFN A10 as well as IFN4, however, exhibited a signal decrease compared to the controls (Fig. 2A). The quantitative analysis corroborated the observation that IFN A4b, IFN A5, IFN A7, and IFN A14 were statistically increased comparing to the controls as we previously observed (Fig. 2B). IFN A4, nevertheless, was validated to show a significant decrease just like IFN A10 (Fig. 2B). Together, these results suggested that HZ patients without manifestation of PHN exhibited an IEP.
FIG. 2.
IEP analyses of non-PHN HZ patients with fewer other diagnoses (Cohort B). Samples of 10 non-PHN HZ patients in Cohort B were subjected to IEP analyses. (A) Heatmap individual analysis. (B) Statistical analyses showed that the same four IFN subtypes IFN A4b, A5, A7, and A14 displayed a significant increase. *Indicates significant increase, **Indicates significant decrease. IFN A4, nonetheless joined A10, presented a significant reduction.
IEP analysis of PHN patients with complex diagnoses (Cohort C)
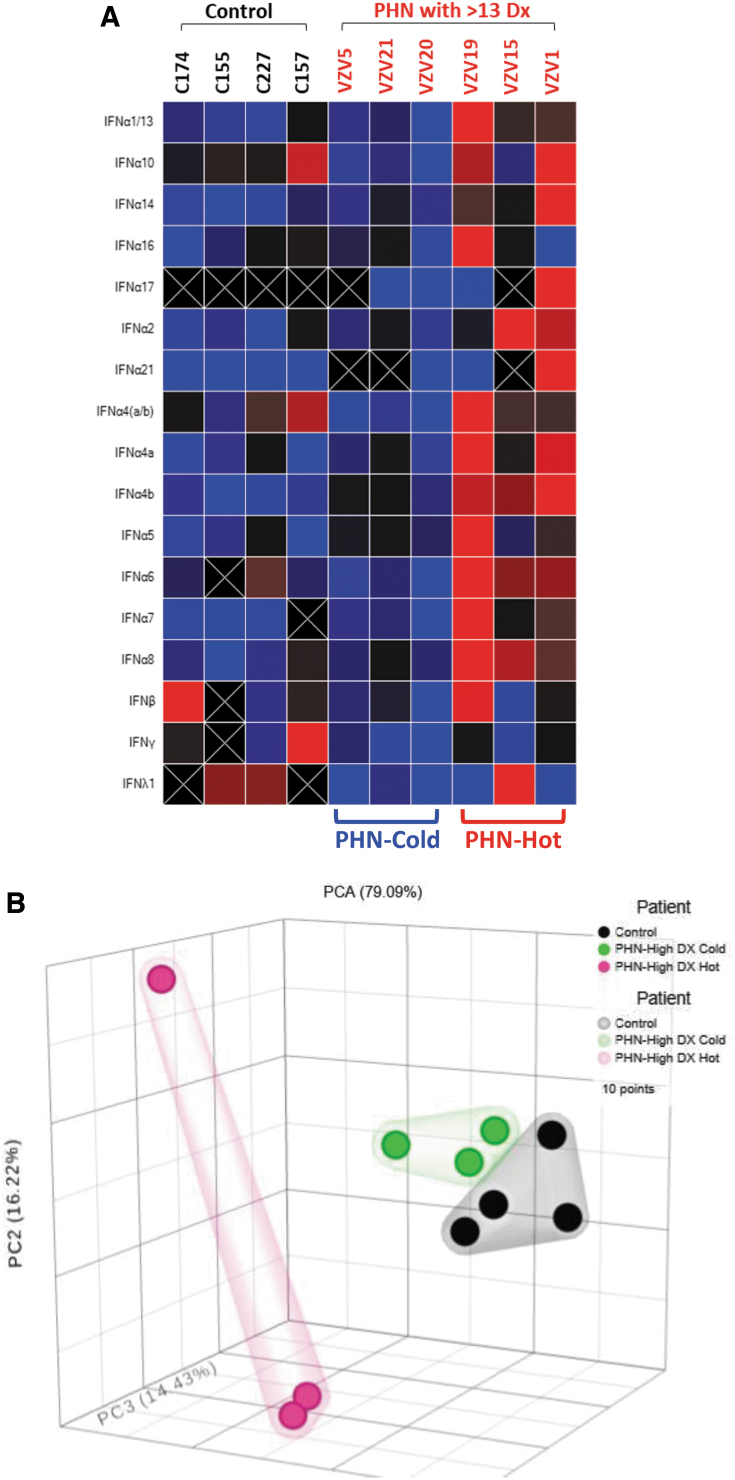
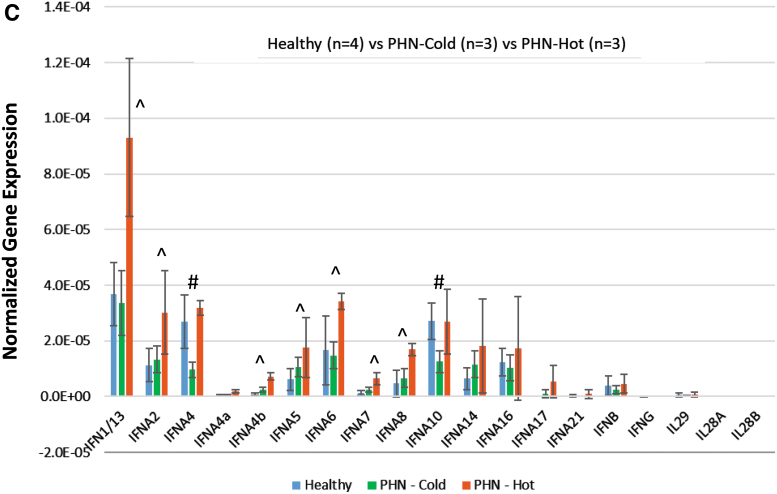
The patients in Cohort C have rather complicated diagnostic codes with a range from 17 to as many as 63 and the average number of diagnoses is 35.8. It is likely to have different IEP among patients with miscellaneous conditions. The initial heatmap analysis indicated that half of these PHN patients exhibited very low IFN expression, distinct from the other half, which showed very strong IFN subtype expression (Fig. 3A). The PCA agreed with the heatmap data displaying three distinct groups with PHN-cold clustered close to the healthy controls (Fig. 3B). The statistical studies comparing to healthy controls presented a different IEP, in which IFN A4 and IFN A10 produced significant decrease in PHN-cold cohort, with no change in PHN-Hot cohort. IFN A1/13, A2, A4b, A5, A6, A7, and A8 increased significantly in PHN-Hot group with no change in PHN-Cold cohort (Fig. 3C). This finding suggested that IEP established in the previous cases may be confounded in this cohort due to miscellaneous diagnoses.
FIG. 3.
IEP analyses of PHN patients with complex diagnoses (Cohort C). These patients with quite complex diagnoses were subjected to the analyses. (A) Heatmap individual analysis suggested two subgroups in the Cohort C, identified as PHN-cold and PHN-hot. (B) PCA supported the observation of heatmap analyses, showing three distinct groups with PHN-cold clustered similar to the HC. (C) Statistical analyses comparing to HC showed that IFN A1/13, A2, A4b, A5, A6, A7, and A8 demonstrated a significant increase in PHN-hot group (labeled ^p < 0.05), but no change in PHN-cold cohort. IFN A4 and IFN A10 exhibited significant decrease in PHN-cold cohort (labeled #p < 0.05). PHN-hot cohort, nonetheless, showed no change. PCA, principal component analyses.
Comparison of IEP among HZ (Cohort B) to PHN patients (Cohort D)
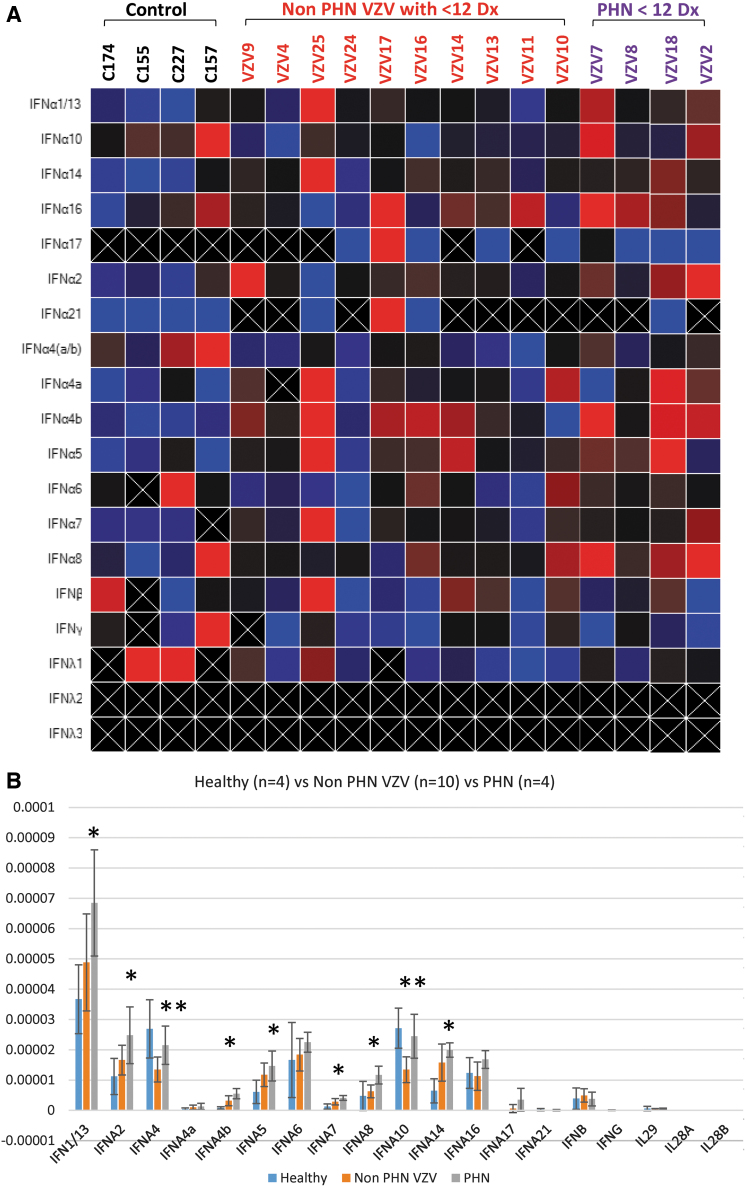
In our database, we have identified four patients who developed PHN after HZ with less than 13 diagnoses (Cohort D). The preliminary heatmap analyses did not reveal any substantial difference although the PHN samples displayed a “hotter” profile in comparison to the HZ samples (Fig. 4A). The ANOVA indicated that three more IFNs (IFN A1/13, A2, and A8) were added to the list of IFNs (IFN A4, A4b, IFN A5, IFN A7, A10, and IFN A14), which had significant changes comparing to the controls (Fig. 4B). Together it appeared that PHN patients exhibited a distinct IEP in comparison to controls and the HZ individuals. Of all the IFNs, nine were suggested to be “critical” exhibiting statistical differences among these cohorts.
FIG. 4.
IEP analyses of non-PHN HZ patients in comparison to PHN patients. Four patients in Cohort D possessed PHN diagnosis were compared to Cohort C, in which patients complained HZ without PHN. (A) Heatmap individual analysis. (B) Statistical analyses indicated that two additional IFNs, IFN A1/13 and IFN A2, showed significant increase as well as IFN A4b, A5, A7, and A14 (labeled as *p < 0.05). Moreover, the downregulated IFN A4 and IFN A10 in HZ cases comparing to HC did not occur in PHN patients but demonstrated a significant increase in comparison to HZ patients (labeled as **p < 0.05).
Interpreting complex IEP among controls, HZ, and PHN patients by dimensionality reduction
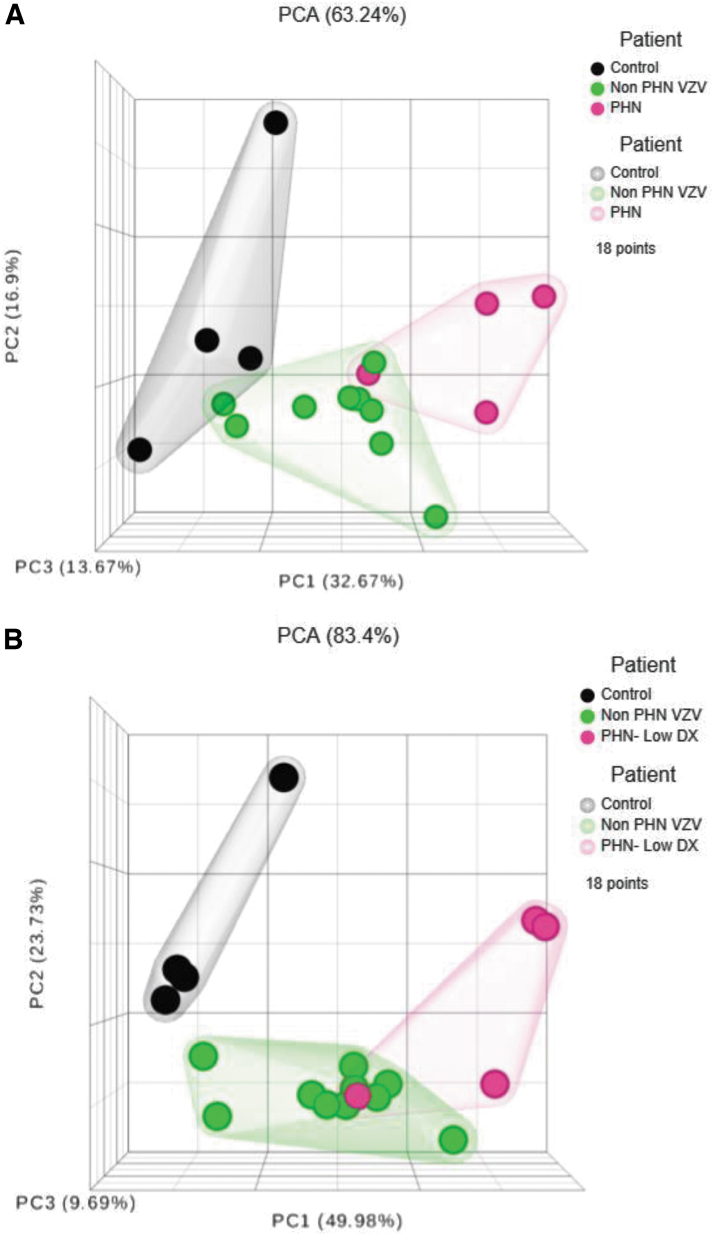
To transform our complex set of variables to a succinct one for interpretation, we use PCA to reduce the number of variables while preserves most of the original information. Our three-dimensional hierarchical clustering analyses, upon analyzing all 19 IFNs, depicted a differential expression pattern displaying a considerable degree of separation (Fig. 5A). The percentage of explained variance, which is the sum of the first three principal component (PC) percentages, was calculated to be 63.24%. If nine “critical” IFNs (IFNA1/13, A2, A4, IFNA4b, A5, A7, A8, A10, and A14) were selected for PCA, the clustergram demonstrated an expression pattern with better distinction among the cohorts and the percentage of explained variance is improved to 83.4% (Fig. 5B).
FIG. 5.
Summary of IEP between non-PHN and PHN patients in comparison to HC by PCA. (A) The three-dimensional hierarchical clustering analyses of all 19 IFNs by PCA described a differential expression pattern displaying a considerable degree of separation. (B) If only consider the nine “critical” IFNs (IFNA1/13, A2, A4, IFNA4b, A5, A7, A8, A10, and A14), the PCA clustergram depicted a pattern with better distinction among the cohorts.
Discussion
The overarching goal of this whole project is to provide a deeper understanding of the distinct IFN subtype IEPs in different patient populations and highlight how differences can affect biological response to disease (10). At the present, we focus on establishing the IFN IEPs in patients of HZ and PHN as a molecular diagnostic biomarker. The success will facilitate the identification of additional infectious disease-specific IFN IEPs.
Our results reveal a baseline HZ IEP exhibited by patients with HZ diagnostic records without PHN records and without other recorded comorbidities (Cohort A) compared to control specimens (Fig. 1A). Cohort A; IFN A4b, IFN A5, IFN A7, and IFN A14 were significantly increased compared to the controls (Cohort E), whereas the IFN A10 was reduced significantly (Fig. 1B). Cohort B, patients with HZ records, without PHN records, but with moderate comorbidities, when compared to healthy Cohort E, exhibited similar IEP observed in Cohort A, but with a decrease in IFNA4 compared with controls (Fig. 2B). Cohort C, patients with HZ, without PHN and with numerous comorbidities, exhibit IEP with only increased IFN A4b and IFN A7 (Fig. 3B). Finally, the PHN cohort uniquely exhibited increased IFN A1/13 and IFN A2 expression compared to controls and increased IFN4 and IFN10 when compared to HZ cohorts (Fig. 4B). These increases in IFN A1/13, IFN A2, IFN4, and IFN10 reveal a unique IEP to PHN patients that could be leveraged in the development of advanced diagnostics and companion diagnostics for determining PHN therapy efficacy and dosing. PHN therapeutics such as gabapentin and pregabalin have been reported to modulate IFNs and inflammatory signaling pathways, which suggests that IEP analysis might reveal PHN patient cohorts with increased IFN expressions that would be relieved by such therapies (1,11,17).
Interestingly, viral infection of PBMCs with herpes simplex virus, Newcastle disease virus, and respiratory syncytial virus induce differential IEP all with high production of IFN A1 (15). This subtype of IFN-α is classified as the weakest ISG inducer with the lowest antiviral activity in vitro against influenza A virus and HCV (7). While IFN A2 is considered to be an intermediate-strong inducer of ISG with strong antiviral effects (7), IFN A1, IFN A2, and A8 subtype expression occurs early postinfection with Sendai virus in vitro, regardless of the viral multiplicity of infection and may deliver a “priming” signal to neighboring cells (26). Suggesting that PHN might be a result of low or nonreplicating VZV infection remittance and support the hypothesis that distinct IEP corresponding to discrete disease states might be useful diagnostic and prognostic tools.
There are a few limitations of this study. The current sample size is quite small for all cohorts and the signatures could be masked by racial, genetic, gender, age, environmental, and comorbidity disease states. The solution is to design a future study with increased patient samples with thorough demographic data. This study intends to develop a strategy for novel diagnostic protocols in combination with biostatistics. The combined power of using IFN transcripts and biostatistics to develop disease biomarker profiles will result in several paradigm shifts in public health. The early and rapid detection of systemic diseases will decrease the interval between admission and the correct therapy, decrease the misuse of the inefficient therapies, and decrease some of the financial burdens of health care. Finally, major improvements in pharmacotherapy will be observed as pharmacists expand their clinical roles ushering a new era of personalized point of care medicine. Bedside analysis of IFN responses to therapies will be used to evaluate the efficacy of the therapy and its prescribed dose. Providers will be able to analyze the data and determine the individual patient response to therapy and whether the therapeutic changes are necessary.
Acknowledgment
We are grateful to the support from the University of Maryland Eastern Shore, Maryland Industrial Partnerships (MIPS) Award no.: 6310, and the IES Life Sciences, Inc.
Author Disclosure Statement
No competing financial interests exist.
Funding Information
Maryland Industrial Partnerships (MIPS) Award: 6310.
References
- 1. Abu-rish EY, Mansour AT, Mansour HT, Dahabiyeh LA, Aleidi SM, and Bustanji Y. Pregabalin inhibits in vivo and in vitro cytokine secretion and attenuates spleen inflammation in lipopolysaccharide/concanavalin A-induced murine models of inflammation. Sci Rep 2020;10:4007. [DOI] [PMC free article] [PubMed] [Google Scholar]
- 2. Antonelli G, Scagnolari C, Moschella F, and Proietti E. Twenty-five years of type I interferon-based treatment: a critical analysis of its therapeutic use. Cytokine Growth Factor Rev 2015;26:121–131. [DOI] [PMC free article] [PubMed] [Google Scholar]
- 3. Capobianchi MR, Uleri E, Caglioti C, and Dolei A. Type I IFN family members: similarity, differences and interaction. Cytokine Growth Factor Rev 2015;26:103–111. [DOI] [PMC free article] [PubMed] [Google Scholar]
- 4. Cohen KR, Salbu RL, Frank J, and Israel I. Presentation and management of herpes zoster (shingles) in the geriatric population. P T 2013;38:217–227. [PMC free article] [PubMed] [Google Scholar]
- 5. Feng X, Huang J, Liu Y, et al. Identification of interferon-inducible genes as diagnostic biomarker for systemic lupus erythematosus. Clin Rheumatol 2015;34:71–79. [DOI] [PubMed] [Google Scholar]
- 6. Figliozzi RW, Chen F, Balish M, Ajavon A, and Hsia SV. Thyroid hormone-dependent epigenetic suppression of herpes simplex virus-1 gene expression and viral replication in differentiated neuroendocrine cells. J Neurol Sci 2014;346:164–173. [DOI] [PMC free article] [PubMed] [Google Scholar]
- 7. George J, and Mattapallil JJ. Interferon-α subtypes as an adjunct therapeutic approach for human immunodeficiency virus functional cure. Front Immunol 2018;9:299. [DOI] [PMC free article] [PubMed] [Google Scholar]
- 8. Gershon AA, LaRussa P, and Steinberg S. The varicella vaccine. Clinical trials in immunocompromised individuals. Infect Dis Clin North Am 1996;10:583–594. [DOI] [PubMed] [Google Scholar]
- 9. Gruver C, and Guthmiller KB. Postherpetic Neuralgia. Treasure Island, FL: StatPearls, 2020. [PubMed] [Google Scholar]
- 10. Hillyer P, Mane VP, Schramm LM, et al. Expression profiles of human interferon-alpha and interferon-lambda subtypes are ligand- and cell-dependent. Immunol Cell Biol 2012;90:774–783. [DOI] [PMC free article] [PubMed] [Google Scholar]
- 11. Johnson RW, and Rice AS. Clinical practice. Postherpetic neuralgia. N Engl J Med 2014;371:1526–1533. [DOI] [PubMed] [Google Scholar]
- 12. Kim JY, Park GH, Kim MJ, et al. Usefulness of inflammatory markers for the prediction of postherpetic neuralgia in patients with acute herpes zoster. Ann Dermatol 2018;30:158–163. [DOI] [PMC free article] [PubMed] [Google Scholar]
- 13. Le Page C, Genin P, Baines MG, and Hiscott J. Interferon activation and innate immunity. Rev Immunogenet 2000;2:374–386. [PubMed] [Google Scholar]
- 14. Levy DE, Marie IJ, and Durbin JE. Induction and function of type I and III interferon in response to viral infection. Curr Opin Virol 2011;1:476–486. [DOI] [PMC free article] [PubMed] [Google Scholar]
- 15. Löseke S, Grage-Griebenow E, Wagner A, Gehlhar K, and Bufe A. Differential expression of IFN-alpha subtypes in human PBMC: evaluation of novel real-time PCR assays. J Immunol Methods 2003;276:207–222. [DOI] [PubMed] [Google Scholar]
- 16. Liu J, Gu L, Huang Q, et al. Altered gray matter volume in patients with herpes zoster and postherpetic neuralgia. J Pain Res 2019;12:605–616. [DOI] [PMC free article] [PubMed] [Google Scholar]
- 17. Mallick-Searle T, Snodgrass B, and Brant JM. Postherpetic neuralgia: epidemiology, pathophysiology, and pain management pharmacology. J Multidiscip Healthc 2016;9:447–454. [DOI] [PMC free article] [PubMed] [Google Scholar]
- 18. McNab F, Mayer-Barber K, Sher A, Wack A, and O'Garra A. Type I interferons in infectious disease. Nat Rev Immunol 2015;15:87–103. [DOI] [PMC free article] [PubMed] [Google Scholar]
- 19. Moll HP, Maier T, Zommer A, Lavoie T, and Brostjan C. The differential activity of interferon-α subtypes is consistent among distinct target genes and cell types. Cytokine 2011;53:52–59. [DOI] [PMC free article] [PubMed] [Google Scholar]
- 20. Ng CT, Mendoza JL, Garcia KC, and Oldstone MB. Alpha and beta type 1 interferon signaling: passage for diverse biologic outcomes. Cell 2016;164:349–352. [DOI] [PMC free article] [PubMed] [Google Scholar]
- 21. Pestka S, Krause CD, and Walter MR. Interferons, interferon-like cytokines, and their receptors. Immunol Rev 2004;202:8–32. [DOI] [PubMed] [Google Scholar]
- 22. Putri Mellaratna W, Jusuf NK, and Yosi A. The impact of pain intensity on quality of life of postherpetic neuralgia patients. Med Glas (Zenica) 2020;17:439–444. [DOI] [PubMed] [Google Scholar]
- 23. Saguil A, Kane S, Mercado M, and Lauters R. Herpes zoster and postherpetic neuralgia: prevention and management. Am Fam Physician 2017;96:656–663. [PubMed] [Google Scholar]
- 24. Singh VK. Plasma increase of interleukin-12 and interferon-gamma. Pathological significance in autism. J Neuroimmunol 1996;66:143–145. [DOI] [PubMed] [Google Scholar]
- 25. Xiao C-X, Xiao J-J, Xu H-Z, et al. Exome sequencing identifies novel compound heterozygous IFNA4 and IFNA10 mutations as a cause of impaired function in Crohn's disease patients. Sci Rep 2015;5:10514. [DOI] [PMC free article] [PubMed] [Google Scholar]
- 26. Zaritsky LA, Bedsaul JR, and Zoon KC. Virus multiplicity of infection affects type I interferon subtype induction profiles and interferon-stimulated genes. J Virol 2015;89:11534–11548. [DOI] [PMC free article] [PubMed] [Google Scholar]


