Abstract
Regulation of endothelial nitric oxide synthase (eNOS) in hepatocytes may be an important target in nonalcoholic fatty liver disease (NAFLD) development and progression to nonalcoholic steatohepatitis (NASH). In this study, we show genetic deletion and viral knockdown of hepatocyte-specific eNOS exacerbated hepatic steatosis and inflammation, decreased hepatic mitochondrial fatty acid oxidation and respiration, increased mitochondrial H2O2 emission, and impaired the hepatic mitophagic (BNIP3 and LC3II) response. Conversely, overexpressing eNOS in hepatocytes in vitro and in vivo increased hepatocyte mitochondrial respiration and attenuated Western diet–induced NASH. Moreover, patients with elevated NAFLD activity score (histology score of worsening steatosis, hepatocyte ballooning, and inflammation) exhibited reduced hepatic eNOS expression, which correlated with reduced hepatic mitochondrial fatty acid oxidation and lower hepatic protein expression of mitophagy protein BNIP3. The current study reveals an important molecular role for hepatocyte-specific eNOS as a key regulator of NAFLD/NASH susceptibility and mitochondrial quality control with direct clinical correlation to patients with NASH.
Introduction
Nonalcoholic fatty liver disease (NAFLD) and its progression to nonalcoholic steatohepatitis (NASH) is the most rapidly increasing indication for liver transplantation in the U.S. (1). NAFLD is considered an independent risk factor for cardiovascular, liver-related, and all-cause mortality (2,3). A hallmark of NAFLD progression is the decline in function of hepatic mitochondria, including increased reactive oxygen species (ROS) and decreased oxidative capacity (4–7). However, the precise mechanisms of hepatic mitochondrial dysfunction during NAFLD development and progression to NASH remain unresolved.
Endothelial nitric oxide synthase (eNOS) represents one potential mediator of maintaining mitochondrial function in the liver, given its well-established role in regulating mitochondrial biogenesis in other tissues (8–11). Our group has shown that whole-liver eNOS activity is reduced in models of NAFLD and NASH (12), and whole-body eNOS null mice display exacerbated NASH (13). In addition, pharmacological NOS inhibition causes hepatic mitochondrial dysfunction and NAFLD development (14). Despite these observations with whole-liver eNOS changes and findings in whole-body eNOS knockout (KO) mice, a specific in vivo role for eNOS in hepatocytes in NAFLD and NASH is unknown.
In this study, we generated a novel hepatocyte-specific eNOS KO mouse model to elucidate the role of eNOS in hepatocytes on NAFLD/NASH. We reveal that hepatocyte-specific eNOS is required for adequate hepatic mitochondrial function and turnover, eNOS deletion exacerbates NAFLD and NASH, and eNOS overexpression partially rescues Western diet (WD)–induced NASH. This is coupled with clinical data highlighting that reduced hepatic eNOS expression is seen in patients with increasing NAFLD activity score (NAS) and correlated with reduced hepatic mitochondrial fatty acid oxidation and reduced mitophagy protein BNIP3.
Research Design and Methods
Animal Models
Hepatocyte-specific eNOS KO (eNOShep−/−) mice were generated by crossing homozygous eNOS-floxed (eNOSfl/fl) mice on a C57BL/6J background (15), with Albumin-Cre recombinase transgenic mice (002684; The Jackson Laboratory, Bar Harbor, ME). All animal protocols were approved by the University of Missouri and Harry S. Truman Memorial Veterans’ Hospital Animal Care and Use Committees. At 10 weeks of age, male and female eNOSfl/fl and eNOShep−/− mice received either a semipurified control diet (CD; 10% kcal fat) (D12110704; Research Diets, New Brunswick, NJ) or a WD high-fat (45%), high-sucrose diet with cholesterol (D09071604; Research Diets) for 16 weeks. This resulted in a total of four groups (n = 13–17/group): CD-eNOSfl/fl, WD-eNOSfl/fl, CD-eNOShep−/−, and WD-eNOShep−/−.
Adeno-Associated Viral Knockdown of Hepatocellular eNOS
Adeno-associated viral (AAV)–shRNA and AAV-Cre viruses were purchased from Vector Biolabs (Malvern, PA) and University of Pennsylvania (Philadelphia, PA), respectively. The AAV-Cre was designed with the hepatocyte-specific thyroid hormone-binding globulin (TBG) promoter, and the AAV-shRNA was designed with the hepatocyte-specific transthyretin (TTR) promoter. Male eNOSfl/fl mice were administered with an AAV8-TBG-Cre virus (1 × 10¹² gene copies [GC]/mL; lot number CS1294) and fed a CD for 6 weeks versus AAV-TBG-Scr control (1 × 10¹² GC/mL; lot number CS1325L).
Wild-type (WT) C57BL/6J mice were injected with either an AAV8-TTR-GFP-mNOS3-shRNA (1 × 10¹¹ GC/mL; lot number 2015–1130) or an AAV8-TTR-GFP-Scr-shRNA (1 × 10¹¹ GC/mL; lot number 2016–0808) to serve as control. Mice were then fed a WD for 2 weeks before mitophagic flux testing via i.p. leupeptin injections, a lysosomal inhibitor, as described previously (16). Briefly, mice were i.p. injected with either 40 mg/kg leupeptin (#9783; Sigma-Aldrich, St. Louis, MO) or an equal volume of saline 18 h prior to euthanasia. Mice then had their food pulled 12 h prior to the terminal experiment the following morning. At 4 h prior to euthanasia, an additional 20 mg/kg of leupeptin or equal volume of saline was administered via i.p. injection. Accumulation of key proteins involved in autophogasome assembly and its docking to the mitochondria—LC3-II, p62, and BNIP3—were measured to give an indication of mitophagic flux.
Adenoviral and AAV Overexpression of Hepatocellular eNOS
Primary hepatocytes were isolated from female eNOSfl/fl mice (20–22 weeks of age) and transfected with either adenoviral (Adv) β-galactosidase (β-Gal) control or Adv eNOS overexpression: 1 × 10⁴ PFU/mL, 1 × 10⁵ PFU/mL, and 1 × 10⁶ PFU/mL (lot number 20170516T#2; Vector Biolabs). For short-term in vivo overexpression studies, 10-week-old C57BL/6J mice on a CD were injected with either an AAV8-TTR-eNOS overexpression virus (1 × 10¹¹ GC/mL; lot number 170605#16) or AAV8-TTR-GFP (1 × 10¹¹ GC/mL; lot number 161219–170614) to serve as a control and maintained on CD for 6 weeks. For longer-term overexpression studies, after 20 weeks on either CD or WD, C57BL/6J mice were injected with either an AAV8-TTR-eNOS or AAV8-TTR-GFP scramble control (as described above) and maintained on their diets for an additional 10 weeks. This resulted in a total of four groups (n = 10/group): AAV-GFP-CD, AAV-eNOS OE-CD, AAV-GFP-WD, and AAV-eNOS OE-WD.
Nitric Oxide Donor Studies
Male eNOShep−/− mice (18–23 weeks old) on a CD were i.p. injected twice daily with 5 mg/kg of the liver-specific nitric oxide (NO) donor V-PYRRO/NO (number 179344-98-0; Cayman Chemical, Ann Arbor, MI) or saline for 3 weeks, as described previously (17–19). Mice were fasted overnight, and the last injection was given 2 h prior to sacrifice.
Primary hepatocytes were isolated from female eNOSfl/fl mice (20–22 weeks of age), and cells were left untreated or administered an NO donor (DETA NONOate; 50 μmol/L or 100 μmol/L) before functional outcomes were performed as described below.
Hepatic Insulin Signaling
For acute in vivo insulin stimulation studies in eNOSfl/fl and eNOShep−/− male mice (20–22 weeks of age), food was removed 5 h prior to either i.p. saline or insulin (Humulin; 2.5 units/kg) injections, as described previously (20). Tissues were harvested under anesthesia 20 min postinjection.
Primary Hepatocyte Experiments
Primary hepatocytes were isolated from CD-fed WT and eNOSfl/fl and eNOShep−/− female mice (20–22 weeks of age) using a two-step collagenase method as described previously (13,21,22). Magnetic-activated cell sorting was used as described in detail previously by our group (13) and originally modified from Azimifar et al. (23). A total of 108 cells were pelleted at 300g for 10 min at 4°C and treated with CD146, CD11b, CD146, and CD11c microbeads (Miltenyi Biotec, Auburn, CA) for the removal of endothelial cells, Kupffer cells, and macrophages. Immunofluorescence was performed on a subset of magnetic-activated cell sorting–purified primary hepatocytes for confirmation of the removal of Cd11b+, CD146+, CD31+, and Cd11c+ cells and lack of eNOS in hepatocytes from eNOShep−/− mice. Exclusion of the primary antibody was used as negative control. For confirmation of the removal of Cd11b+, CD146+, CD31+, and Cd11c+ cells, back-end immunofluorescence for these proteins was used in purified hepatocytes. Cellular oxygen consumption in primary hepatocytes was assessed using a Seahorse XF24 analyzer (Agilent Technologies, Santa Clara, CA), as described previously with slight modifications (24).
NO Production
A nitrate/nitrite fluorometric assay kit (#780051; Cayman Chemical) was used as a surrogate marker of NO oxidation as performed previously (25).
Enzymatic Assays
β-Hydroxyacyl-CoA dehydrogenase and citrate synthase activity were assessed in whole-liver homogenate as previously described (26).
Liver Histology
The fresh liver was placed in 10% formalin for 24 h and then imbedded in paraffin, sectioned, and stained with hematoxylin-eosin (H&E) or trichrome (to assess fibrosis) by IDEXX BioAnalytics (Columbia, MO) for mouse histology or Boyce & Bynum Pathology Professional Services (Columbia, MO) for human samples. NAS (27) and fibrosis staging of liver sections were conducted by a trained and blinded observer.
Gene and Protein Quantification
Western blot analyses were completed in whole-liver homogenate, isolated hepatic mitochondria, and hepatocyte lysates. Total protein was assessed with Amido black (0.1%; Sigma-Aldrich) to control for differences in protein loading and transfer as previously described (26,28). Blots in primary hepatocytes were normalized to β-actin. A list of primary antibodies is included in the Supplementary Materials. Quantitative real-time PCR was conducted using SYBR Green reagents (Bio-Rad Laboratories) or TaqMan (Bio-Rad Laboratories) and primer pairs (Sigma-Aldrich) listed in Supplementary Table 1. PCR product melt curves were used to assess primer specificity. Data are represented relative to cyclophilin B (Ppib) using the 2−ΔΔCT method.
Hepatic Mitochondrial Function and H2O2 Emission
Hepatic mitochondria were isolated as described (13,26,29,30). Hepatic mitochondrial respiration and H2O2 production were assessed using high-resolution respirometry (Oroboros Oxygraph-2k; Oroboros Instruments, Innsbruck, Austria) with the addition of Amplex UltraRed reagent (for H2O2) (#A36006; Thermo Fisher Scientific) with substrates as described (13,26,29,31). Hepatic fatty acid oxidation capacity was determined by 1-14C palmitate oxidation to 14CO2 (a measure of complete oxidation) and 1-14C containing acid-soluble metabolites (a measure of incomplete oxidation) (26,29,30,32).
Transmission Electron Microscopy
Mitochondrial ultrastructural changes were assessed via transmission electron microscopy (TEM) from a small section of fresh liver (∼1–2 mg) immediately fixed in 2% paraformaldehyde and 2% glutaraldehyde in 100 mmol/L sodium cacodylate buffer, pH 7.35, and processed by the Electron Microscopy Core Facility at the University of Missouri.
Human Samples
Liver samples were obtained from adults with clinical obesity undergoing elective bariatric surgery at the University of Missouri Hospital (Columbia, MO). Before inclusion, all participants gave written informed consent to the protocol, which was approved by the institutional review board of the University of Missouri (protocol number 2008258) and conducted according to the World Medical Association’s Declaration of Helsinki. Liver wedge biopsies were processed for H&E and trichrome staining, isolated mitochondrial fatty acid oxidation, and Western blotting, as described above. Degree of NAFLD severity was determined using the NAS (27) by a blinded hematopathologist. Participants were clustered into three groups based on NAS: no disease (NAS = 0; n = 7), moderate (NAS = 1–3, n = 45), and severe (NAS = 4–6; n = 38). Characteristics of patients broken down by NAS groupings can be found in Supplementary Table 2. NAS inclusion criteria for patients with NAFLD were based on an alcohol intake <20 g/day and histologically confirmed steatosis with/without necroinflammation and/or fibrosis. Other causes of liver disease were excluded based on history, laboratory data, and histological features.
Statistical Analysis
Statistical analyses were completed in SPSS (SPSS Statistics for Windows, Version 24.0.; IBM Corporation, Armonk, NY) with an α level of P < 0.05. For the human data, a one-way ANOVA and Pearson correlation were used. In vivo animal studies were analyzed via two-way (2 × 2) ANOVA, with a Fisher least significant difference post hoc test used when a significant interaction term was detected. For in vitro studies, data were analyzed with either two-way or one-way ANOVA with or without repeated measures or paired t test as appropriate. Data were graphed using GraphPad Prism 8.1. All data are presented as means ± SD.
Data and Resource Availability
The data sets generated during and/or analyzed during the current study are available from the corresponding author upon reasonable request.
Results
Generation of Hepatocyte-Specific eNOS KO Model
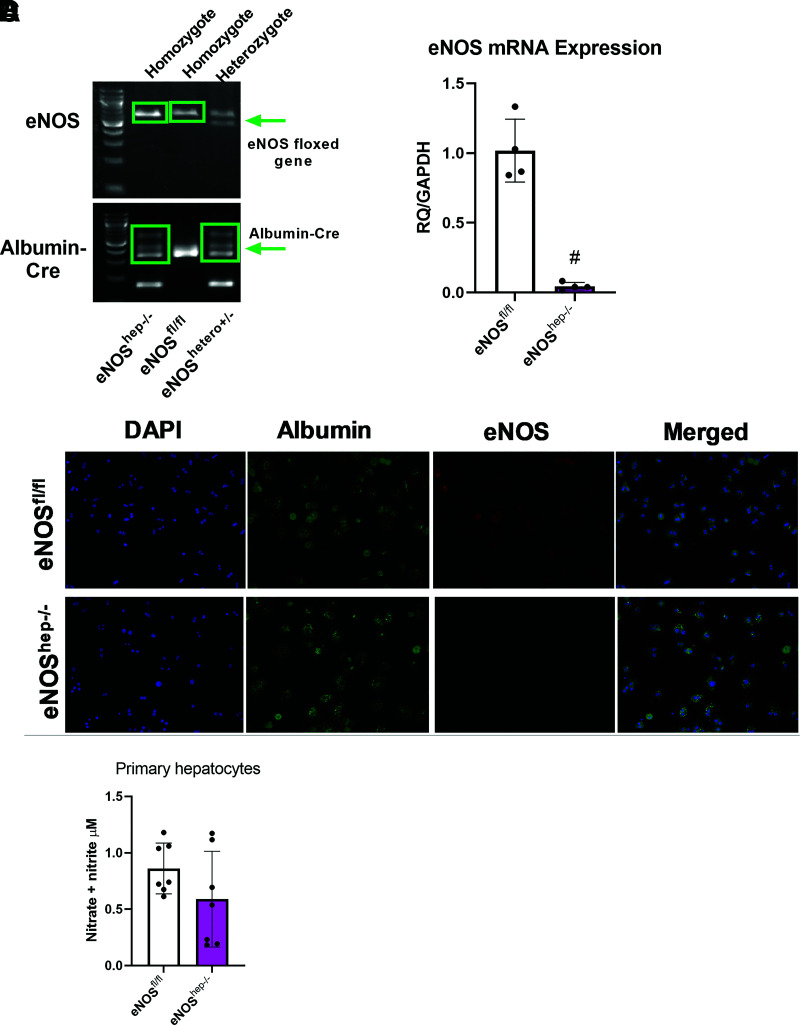
In this study, we show the eNOS gene that is floxed in both our eNOSfl/fl and eNOShep−/− mice, along with the presence of the Albumin-Cre in our eNOShep−/− mice only (Fig. 1A) (eNOShep+/− mice are shown to demonstrate the cross, but these animals were not used in any experiments). Gene expression from isolated primary hepatocytes demonstrates the ablation of eNOS in eNOShep−/− versus eNOSfl/fl mice (Fig. 1B). No difference was found between eNOSfl/fl and eNOShep−/− hepatocytes for inducible NOS or neuronal NOS mRNA expression (data not shown). Further, eNOS protein content in other tissues was not affected by genotype (Supplementary Fig. 9B). For further confirmation, fluorescence microscopy of isolated primary hepatocytes demonstrates the deletion of hepatocellular eNOS in eNOShep−/− versus eNOSfl/fl mice (Fig. 1C). Isolated hepatocytes from eNOShep−/− versus eNOSfl/fl mice also tended to show a slight reduction in nitrate and nitrite concentration (P = 0.16), a surrogate marker for NO production (Fig. 1D).
Figure 1.
Confirmation of the deletion of hepatocellular eNOS in primary hepatocytes collected from both eNOSfl/fl and eNOShep−/− mice on a CD. A: Genotyping images displaying the floxed eNOS gene and the presence of the Albumin-Cre in our eNOSfl/fl and eNOShep−/− murine line. B: mRNA expression of eNOS from isolated primary hepatocytes (n = 4/group). C: Fluorescence microscopy of isolated primary hepatocytes, confirming the deletion of hepatocellular eNOS. Nuclei were stained with DAPI (blue), hepatocytes stained with albumin (green), and eNOS stained by anti-eNOS antibody (red) (n = 4–5/genotype). D: Nitrate and nitrite concentration in supernatant from isolated primary hepatocytes (P = 0.16; n = 6–8). Data are presented as mean ± SD. #Significantly different from eNOSfl/fl (P < 0.05). RQ, relative quotient.
Serum and Anthropometric Characteristics
eNOShep−/− mice developed normally, with no differences in body weight, body fat percentage, or liver weight versus eNOSfl/fl mice on CD or WD for 16 weeks (Supplementary Fig. 1A–C). In addition, WD feeding increased serum ALT and insulin and decreased serum triglycerides in eNOShep−/− and eNOSfl/fl mice, with only serum insulin being elevated in eNOShep−/− versus eNOSfl/fl mice on CD (P < 0.05) (Supplementary Fig. 1D). eNOShep−/− mice also displayed similar responses during glucose tolerance, insulin tolerance, and pyruvate tolerance testing compared with eNOSfl/fl mice (Supplementary Fig. 1E and F), except for elevated glucose response to pyruvate tolerance testing in eNOShep−/− mice on CD versus eNOSfl/fl mice (P < 0.05). Interestingly, eNOShep−/− mice also exhibited elevated markers of hepatic gluconeogenesis (g6pase and ppeck gene expression) compared with eNOSfl/fl mice, regardless of diet (data not shown).
Ablation of Hepatocyte eNOS Increases Histological Hepatic Steatosis and Inflammation
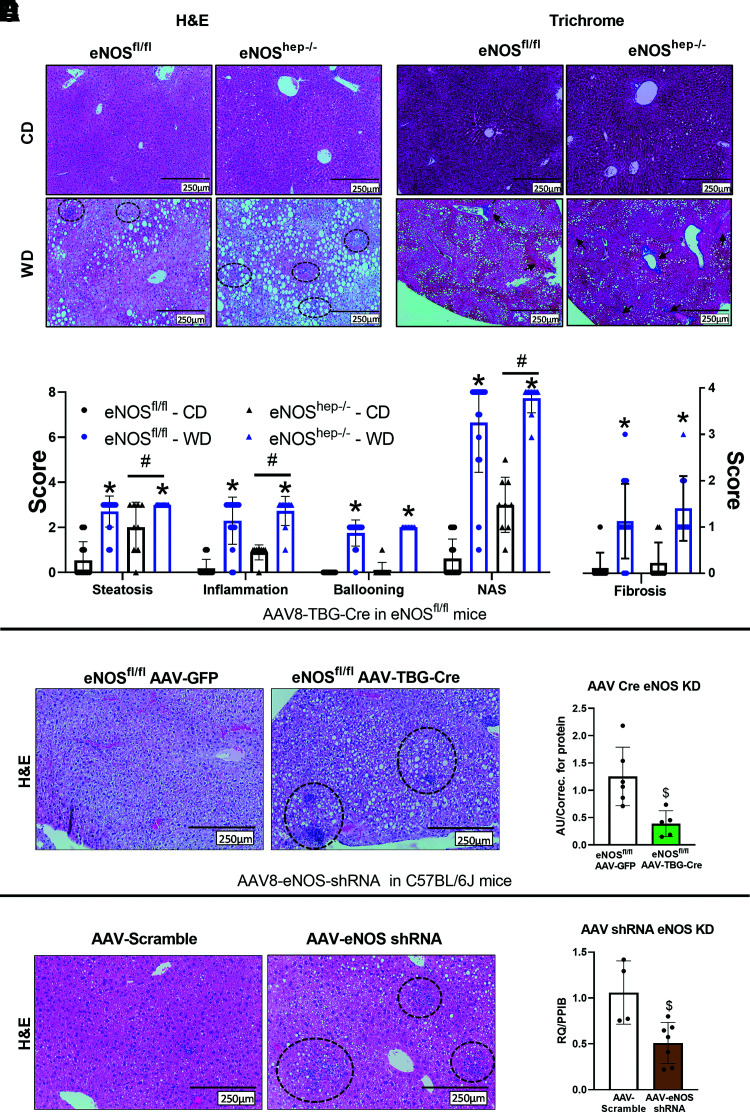
eNOShep−/− mice displayed elevated hepatic steatosis, inflammation, and NAS compared with eNOSfl/fl mice (Fig. 2A and B), with no genotype effect seen in hepatocellular ballooning or fibrosis on CD or WD. In addition, WD-induced upregulation in mRNA expression of markers of inflammation and fibrosis was not further exacerbated in eNOShep−/− mice (Supplementary Fig. 2). As further verification, nongermline deletion strategies with both AAV8-TBG-Cre injection induced knockdown of eNOS in eNOSfl/fl mice followed by 6 weeks of CD feeding (Fig. 2C and D) and AAV8-TTR-GFP-mNOS3-shRNA knockdown in C57BL/6J mice followed by 2 weeks of WD feeding (Fig. 2E and F) resulted in exacerbated histological hepatic steatosis and inflammation compared with scramble control conditions.
Figure 2.
Hepatocellular eNOS deficiency exacerbates histological hepatic steatosis and inflammation. From eNOSfl/fl and eNOShep−/− mice on either a CD or WD for 16 weeks. A: Representative liver H&E and trichrome staining. B: Histological and fibrosis scoring based on H&E and trichrome images (n = 10–17/group). Hepatocyte eNOS knockdown via AAV8-TGB-Cre injection in eNOSfl/fl animals at 10 weeks of age. C: Representative liver H&E staining after 6 weeks of CD feeding and (D) mRNA expression of eNOS in isolated primary hepatocytes (n = 3–5/group). AAV8-TTR-eNOS-shRNA knockdown of hepatocyte eNOS in C57BL/6J mice at 10 weeks of age. E: Representative liver H&E staining after 6 weeks of CD feeding and (F) mRNA expression of eNOS in isolated primary hepatocytes from shRNA eNOS knockdown mice (n = 2-3/group). Data are presented as mean ± SD. *Main effect of diet (P < 0.05 vs. CD). #Main effect of genotype (P < 0.05 vs. eNOSfl/fl). $Significantly different from GFP or AAV-scramble controls (P < 0.05). CD, control diet; H&E, hemotoxylin and eosin; KD, knockdown; NAS, NAFLD activity score; PPIB, cyclophilin B; RQ, relative quotient; WD, Western diet.
Deletion of Hepatocyte eNOS Reduced Hepatic Mitochondrial Function and Increased Mitochondrial Reactive Oxygen Species
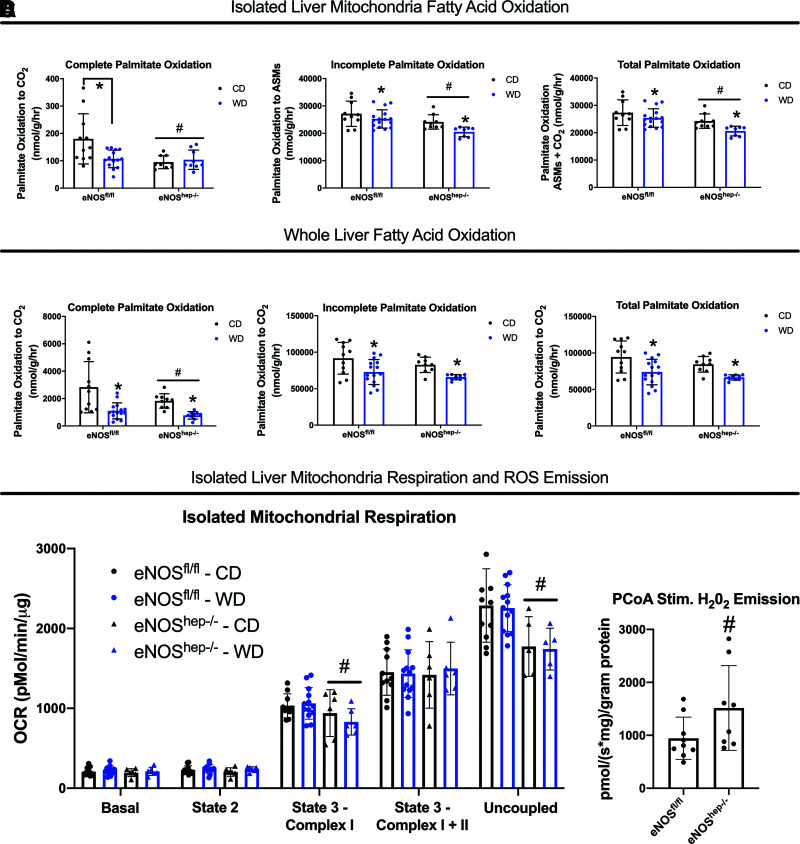
Hepatocyte-specific deletion of eNOS downregulated hepatic mitochondrial fatty acid oxidation (Fig. 3A) and complete 1-14C-palmitate oxidation to CO2 in whole-liver lysate in eNOShep−/− mice compared with eNOSfl/fl mice (Fig. 3B). Hepatocyte-specific eNOS deletion also reduced state 3-complex I and carbonyl cyanide-p-trifluoromethoxyphenylhydrazone–stimulated maximal uncoupled mitochondrial respiration versus eNOSfl/fl mice (Fig. 3C) and caused elevated hepatic mitochondrial ROS production (H2O2 emission) compared with eNOSfl/fl mice (Fig. 3D). Similar impairments in hepatic fatty acid oxidation and mitochondrial respiration were also seen in female eNOShep−/− versus eNOSfl/fl mice, indicating this phenomenon was not sex dependent (Supplementary Fig. 3). These reductions in hepatic mitochondrial function in eNOShep−/− mice did not appear to be explained by a reduction in hepatic mitochondrial content, as citrate synthase activity was modestly increased in eNOShep−/− mice (P < 0.05) and electron transport chain complexes did not differ between genotypes (Supplementary Fig. 4B and C).
Figure 3.
Hepatocellular eNOS deficiency reduces hepatic mitochondrial function. In eNOSfl/fl and eNOShep−/− mice on either a CD or WD for 16 weeks. A: Isolated liver mitochondria complete, incomplete, and total [1-14C] palmitate oxidation to CO2 (n = 13–17/group). B: Whole-liver complete, incomplete, and total [1-14C] palmitate oxidation to CO2 (n = 13–17/group). C: Oxygen consumption in isolated liver mitochondria (n = 6–10/group). D: PCoA stimulated H2O2 emission in isolated liver mitochondria from male and female (combined) eNOSfl/fl and eNOShep−/− fed a CD only (n = 7–9/group). Data are presented as mean ± SD. *Main effect of diet (P < 0.05 vs. CD). #Main effect of genotype (P < 0.05 vs. eNOSfl/fl). ASMs, acid-soluble metabolites; CD, control diet; OCR, oxygen consumption rate; PCoA, palmitoyl-CoA; WD, Western diet.
Ablation of Hepatocyte eNOS Alters Mitochondrial Ultrastructure and Impairs Mitophagic Flux
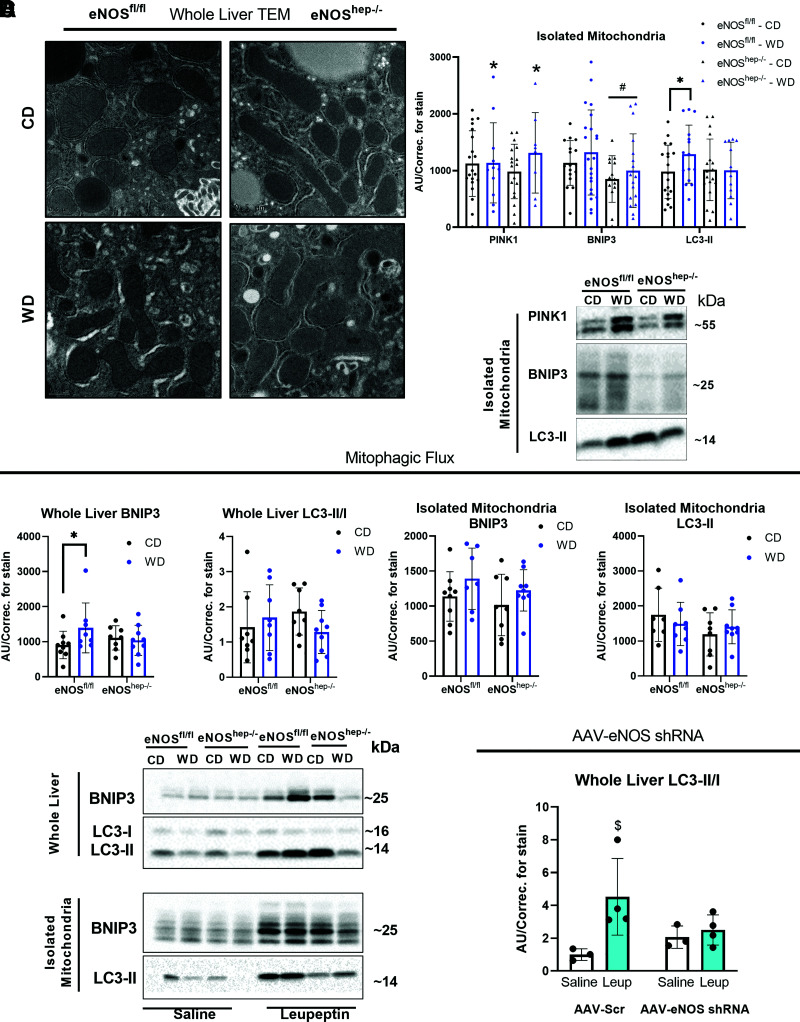
Mitochondrial morphology and ultrastructure were determined by TEM and revealed that mitochondria from eNOShep−/− mice were more elongated with disrupted cristae (Fig. 4A). Enlarged mitochondria may be indicative of impaired hepatic mitophagy (33). pDRP1s616/DRP1 tended to be reduced in eNOShep−/− mice (P = 0.16), with no change in markers of mitochondrial fusion (OPA1) (Supplementary Fig. 4D). Similarly, liver-specific DRP1 KO animals deficient in mitochondrial fission also present with enlarged mitochondrial morphology (33). Despite multiple observations of the requirement of eNOS and NO for the induction of markers of mitochondrial biogenesis (10,11,34), we saw no genotype effect on phospho-AMPK/AMPK, PGC1α, or TFAM in whole-liver homogenate (Supplementary Fig. 4D).
Figure 4.
Hepatocellular eNOS deficiency impairs mitochondrial morphology, quality, and turnover. In eNOSfl/fl and eNOShep−/− mice on either a CD or WD for 16 weeks. A: Representative TEM images of whole liver. B: Protein expression of markers of mitophagy in isolated liver mitochondria (n = 13–23/group) and their representative Western blot images. C: Protein expression of the accumulation of mitophagy proteins after in vivo leupeptin injections in eNOSfl/fl and eNOShep−/− mice on either a CD or WD for 16 weeks: whole-liver BNIP3 and LC3-II/I, and isolated liver mitochondria BNIP3 and LC3-II (n = 5–9/group), and their representative Western blot images. C57BL/6J mice were injected with AAV8-TTR-eNOS-shRNA to knockdown hepatocyte eNOS at 10 weeks of age and then fed a WD for 2 weeks. D: Protein expression of the accumulation of whole-liver LC3-II/I after in vivo leupeptin injection in AAV-scramble and AAV-eNOS-shRNA–injected animals after 2 weeks of WD feeding (n = 3–4/group). Data are presented as mean ± SD. *Effect of diet (P < 0.05 vs. CD). #Main effect of genotype (P < 0.05 vs. eNOSfl/fl). $Significantly different from saline (P < 0.05). AU/correc., arbitrary unit/correction; CD, control diet; TEM, transmission electron microscopy; WD, Western diet.
Assessing mitophagic capacity/flux, leupeptin-injected eNOShep−/− mice failed to mount WD-induced increase in BNIP3 accumulation, as seen in eNOSfl/fl mice in whole liver (Fig. 4C), and hepatic mitochondrial LC3-II accumulation tended to be reduced in eNOShep−/− mice versus eNOSfl/fl mice (P = 0.15) (Fig. 4C). Supporting this, in vivo AAV-shRNA knockdown of hepatocyte eNOS significantly blunted accumulation of hepatic mitochondrial LC3-II after leupeptin injections compared with AAV-scramble controls after 2 weeks of WD feeding (Fig. 4D). Regarding static markers of mitophagy, hepatic mitochondrial BNIP3 was significantly reduced in eNOShep−/− mice (Fig. 4B), and whole-liver pULK1/ULK1 was markedly reduced in eNOShep−/− mice (∼60%) compared with eNOSfl/fl mice (CD-fed only) (Supplementary Fig. 5).
Short-Term Hepatocyte-Specific eNOS Overexpression Increases Hepatocyte Respiration
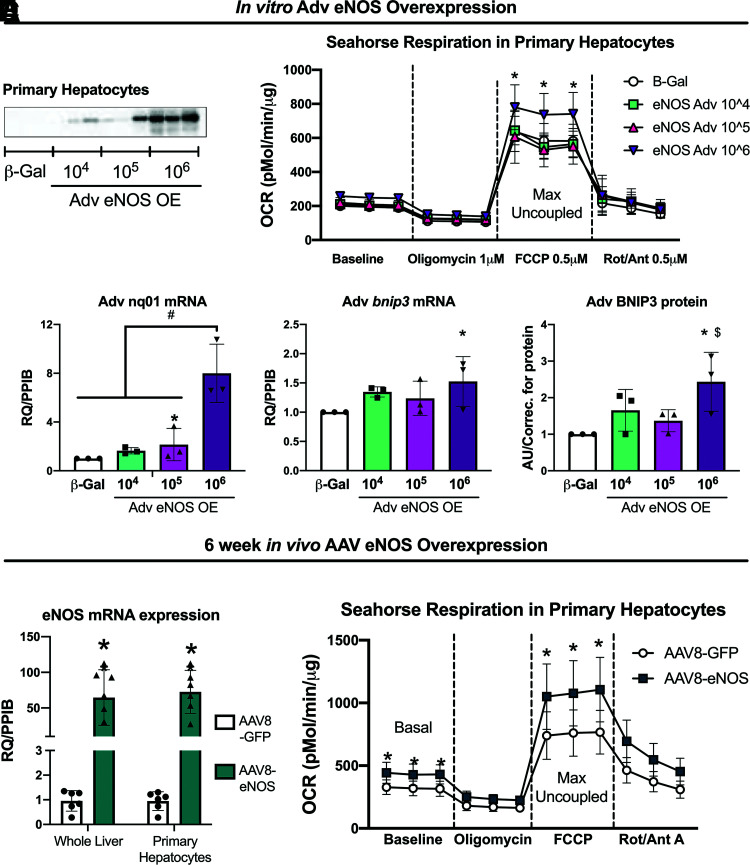
Protein expression of eNOS in isolated primary hepatocytes from eNOSfl/fl mice exposed to Adv β-Gal or varying viral loads of eNOS Adv (104–106 PFU/mL) confirmed successful overexpression of eNOS in hepatocytes (Fig. 5A). Adenoviral overexpression of eNOS also increased carbonyl cyanide-p-trifluoromethoxyphenylhydrazone–stimulated maximal uncoupled oxygen consumption in primary hepatocytes (Fig. 5B) and increased NQO1 mRNA expression, as well as increased BNIP3 protein and mRNA expression compared with β-Gal controls (Fig. 5C). Next, CD-fed 10-week-old male C57BL/6J mice were injected with either AAV8-TTR-eNOS (AAV-eNOS OE) or AAV8-TTR-GFP (AAV-GFP) control to determine the effects of in vivo hepatocyte-specific eNOS overexpression. Similar to in vitro eNOS overexpression, in vivo hepatocellular eNOS overexpression increased basal and maximal uncoupled respiration in isolated primary hepatocytes from AAV-eNOS OE animals (Fig. 5E).
Figure 5.
Hepatocellular eNOS overexpression increases primary hepatocyte respiration. Primary hepatocytes were isolated from female eNOSfl/fl mice (20–22 weeks of age) and transfected with either Adv β-Gal control or Adv eNOS overexpression. A: Representative Western blot image of Adv eNOS overexpression in primary hepatocytes. eNOS expression in cells exposed to Adv-β-Gal are underexposed due to the robust increases in eNOS expression in cells exposed to Adv-eNOS. B: Oxygen consumption rate (OCR) in isolated primary hepatocytes (n = 3). C: Gene expression and protein expression in isolated primary hepatocytes (n = 3). CD-fed 10-week-old male C57BL/6J mice were injected with either AAV8-TTR-eNOS or AAV8-TTR-GFP control. At 6 weeks post–AAV8-TTR-eNOS overexpression. D: eNOS gene expression in whole liver and isolated primary hepatocytes, and (E) oxygen consumption rate in isolated primary hepatocytes (n = 7–8/group). Data are presented as mean ± SD. *Significantly different from β-Gal and from AAV8-GFP; #Significantly different from β-Gal, 104, 105; $Significantly different from 105 (for all P < 0.05). AAV, adeno associated virus; Adv, adenoviral; AU, arbitrary units/correction; CD, control diet; FCCP, carbonyl cyanide-p-trifluoromethoxyphenylhy drazone; OE, overexpression; Rot/Ant, rotenone/antimycin; RQ/PPIB, relative quotient/cyclophilin B.
Long-Term Hepatocellular eNOS Overexpression Mitigates NASH
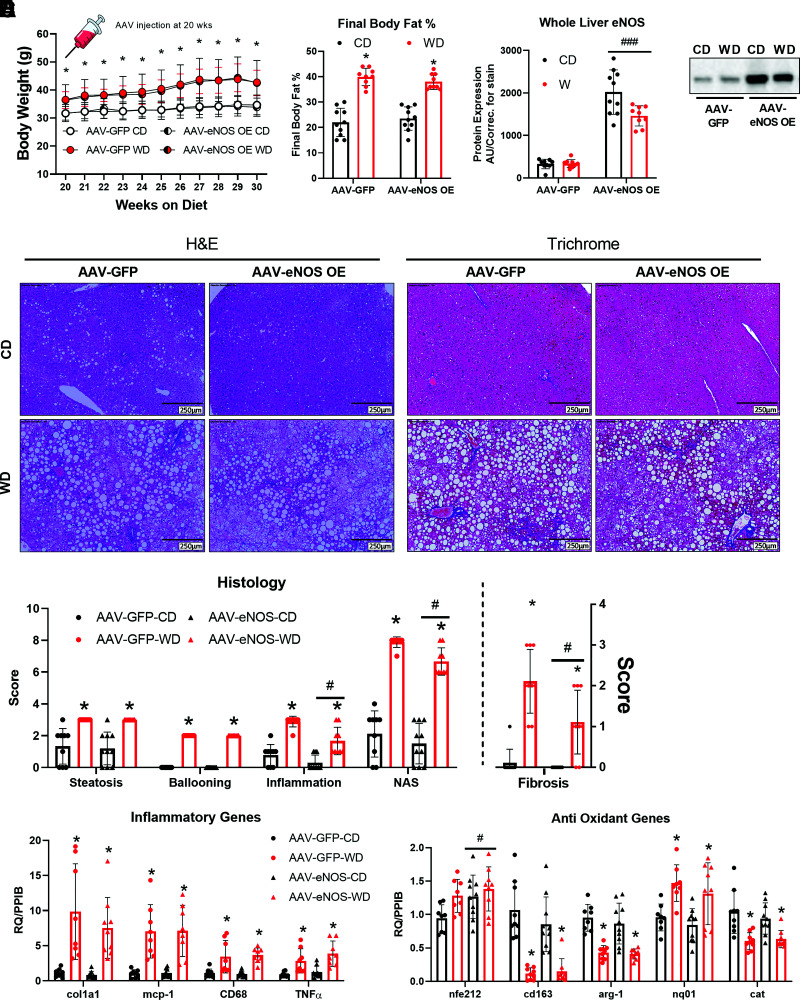
After either CD or WD feeding for 20 weeks, C57BL/6J mice were injected with the same eNOS overexpression AAV or control as used for short-term overexpression: AAV8-TTR-eNOS (AAV-eNOS OE) or AAV8-TTR-GFP (AAV-GFP). Animals were then maintained on their respective diets for an additional 10 weeks. Despite an expected WD effect, hepatocyte eNOS overexpression did not alter body weight or body fat percentage compared with AAV-GFP control mice (Fig. 6A and B). Importantly, eNOS protein content in other tissues was not affected by liver-specific eNOS overexpression (Supplementary Fig. 9B). Interestingly, WD feeding–induced increases in inflammation, NAS score, and fibrosis were attenuated in AAV-eNOS OE animals (Fig. 6D and E). This attenuation in hepatic inflammation and fibrosis was associated with elevations in NRF2 (nfe2l2) mRNA expression, a known master regulator of the antioxidant response and implicated in our previous studies as being regulated by eNOS (13). However, this was not accompanied by alterations in other gene expression markers of inflammation or collagen deposition (Fig. 6F). Long-term AAV-induced overexpression of eNOS did not alter whole-liver or isolated mitochondria fatty acid oxidation nor did it prevent WD-induced decreases in ETC protein complexes or BNIP3 and PGC1α hepatic protein content (Supplementary Fig. 6A, B, and D–F).
Figure 6.
Long-term hepatocellular eNOS overexpression attenuates WD-induced NASH. C57BL/6J mice were randomized to receive either a CD or WD for 20 weeks, then further randomized to receive either an AAV8-TTR-eNOS overexpression virus or AAV8-TTR-GFP at the 20-week mark, while the body weights were recorded until 30 weeks of age (n = 10/group). A: Body weight over time. B: Final body fat % (n = 10/group). C: Whole-liver protein expression of eNOS confirming the viral overexpression (n = 10/group), and the representative Western blot image. D: Representative liver H&E and trichrome staining from the indicated mice at 30 weeks of age. E: Histological and fibrosis scoring based on H&E and trichrome images (n = 8/group). F: mRNA expression of markers of hepatic inflammatory and antioxidant genes (n = 9–10/group). Data are presented as mean ± SD. *Main effect of diet (P < 0.05 vs. CD), #P < 0.05, and ###P < 0.001, main effect of overexpression vs. AAV-GFP. AU/correc., arbitrary units/correction; CD, control diet; H&E, hemotoxylin-eosin; NAS, NAFLD activity score; RQ/PPIB, relative quotient/cyclophilin B; WD, Western diet.
In Vitro and In Vivo NO Donor Effects on Mitochondrial Function in eNOShep−/− Hepatocytes and Mice
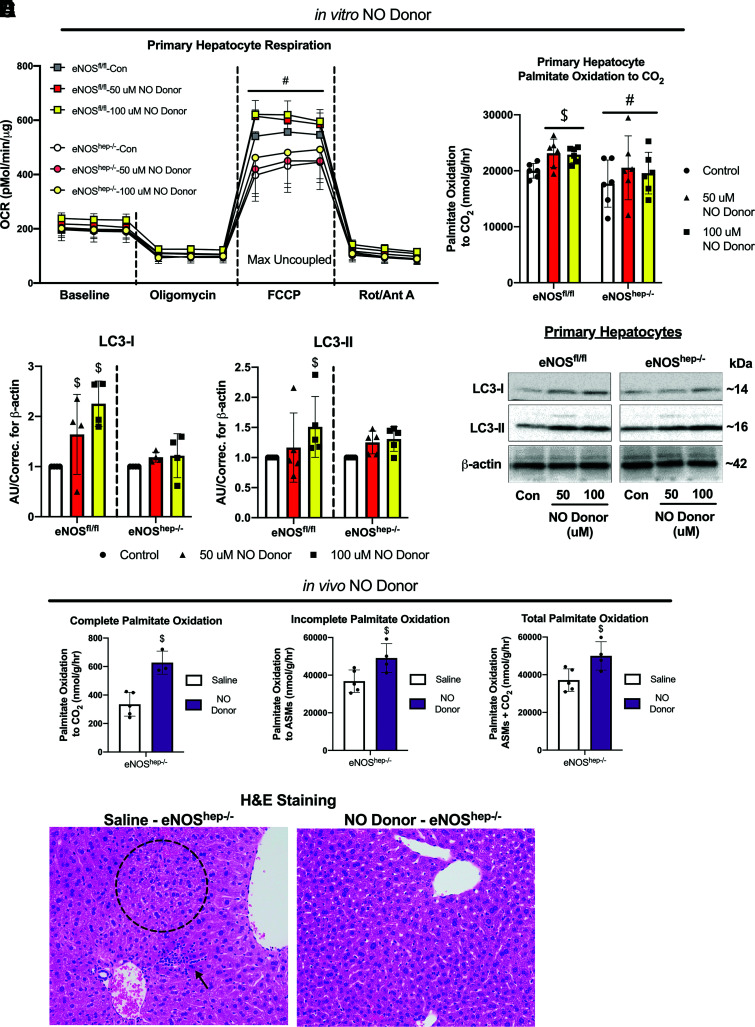
In an attempt to rescue the decreased respiration observed in eNOShep−/− hepatocytes, isolated primary hepatocytes were exposed to varying concentrations (50 μmol/L and 100 μmol/L) of the NO donor DETA NONOate. Maximal uncoupled respiration was significantly higher in eNOSfl/fl versus eNOShep−/− hepatocytes, regardless of NO treatment (Fig. 7A), but NO donor administration did not increase cellular respiration in either eNOShep−/− or eNOSfl/fl hepatocytes (Fig. 7A). However, the NO donor did increase palmitate oxidation to CO2 in eNOSfl/fl hepatocytes compared with control untreated cells, but did not rescue the reduced palmitate oxidation seen in the eNOShep−/− hepatocytes (Fig. 7B). In addition, 100 μmol/L of NO donor increased LC3-I and LC3-II protein content in eNOSfl/fl hepatocytes, but not in eNOShep−/− hepatocytes (Fig. 7C). Conversely, administration of the liver-specific in vivo NO donor (PYRRO/NO) in eNOShep−/− mice for 3 weeks significantly increased isolated hepatic mitochondrial palmitate oxidation and lowered histological steatosis and inflammation (Fig. 7D and E). This effect was independent of any effect of saline or NO donor injections on body weight (data not shown).
Figure 7.
Effects of in vitro and in vivo NO donor in primary isolated hepatocytes and eNOShep−/− mice. Primary hepatocytes were isolated from female eNOSfl/fl mice (20–22 weeks of age) and administered an NO donor – DETA NONOate (50–100 μmol/L). Effect of NO donor on (A) oxygen consumption rate and (B) complete palmitate oxidation in isolated hepatocytes from eNOSfl/fl and eNOShep−/− mice. C: Protein content and representative Western blot images of LC3-I and LC3-II in primary isolated hepatocytes from eNOSfl/fl and eNOShep−/− mice exposed to NO donor (n = 4–6/group), where groups are normalized to their own respective controls, which does not allow comparison between the genotypes. Three weeks of twice-daily injections of an NO donor increased; D: palmitate oxidation in male eNOShep−/− mice (n = 3–5/group), and decreased (E) histological inflammation and steatosis. Data are presented as mean ± SD. #Significantly different from eNOSfl/fl (P < 0.05). $Significantly different from control-treated cells or saline-injected animals (P < 0.05). ASMs, acid-soluble metabolites; AU/correc., arbitrary units/correction; CD, control diet; Con, control non-treated cells; H&E, hemotoxylin and eosin; OCR, oxygen consumption rate.
Hepatic Insulin Signaling Is Not Compromised in eNOShep−/− Mice
Following acute i.p. injection of insulin, the protein content of hepatic IRS1, IRS2, Akt, and GSK-3β did not differ between genotypes, along with insulin stimulated Aktser473 and AktThr308 phosphorylation (Supplementary Fig. 8). In addition, pIRS1ser612 and pIRS2ser731 were not different between eNOSfl/fl and eNOShep−/− mice, nor was insulin-stimulated phosphorylation of GSK-3βser9 (Supplementary Fig. 8).
Metabolomic Analyses Support Hepatic Mitochondrial Dysfunction in eNOShep−/− Mice
Metabolomic analysis on whole-liver homogenates from eNOSfl/fl versus eNOShep−/− mice on either a CD or WD for 16 weeks revealed that eNOShep−/− mice presented with elevated lactic acid and kynurenine levels versus eNOSfl/fl mice (Supplementary Fig. 7B). This is likely indicative of impaired tricarboxylic acid (TCA) cycle or ETC flux, shunting more pyruvate to lactate production, in which excess can be used for glycogen synthesis or lipid storage (35). Additionally, as kynurenine is a substrate for the TCA cycle, increased levels as seen in eNOShep−/− mice further support the notion of impaired TCA cycle or ETC flux in these mice. Moreover, elevated kynurenine pathways have been associated with loss of mitochondrial function (36).
Reduced Hepatic eNOS Is Associated With Elevated NAS, Reduced Fatty Acid Oxidation, and Reduced BNIP3 Protein Content in Patients With Obesity
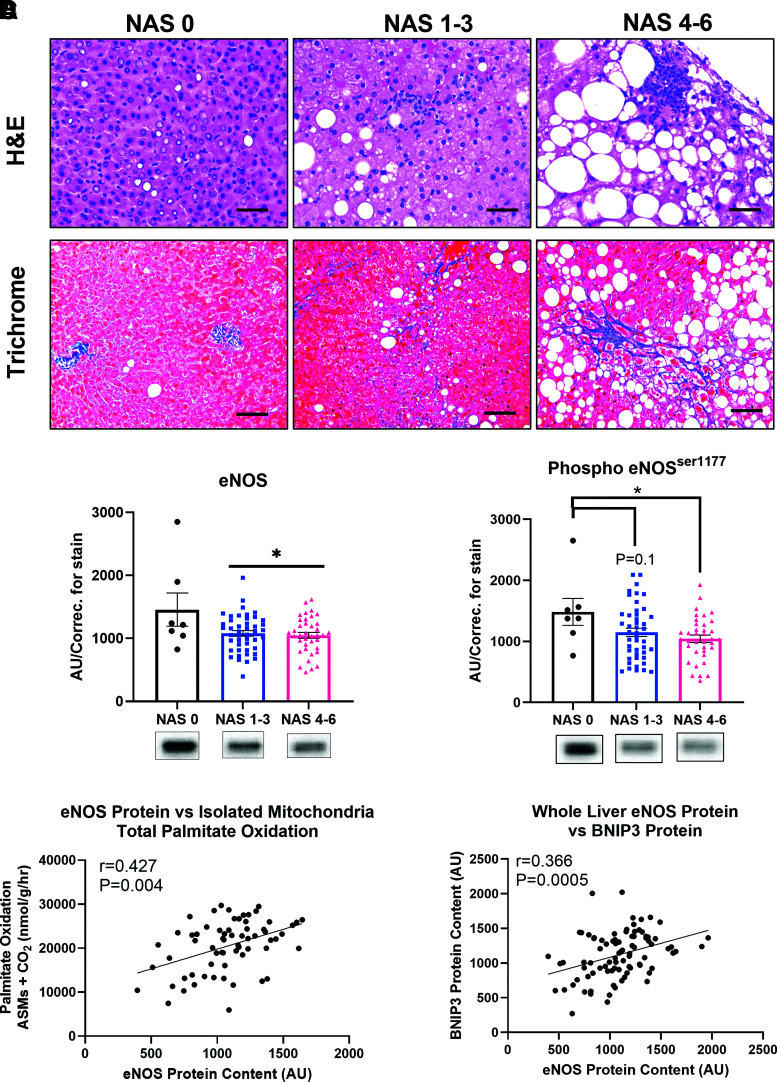
To establish translational relevance, hepatic eNOS expression in liver samples obtained from a cohort of patients undergoing bariatric surgery. Subject characteristics are shown in Supplementary Table 2. Liver samples underwent NAS (the summation of hepatic steatosis, ballooning, and inflammation [27]) and were grouped based on an NAS of 0, 1–3, and 4–6 (representative histology shown in Fig. 8A). We found that both total and phosphorylated (Ser1117) hepatic eNOS protein content was reduced in patients with histologically confirmed NAS of 1–3 compared with patients with an NAS of 0, and this reduction persists with elevated NAS scores of 4–6 (Fig. 8B). This indicates that hepatic eNOS is reduced with early onset of NAFLD and remained suppressed into more advanced NASH. Further, reduced hepatic eNOS protein expression was tightly correlated with reduced hepatic mitochondrial fatty acid oxidation and reduced hepatic protein content of the mitophagy marker BNIP3 in these patients (Fig. 8C and D).
Figure 8.
Hepatic eNOS is reduced in human patients with elevated NAFLD activity scores and associated with hepatic mitochondrial dysfunction and hepatic BNIP3. Liver samples were obtained from adults undergoing elective bariatric surgery, with participants clustered into 3 groups based on histological NAS; no disease (NAS = 0, n = 7), moderate (NAS = 1–3, n = 45), and severe (NAS = 4-6, n = 38). A: Representative liver H&E and trichrome staining for each of the 3 NAS groupings (scale bar represents 50 μm). B: Whole-liver total and phosphorylated (ser1117) eNOS protein content ran on a continuous gel across each NAS cluster (n = 7, 45, 38, respectively). Pearson's correlation of eNOS protein content with (C) isolated hepatic mitochondrial fatty acid oxidation and (D) BNIP3 protein (n = 90). Data are presented as mean ± SD. *Significantly different from NAS 0 (P < 0.05). AU/correc., arbitrary units/correction; ASMs, acid-soluble metabolites; H&E, hemotoxylin and eosin; NAS, NAFLD activity score.
Discussion
The mechanisms behind the decline in hepatic mitochondrial function with NASH progression are not fully elucidated. In this study, genetic and viral approaches were used to establish a novel beneficial role of hepatocyte-specific eNOS in NAFLD development and progression. We demonstrate that eNOS in hepatocytes is required for optimal mitochondrial fatty acid oxidation, mitochondrial respiration, and fully functioning mitophagic capacity to maintain mitochondrial quality control. Moreover, while hepatocyte-specific eNOS deletion exacerbated NAFLD and NASH, hepatocyte-specific overexpression of eNOS attenuated NASH progression and increased hepatic mitochondrial respiration and antioxidant defense. This occurred in the absence of measured impairment in hepatic insulin signaling. These findings were further supported by novel clinical data showing that hepatic eNOS is reduced with worsening liver disease in patients, and this is significantly correlated with reduced mitochondrial fatty acid oxidation and loss of hepatic BNIP3 protein content. Taken together, these data from multiple independent lines of evidence suggest a protective and vital role of hepatocellular eNOS in NAFLD development and progression.
We demonstrate that viral and genetic ablation of hepatocyte eNOS exacerbated liver steatosis and inflammation in short-term CD and WD feeding. Earlier, our group demonstrated that hepatic eNOS activity is markedly reduced during progression from hepatic steatosis to NASH in obese Otsuka Long-Evans Tokushima Fatty rats (12), systemic NOS inhibition induced NASH in this rat model (14), and WD feeding significantly reduces eNOS activation in the liver (13). Moreover, eNOS null mice display exacerbated WD-induced hepatic steatosis and inflammation compared to WT mice (13,37). These observations in whole-body models make it difficult to delineate the role of hepatocyte-specific eNOS in NAFLD/NASH. Using direct manipulation with multiple approaches, we have identified that the lack of eNOS, specifically in hepatocytes, plays a critical role in NAFLD development.
NO inhibits cytochrome c oxidase of the electron transport chain via both competitive and noncompetitive sites (38) and also attenuates respiration in complexes I and III, which are known sites for ROS production through S-nitrosylation (39,40). This protective role of NO inhibition of respiration to prevent excess ROS production is apparent in our hepatocellular eNOS-deficient mice, which present with a ∼50% increase in H2O2 emissions compared with eNOSfl/fl mice on a CD. Despite increased ROS production, hepatocellular eNOS deficiency resulted in reduced mitochondrial respiration in vitro and in vivo. Treating hepatocytes with an NO donor did not rescue the reduced hepatocyte respiration in eNOShep−/− to the level of eNOSfl/fl hepatocytes. Interestingly, NO donors increased LC3 in eNOSfl/fl but not eNOShep−/− primary hepatocytes. Previous studies have shown that administering an NO donor can mitigate NASH progression via reducing M1 macrophage polarization (41) and increasing hepatic stellate cell apoptosis (42). In addition, others have shown that the liver-specific NO donor PYRRO/NO attenuates hepatic steatosis (17–19). In support of this previous work, we demonstrate that in vivo administration of PYRRO/NO significantly increased hepatic mitochondrial palmitate oxidation and reduced histological steatosis and inflammation in CD-fed eNOShep−/− mice. These data collectively suggest that an intact liver environment, including the vasculature, may be required for the benefits of NO administration in improving hepatic mitochondrial function. Interestingly, adenoviral overexpression of eNOS in primary hepatocytes increased mitochondrial respiration (Fig. 5), suggesting that eNOS is likely playing a role in regulating mitochondrial function beyond NO. Future studies are strongly warranted to determine the mechanism behind the NO-independent reduction of mitochondrial function with hepatocellular eNOS deficiency and whether eNOS is required for an NO-induced increase in mitophagy.
Similar to reduced hepatic mitochondrial respiration in eNOShep−/− mice, a robust decrease in hepatic palmitate oxidation was seen both in vivo and in vitro in eNOShep−/− versus eNOSfl/fl mice and hepatocytes, respectively. Unlike the whole-body eNOS KO models (13,43), decreased fatty acid oxidation cannot be explained by reduced mitochondrial content in eNOShep−/− mice, indicating that eNOS in the hepatocyte plays a fundamental role in hepatic mitochondrial function, beyond regulation of content or mass. While the major regulators of mitochondrial biogenesis and markers of mitochondrial content assessed in this study were largely unaffected by hepatocyte eNOS deletion, several measures of mitophagy and mitophagic flux were impaired in eNOShep−/− mice. Both genetic and viral ablation of hepatocellular eNOS impairs mitophagic capacity, including a blunted WD-induced increase in BNIP3 and reduced mitochondrial BNIP3 in eNOShep−/− mice. BNIP3 regulates both cell death and autophagy/mitophagy (44), and BNIP3 null mice present with both exacerbated NAFLD and reduced hepatic mitochondrial function (45). Further, we have previously shown that in vitro siRNA-induced knockdown of eNOS in primary hepatocytes attenuated the induction of BNIP3 in response to mitophagic stimulation (13). In this study, we demonstrate a novel role in vivo for hepatocyte eNOS in mitochondrial turnover, possibly mediated through BNIP3. Moreover, hepatic BNIP3 was strongly positively correlated with eNOS in human liver tissue across the spectrum of NAFLD, highlighting the clinical relevance of the relationship between these proteins. We posit that eNOS-deficient hepatocytes fail to remove poorly functioning mitochondria, supported by the enlarged hepatic mitochondria seen by electron microscopy, the elevated mitochondrial ROS, and the marked reduction in hepatic mitochondrial function in eNOShep−/− mice, which ultimately led to hepatic steatosis and inflammation.
As hepatocyte eNOS deletion/knockdown via multiple approaches increased NASH, increasing eNOS may attenuate liver disease progression. The present studies show that AAV-driven eNOS overexpression in hepatocytes attenuated NASH and fibrosis versus AAV-GFP controls. eNOS overexpression increased the NRF-2 pathway invitro and in vivo (nq01 and nfe212, respectively), suggesting the observed histological benefits may be mediated through the antioxidant effects of NRF-2. This supports previous work from our group showing the link between eNOS and NRF-2 activation (13). Collectively, these data clearly demonstrate a beneficial role for hepatocyte-specific eNOS overexpression in curbing NASH progression, possibly via NRF-2 activation.
Both in vivo and in vitro manipulation of hepatocyte eNOS demonstrate compelling mechanistic data for a potential NASH therapeutic. Moreover, to our knowledge, we demonstrate for the first time a marked reduction in hepatic eNOS and phospho-eNOS in patients with worsening NAS. Supporting our preclinical data, this reduced hepatic eNOS expression was strongly correlated with reduced mitochondrial fatty acid oxidation and reduced mitophagy protein BNIP3 in these patients. The translational relevance of these data not only underscores the importance and impact of our animal studies, but also highlights the need for future exploration into hepatic eNOS as a target for NASH treatment.
In summary, the current study reveals an important molecular role for hepatocyte-specific eNOS as a key regulator of NAFLD/NASH susceptibility and hepatic mitochondrial quality control with direct clinical correlation to patients with NASH. The presented data support that hepatocyte eNOS deficiency leads to an imbalance in hepatic mitochondrial turnover, ultimately leading to poorly functioning hepatic mitochondria and increased ROS generation. Given that the mechanisms of NASH progression are unresolved with no Food and Drug Administration–approved therapeutics, targeting eNOS in the hepatocyte may represent a potential tool for treatment of NASH.
Article Information
Funding. This work is supported by U.S. Department of Veterans Affairs VA-Merit grant I01BX003271 (to R.S.R.) and National Institutes of Health grant R01 DK113701-01 (to R.S.R., E.J.P., and J.A.I.) and partially supported by American College of Sports Medicine Foundation Doctoral Student Research grant 18-00754 (to R.P.C.). R.J.D. is supported by a National Institutes of Health T32 grant (T32 OD011126). This work was supported with resources and the use of facilities at the Harry S. Truman Memorial Veterans’ Hospital in Columbia, MO.
Duality of Interest. No potential conflicts of interest relevant to this article were reported.
Author Contributions. R.P.C., J.A.I., J.P.T., and R.S.R. were involved in the study concept and design. T.T. provided the eNOS floxed mouse model. R.P.C., M.P.M., R.J.D., G.M.M., R.D.S., A.A.W., A.D.-A., and R.S.R. helped with acquisition of data. R.P.C., M.P.M., R.J.D., G.M.M., R.D.S., A.D.-A., and R.S.R. analyzed and interpreted results. R.P.C., and R.S.R. provided statistical analysis of the data. R.P.C. and R.S.R. drafted the manuscript, while R.P.C., M.P.M., G.M.M., T.T., R.D.S., A.A.W., A.D.-A., J.A.I., E.J.P., J.P.T., and R.S.R. revised the manuscript and provided important intellectual content. R.P.C., M.P.M., R.J.D., G.M.M., T.T., R.D.S., A.A.W., A.D.-A., J.A.I., E.J.P., J.P.T., and R.S.R. approved the final version of manuscript. R.P.C., R.J.D., and R.S.R. obtained funding. R.S.R. is the guarantor of this work and, as such, had full access to all of the data in the study and takes responsibility for the integrity of the data and the accuracy of the data analysis.
Footnotes
This article contains supplementary material online at https://doi.org/10.2337/figshare.15108567.
References
- 1. Wong RJ, Aguilar M, Cheung R, et al. Nonalcoholic steatohepatitis is the second leading etiology of liver disease among adults awaiting liver transplantation in the United States. Gastroenterology 2015;148:547–555 [DOI] [PubMed] [Google Scholar]
- 2. Targher G, Marra F, Marchesini G. Increased risk of cardiovascular disease in non-alcoholic fatty liver disease: causal effect or epiphenomenon? Diabetologia 2008;51:1947–1953 [DOI] [PubMed] [Google Scholar]
- 3. Stepanova M, Rafiq N, Makhlouf H, et al. Predictors of all-cause mortality and liver-related mortality in patients with non-alcoholic fatty liver disease (NAFLD). Dig Dis Sci 2013;58:3017–3023 [DOI] [PubMed] [Google Scholar]
- 4. Pessayre D, Fromenty B. NASH: a mitochondrial disease. J Hepatol 2005;42:928–940 [DOI] [PubMed] [Google Scholar]
- 5. Wei Y, Rector RS, Thyfault JP, Ibdah JA. Nonalcoholic fatty liver disease and mitochondrial dysfunction. World J Gastroenterol 2008;14:193–199 [DOI] [PMC free article] [PubMed] [Google Scholar]
- 6. Koliaki C, Szendroedi J, Kaul K, et al. Adaptation of hepatic mitochondrial function in humans with non-alcoholic fatty liver is lost in steatohepatitis. Cell Metab 2015;21:739–746 [DOI] [PubMed] [Google Scholar]
- 7. Rector RS, Thyfault JP, Uptergrove GM, et al. Mitochondrial dysfunction precedes insulin resistance and hepatic steatosis and contributes to the natural history of non-alcoholic fatty liver disease in an obese rodent model. J Hepatol 2010;52:727–736 [DOI] [PMC free article] [PubMed] [Google Scholar]
- 8. Nisoli E, Carruba MO. Nitric oxide and mitochondrial biogenesis. J Cell Sci 2006;119:2855–2862 [DOI] [PubMed] [Google Scholar]
- 9. Nisoli E, Clementi E, Paolucci C, et al. Mitochondrial biogenesis in mammals: the role of endogenous nitric oxide. Science 2003;299:896–899 [DOI] [PubMed] [Google Scholar]
- 10. Nisoli E, Falcone S, Tonello C, et al. Mitochondrial biogenesis by NO yields functionally active mitochondria in mammals. Proc Natl Acad Sci USA 2004;101:16507–16512 [DOI] [PMC free article] [PubMed] [Google Scholar]
- 11. Nisoli E, Tonello C, Cardile A, et al. Calorie restriction promotes mitochondrial biogenesis by inducing the expression of eNOS. Science 2005;310:314–317 [DOI] [PubMed] [Google Scholar]
- 12. Sheldon RD, Laughlin MH, Rector RS. Reduced hepatic eNOS phosphorylation is associated with NAFLD and type 2 diabetes progression and is prevented by daily exercise in hyperphagic OLETF rats. J Appl Physiol (1985) 2014;116:1156–1164 [DOI] [PMC free article] [PubMed] [Google Scholar]
- 13. Sheldon RD, Meers GM, Morris EM, et al. eNOS deletion impairs mitochondrial quality control and exacerbates Western diet-induced NASH. Am J Physiol Endocrinol Metab 2019;317:E605–E616 [DOI] [PMC free article] [PubMed] [Google Scholar]
- 14. Sheldon RD, Padilla J, Jenkins NT, Laughlin MH, Rector RS. Chronic NOS inhibition accelerates NAFLD progression in an obese rat model. Am J Physiol Gastrointest Liver Physiol 2015;308:G540–G549 [DOI] [PMC free article] [PubMed] [Google Scholar]
- 15. Jiang R, Wang S, Takahashi K, et al. Generation of a conditional allele for the mouse endothelial nitric oxide synthase gene. Genesis 2012;50:685–692 [DOI] [PMC free article] [PubMed] [Google Scholar]
- 16. McCoin CS, Von Schulze A, Allen J, et al. Sex modulates hepatic mitochondrial adaptations to high-fat diet and physical activity. Am J Physiol Endocrinol Metab 2019;317:E298–E311 [DOI] [PMC free article] [PubMed] [Google Scholar]
- 17. Kus E, Jasiński K, Skórka T, Czyzynska-Cichon I, Chlopicki S. Short-term treatment with hepatoselective NO donor V-PYRRO/NO improves blood flow in hepatic microcirculation in liver steatosis in mice. Pharmacol Rep 2018;70:463–469 [DOI] [PubMed] [Google Scholar]
- 18. Kus K, Walczak M, Maslak E, et al. Hepatoselective nitric oxide (NO) donors, V-PYRRO/NO and V-PROLI/NO, in nonalcoholic fatty liver disease: a comparison of antisteatotic effects with the biotransformation and pharmacokinetics. Drug Metab Dispos 2015;43:1028–1036 [DOI] [PMC free article] [PubMed] [Google Scholar]
- 19. Maslak E, Zabielski P, Kochan K, et al. The liver-selective NO donor, V-PYRRO/NO, protects against liver steatosis and improves postprandial glucose tolerance in mice fed high fat diet. Biochem Pharmacol 2015;93:389–400 [DOI] [PubMed] [Google Scholar]
- 20. Rector RS, Morris EM, Ridenhour S, et al. Selective hepatic insulin resistance in a murine model heterozygous for a mitochondrial trifunctional protein defect. Hepatology 2013;57:2213–2223 [DOI] [PMC free article] [PubMed] [Google Scholar]
- 21. Guguen-Guillouzo C. 11. Isolation and culture of animal and human hepatocytes. In Culture of Epithelial Cells. 2nd ed. Freshney RI, Freshney MG, Eds. New York, Wiley-Liss, 2002, pp. 337–379 [Google Scholar]
- 22. Morris EM, Meers GME, Booth FW, et al. PGC-1α overexpression results in increased hepatic fatty acid oxidation with reduced triacylglycerol accumulation and secretion. Am J Physiol Gastrointest Liver Physiol 2012;303:G979–G992 [DOI] [PMC free article] [PubMed] [Google Scholar]
- 23. Azimifar SB, Nagaraj N, Cox J, Mann M. Cell-type-resolved quantitative proteomics of murine liver. Cell Metab 2014;20:1076–1087 [DOI] [PubMed] [Google Scholar]
- 24. Win S, Than TA, Le BHA, García-Ruiz C, Fernandez-Checa JC, Kaplowitz N. Sab (Sh3bp5) dependence of JNK mediated inhibition of mitochondrial respiration in palmitic acid induced hepatocyte lipotoxicity. J Hepatol 2015;62: 1367–1374 [DOI] [PMC free article] [PubMed] [Google Scholar]
- 25. Syed AA, Lahiri S, Mohan D, et al. Cardioprotective effect of Ulmus wallichiana planchon in β-adrenergic agonist induced cardiac hypertrophy. Front Pharmacol 2016;7:510. [DOI] [PMC free article] [PubMed] [Google Scholar]
- 26. Rector RS, Thyfault JP, Morris RT, et al. Daily exercise increases hepatic fatty acid oxidation and prevents steatosis in Otsuka Long-Evans Tokushima Fatty rats. Am J Physiol Gastrointest Liver Physiol 2008;294:G619–G626 [DOI] [PubMed] [Google Scholar]
- 27. Kleiner DE, Brunt EM, Van Natta M, et al.; Nonalcoholic Steatohepatitis Clinical Research Network . Design and validation of a histological scoring system for nonalcoholic fatty liver disease. Hepatology 2005;41:1313–1321 [DOI] [PubMed] [Google Scholar]
- 28. Moore MP, Cunningham RP, Kelty TJ, et al. Ketogenic diet in combination with voluntary exercise impacts markers of hepatic metabolism and oxidative stress in male and female Wistar rats. Appl Physiol Nutr Metab 2020;45:35–44 [DOI] [PubMed] [Google Scholar]
- 29. Rector RS, Uptergrove GM, Morris EM, et al. Daily exercise vs. caloric restriction for prevention of nonalcoholic fatty liver disease in the OLETF rat model. Am J Physiol Gastrointest Liver Physiol 2011;300:G874–G883 [DOI] [PMC free article] [PubMed] [Google Scholar]
- 30. Rector RS, Morris EM, Ridenhour S, Meers GM, Hsu FF, Turk J, Ibdah JAJH. Selective hepatic insulin resistance in a murine model heterozygous for a mitochondrial trifunctional protein defect. Hepatology 2013;57:2213–2223 [DOI] [PMC free article] [PubMed] [Google Scholar]
- 31. Fletcher JA, Meers GM, Linden MA, et al. Impact of various exercise modalities on hepatic mitochondrial function. Med Sci Sports Exerc 2014;46:1089–1097 [DOI] [PMC free article] [PubMed] [Google Scholar]
- 32. Muoio DM, Way JM, Tanner CJ, et al. Peroxisome proliferator-activated receptor-alpha regulates fatty acid utilization in primary human skeletal muscle cells. Diabetes 2002;51:901–909 [DOI] [PubMed] [Google Scholar]
- 33. Yamada T, Murata D, Adachi Y, et al. Mitochondrial stasis reveals p62-mediated ubiquitination in parkin-independent mitophagy and mitigates nonalcoholic fatty liver disease. Cell Metab 2018;28:588–604.e5 [DOI] [PMC free article] [PubMed] [Google Scholar]
- 34. Lira VA, Brown DL, Lira AK, et al. Nitric oxide and AMPK cooperatively regulate PGC-1 in skeletal muscle cells. J Physiol 2010;588:3551–3566 [DOI] [PMC free article] [PubMed] [Google Scholar]
- 35. Lund J, Aas V, Tingstad RH, Van Hees A, Nikolić N. Utilization of lactic acid in human myotubes and interplay with glucose and fatty acid metabolism. Sci Rep 2018;8:9814. [DOI] [PMC free article] [PubMed] [Google Scholar]
- 36. Castro-Portuguez R, Sutphin GL. Kynurenine pathway, NAD+ synthesis, and mitochondrial function: Targeting tryptophan metabolism to promote longevity and healthspan. Exp Gerontol 2020;132:110841. [DOI] [PMC free article] [PubMed] [Google Scholar]
- 37. Nozaki Y, Fujita K, Wada K, et al. Deficiency of eNOS exacerbates early-stage NAFLD pathogenesis by changing the fat distribution. BMC Gastroenterol 2015;15:177. [DOI] [PMC free article] [PubMed] [Google Scholar]
- 38. Mason MG, Nicholls P, Wilson MT, Cooper CE. Nitric oxide inhibition of respiration involves both competitive (heme) and noncompetitive (copper) binding to cytochrome c oxidase. Proc Natl Acad Sci USA 2006;103:708–713 [DOI] [PMC free article] [PubMed] [Google Scholar]
- 39. Clementi E, Brown GC, Feelisch M, Moncada S. Persistent inhibition of cell respiration by nitric oxide: crucial role of S-nitrosylation of mitochondrial complex I and protective action of glutathione. Proc Natl Acad Sci USA 1998;95:7631–7636 [DOI] [PMC free article] [PubMed] [Google Scholar]
- 40. Brown GC, Borutaite V. Inhibition of mitochondrial respiratory complex I by nitric oxide, peroxynitrite and S-nitrosothiols. Biochim Biophys Acta 2004;1658:44–49 [DOI] [PubMed] [Google Scholar]
- 41. Seth RK, Das S, Pourhoseini S, et al. M1 polarization bias and subsequent nonalcoholic steatohepatitis progression is attenuated by nitric oxide donor DETA NONOate via inhibition of CYP2E1-induced oxidative stress in obese mice. J Pharmacol Exp Ther 2015;352:77–89 [DOI] [PMC free article] [PubMed] [Google Scholar]
- 42. Langer DA, Das A, Semela D, et al. Nitric oxide promotes caspase-independent hepatic stellate cell apoptosis through the generation of reactive oxygen species. Hepatology 2008;47:1983–1993 [DOI] [PMC free article] [PubMed] [Google Scholar]
- 43. Le Gouill E, Jimenez M, Binnert C, et al. Endothelial nitric oxide synthase (eNOS) knockout mice have defective mitochondrial beta-oxidation. Diabetes 2007;56:2690–2696 [DOI] [PubMed] [Google Scholar]
- 44. Zhang J, Ney PA. Role of BNIP3 and NIX in cell death, autophagy, and mitophagy. Cell Death Differ 2009;16:939–946 [DOI] [PMC free article] [PubMed] [Google Scholar]
- 45. Glick D, Zhang W, Beaton M, et al. BNip3 regulates mitochondrial function and lipid metabolism in the liver. Mol Cell Biol 2012;32:2570–2584 [DOI] [PMC free article] [PubMed] [Google Scholar]


