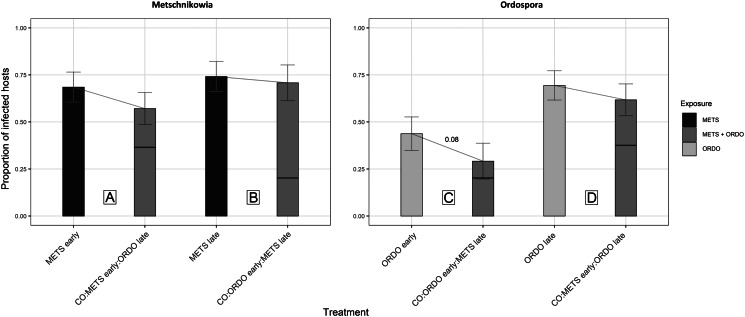
Fig. 3.
Graphical representation of the proportion of Daphnia successfully infected by the parasites Metschnikowia and Ordospora. Parasite infectivity was compared between single and co-exposure treatments, to answer the following: (A) How does Metschnikowia respond to later arrival of Ordospora? (B) How does Metschnikowia respond to prior infection by Ordospora? (C) How does Ordospora respond to later arrival of Metschnikowia? (D) How does Ordospora respond to prior infection by Metschnikowia? The horizontal section of the bar in co-exposure treatments represents the contribution of coinfections to the overall number of successful infections by the focal parasite. Individuals which did not survive until the earliest possible observation of parasite symptoms were excluded from the analysis of infectivity; reported proportions are computed amongst the remaining number of individuals considered viable. Error bars depict the standard error of the mean (calculated from binary values assigned to individual Daphnia: 0 = non infected, 1 = infected). Significance levels are provided by logistic regression performed across single and co-exposure treatments with shared timing of infection; none of the pairwise comparisons were significant.

