Abstract
Computational approaches have recently gained popularity in the field of read-across to automatically fill data-gaps for untested chemicals. Previously, we developed the generalized read-across (GenRA) tool, which utilizes in vitro bioactivity data in conjunction with chemical descriptor information to derive local validity domains to predict hazards observed in in vivo toxicity studies. Here, we modified GenRA to quantitatively predict point of departure (POD) values obtained from US EPA’s Toxicity Reference Database (ToxRefDB) version 2.0. To evaluate GenRA predictions, we first aggregated oral Lowest Observed Adverse Effect Levels (LOAEL) for 1,014 chemicals by systemic, developmental, reproductive, and cholinesterase effects. The mean LOAEL values for each chemical were converted to log molar equivalents. Applying GenRA to all chemicals with a minimum Jaccard similarity threshold of 0.05 for Morgan fingerprints and a maximum of 10 nearest neighbors predicted systemic, developmental, reproductive, and cholinesterase inhibition min aggregated LOAEL values with R2 values of 0.23, 0.22, 0.14, and 0.43, respectively. However, when evaluating GenRA locally to clusters of structurally-similar chemicals (containing 2 to 362 chemicals), average R2 values for systemic, developmental, reproductive, and cholinesterase LOAEL predictions improved to 0.73, 0.66, 0.60 and 0.79, respectively. Our findings highlight the complexity of the chemical-toxicity landscape and the importance of identifying local domains where GenRA can be used most effectively for predicting PODs.
Introduction
There is an increasing demand for hazard, exposure, and dose-response information to evaluate the safety of thousands of data-poor chemicals in commerce. International chemical management laws including the U.S. Toxic Substances Control Act (TSCA) (EPA, 2008), the European Union’s Registration, Evaluation, Authorisation and Restriction of Chemicals (REACH)(EC, 2006), and the Canadian Chemicals Management Plan (CMP) (ECCC/HC, 2016) are considering the use of new approach methodologies (NAMs) to fill data gaps. NAMs refer to a broadly descriptive reference to any technology, methodology, approach, or combination thereof that can be used to provide information on chemical hazard and risk assessment that avoids the use of intact animals (EPA, 2018). Data from NAMs such as high-throughput screening (HTS) (Houck et al., 2013), and more recently transcriptomics (Harrill et al., 2019), are being used to advance hazard and risk assessment in several ways (Kavlock et al., 2018; Thomas et al., 2019): to evaluate the utility of NAMs to estimate quantitative PODs for adverse effects and identify mode-of-action; to develop NAM based profiles for chemicals categories; and to develop new methods for estimating exposure. Here, we present our work on a generalized read-across approach, GenRA (Shah et al., 2016; Helman et al., 2018; Helman et al., 2019) that uses available large-scale chemical, biological and toxicological data to predict hazard for data-poor substances.
Read-across is a widely used technique for filling data gaps for poorly studied substances within category and analogue approaches for regulatory purposes. Read-across is an approach for inferring an unknown property for a substance of interest from known information on the same property from a ‘similar’ substance or substances. Despite considerable regulatory technical guidance (for example, (OECD, 2017)), there are many challenges in establishing consistency between methods, e.g. how to characterize ‘similarity’, determining the level of evidence required, and evaluating the confidence or uncertainty in read-across inferences (Patlewicz et al., 2017). To address some of these issues, we have developed an approach for performing systematic and automated read-across predictions, called GenRA (Generalized Read-Across) (Shah et al., 2016). In GenRA, an unknown property of a chemical (called the target) is calculated as a similarity weighted average of the same property from similar analogues (also referred to as source analogues), based on an approach originally developed by Low et al. (Low et al., 2013). A key feature of GenRA is the ability to estimate confidence in read-across predictions based on local validity domains, which can be defined by chemical structure, bioactivity data, and more recently, physicochemical properties (Helman et al., 2018). Previously, we have used GenRA to predict toxicity classifications in repeated dose studies (Shah et al., 2016) and here we extend the approach to generate similarity-weighted POD predictions from the same studies.
There are few sources of highly standardized information from animal toxicity testing studies and ToxRefDB (Watford et al., 2019) is one of them. ToxRefDB is a database containing summary results for repeated dose studies, including subacute, subchronic, developmental, multi-generation reproduction, and chronic study designs that often follow or resemble the US EPA Health Effects guidelines, with data for over 1,000 substances. ToxRefDB data include effect level information, including the dose associated with a specific target tissue and effect type, and study metadata from multiple study types and sources. The summary values in ToxRefDB include lowest observed adverse effect levels (LOAELs) and lowest effect levels (LELs), where LOAELs reflect toxicological expertise regarding adversity and LELs reflect only statistical significance; often, the LEL and LOAEL value coincide for a given chemical-effect pair. In chemical safety evaluation, in vivo toxicology studies for hazard identification can be used to define a POD, or dose corresponding to the no or lowest observable adverse effect level (NOAEL or LOAEL), or in some cases, a modelled benchmark dose. The POD is then used as the basis for derivation of a reference dose that incorporates additional uncertainty factors. Thus, using GenRA to obtain a quantitative prediction of possible range of LOAEL values, and qualitative prediction of target organs or effects, may have direct value for chemical safety assessment. In this work, the LOAELs from ToxRefDB version 2.0, and predictions of LOAELs, are collectively referred to as PODs that could be used in screening level chemical safety assessments.
Although the target tissues and endpoints measured in studies that are from guideline-adherent or guideline-like studies produce a dataset that often shares the same measures, the specific types of adverse effects (e.g. histopathological lesion, morphological alteration, clinical chemistry measure) for a given set of chemicals can be diverse. Therefore, careful attention to how adverse effect information are aggregated for GenRA is needed. Further, though ToxRefDB v2.0 is a rich resource of study and effect information, not all chemicals have summary information in ToxRefDB v2.0 for all chemical-study type-species-administration combinations. For example, tabulating the critical effects and PODs for source analogues of a chemical of interest across diverse study types often results in sparsely populated matrix. While such a matrix may be routinely used for expert-driven read-across, it cannot be readily used for data driven read-across predictions. One approach for dealing with the sparsity of toxicity information for chemicals is to aggregate it meaningfully based on study design, anatomic localization, effect severity, etc. In our previous work (Shah et al., 2016), for instance, we aggregated diverse histopathological effects of each chemical by a guideline study type to assign a binary outcome at the level of target organs. As a result, each chemical was determined to be either positive or negative for one of 164 different types of study-target organ effects. Here, we use a higher-order aggregation scheme to assign effects into four broad endpoint categories (systemic, reproductive, developmental, cholinesterase) from ToxRefDB v2.0 that may be informative for hazard identification. Additionally, instead of a binary hazard classification, we have a quantitative POD for each chemical and endpoint category derived from the LOAEL values across multiple studies.
Predicting the dose at which a chemical will cause toxicity is challenging because of the underlying complexity of toxicokinetic (or pharmacokinetic) and toxicodynamic (or pharmacodynamic) processes. The type of predictive approach depends on the risk assessment context (e.g. prioritization or screening vs. environmental clean-up) and availability of chemical-specific data. For data-rich chemicals, physiologically-based computational modeling approaches attempt to capture relevant processes at varying levels of resolution to quantitatively predict exposure levels associated with adverse effects (Bhattacharya et al., 2012; DeWoskin et al., 2014; Shah and Wambaugh, 2010; Wambaugh and Shah, 2010). For data-poor chemicals (i.e. when only chemical structure is available), machine learning techniques that analyze structural patterns in chemicals to mine associations with bioactivity (quantitatively and quantitatively), are one of the few options available to risk assessors. Quantitative structure activity relationships (QSAR) have been widely employed to predict POD values associated with acute toxicity (Zhu et al., 2009), developmental toxicity (Venkatapathy and Wang, 2013), reproductive toxicity (Basant et al., 2016) and chronic toxicity (Rupp et al., 2010). More recently, Wignall et al (Wignall et al., 2018) used QSAR models to systematically predict POD and reference dose values, which they refer to as conditional toxicity values (CTVs). Since the publication of the OECD Validation Principles for (Q)SARs (OECD, 2004), most QSAR approaches consider the notion of an applicability domain (Sahigara et al., 2012) for predicting quantitative toxicity outcomes. GenRA is most closely related to local QSAR approaches that explicitly use nearest-neighbors to predict POD values (Helman et al., 2019a; Luechtefeld et al., 2018). To our knowledge, no existing approach has systematically evaluated the predictive accuracy of LOAEL values for reproductive, developmental and systemic effects, and cholinesterase inhibition for the entire set of chemicals in ToxRefDB v2.0.
In this manuscript, we describe how we used GenRA to make quantitative POD predictions for chemicals based on aggregated LOAEL values from ToxRefDB v2.0. First, we extended GenRA to make similarity weighted predictions of POD values (based on LOAELs). Second, we systematically analyzed local domains for all chemicals using structure descriptors and evaluated the accuracy for predicting PODs ‘globally’ by cross-validation testing. Third, and finally, we compared the accuracy of GenRA POD predictions for clusters of structurally related chemicals (containing 2 to 362 chemicals) (identified by us previously in (Shah et al., 2016)) with the ‘global’ GenRA predictions. The outcome of this research is a new version of GenRA v2.0 that can provide both qualitative and quantitative information for regulatory data gap filling, with clear acknowledgement of the uncertainties in the read-across performed.
Methods
Toxicity data
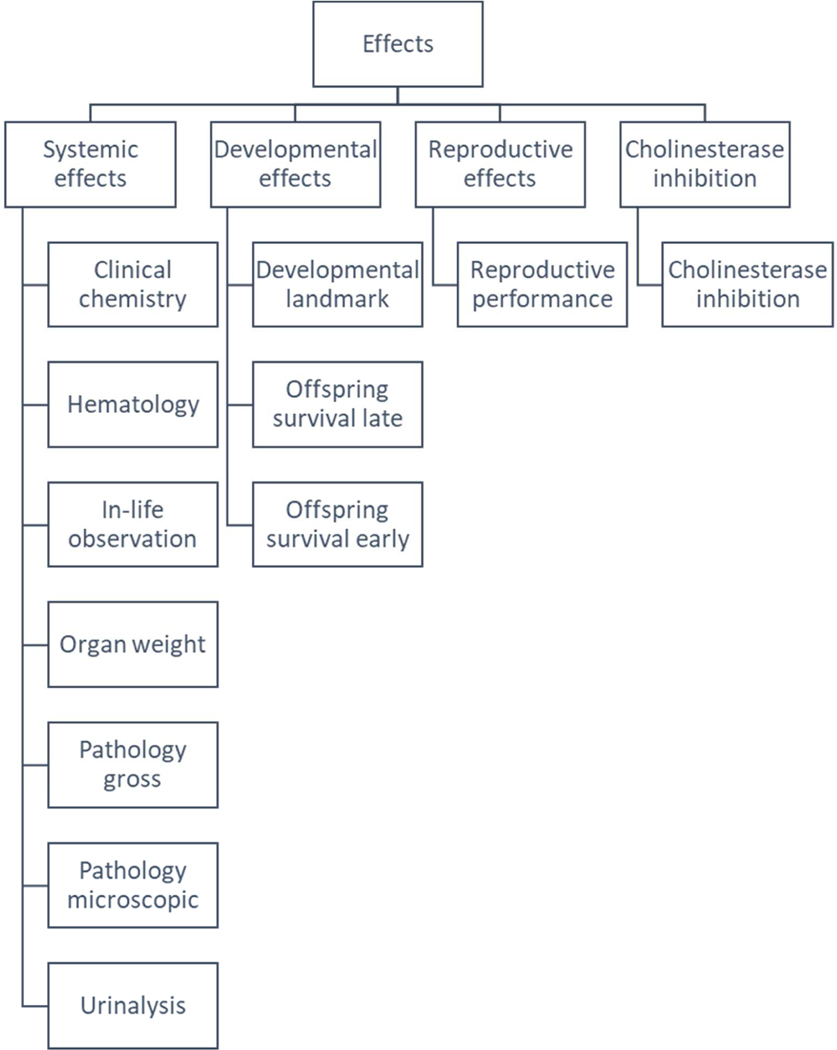
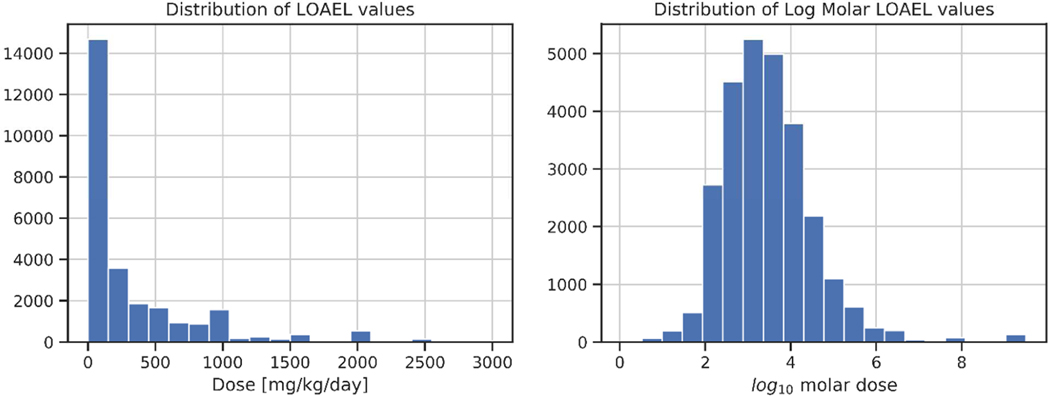
We obtained toxicity data on from ToxRefDB v2.0, which contains in vivo effects for 1,014 chemicals and 5,900 standardized animal testing studies (Watford et al., 2019). In a major update of ToxRefDB, the v2.0 database further standardizes the nomenclature for chemical-induced effects using a specific ToxRefDB vocabulary that captures testing requirements that is then mapped to the Unified Medical Language System (UMLS) (Bodenreider, 2003), includes a thorough expert evaluation of toxicity data to determine LOAELs for most study records, clearly distinguishes between negative effects versus untested effects, and provides several approaches for aggregating diverse chemical effects to estimate POD values. ToxRefDB v2.0 defines “effect profiles” to aggregate toxicologically-relevant in vivo findings and their associated PODs. For example, there are four broad endpoint categories in ToxRefDB including: cholinesterase inhibition, developmental effects, reproductive effects, and systemic effects. These four categories can be categorized into 13 endpoint types (displayed in Figure 1) and associated with 253 target organs. For this analysis, we only considered LOAEL values that were based on oral administration, which were available for 1,049 chemicals. Since LOAEL values were aggregated across multiple studies, there were 27,546 values for 1,049 chemicals across the four endpoint categories. Table 1 shows a breakdown of the number of POD values per endpoint category. We converted the POD values to their log molar equivalents to normalize the data and to decrease the impact of potential outliers on predictions (Figure 2).
Figure 1.
Hierarchical relationship between the endpoint categories and endpoint types used to aggregate the lowest observed adverse effect levels (LOAELs) in ToxRefDB v2. The top-level value is LOAEL, followed by the 4 endpoint categories and finally the 14 endpoint types.
Table 1.
The number of chemicals and lowest observed adverse effect level (LOAEL) values based on endpoint categories in ToxRefDB v2.0.
| # of chemicals with at least these many LOAEL values | |||||
|---|---|---|---|---|---|
| Endpoint category | # of LOAELS | # of chemicals | 2 | 3 | mean(# LOAEL values) |
| Cholinesterase inhibition | 162 | 85 | 18 | 8 | 1.9 |
| Developmental effects | 1754 | 488 | 195 | 151 | 3.6 |
| Reproductive effects | 1129 | 452 | 140 | 79 | 2.5 |
| Systemic effects | 24501 | 1041 | 963 | 937 | 24 |
Figure 2.
Distributions of lowest observed adverse effect levels (LOAELs) in ToxRefDB v2.0. The histogram on the left shows the LOAELs in mg/kg/day while the histogram on the right shows the same values after they have been transformed by log10 molar units.
For chemicals with multiple LOAEL values for each chemical and endpoint category, the minimum and mean LOAEL values were recorded. Most chemicals that produced cholinesterase inhibition, developmental, and reproductive effects only had 1 POD value. On the other hand, chemicals had approximately 9 systemic LOAEL values on average and the mean or the minimum value were used for the subsequent analysis. Out of the 1,049 chemicals considered in this analysis, the numbers of chemicals with LOAEL values associated with systemic, developmental, reproductive effects, and cholinesterase inhibition, were 1041, 488, 452, and 85, respectively. The aggregated POD data used in the analysis are provided as supplemental material (S1).
Chemical structure data
The chemical structures were represented as Morgan fingerprints (Rogers and Hahn, 2010) as described previously (Shah et al., 2016). Briefly, fingerprints were represented as binary (bit) vectors where the elements represent the presence or absence of a certain chemical structural feature. First, the substances in ToxRefDB v2.0, were mapped to unique chemical structures in the EPA CompTox Chemicals dashboard (Williams et al., 2017). This was possible for 1014 out of the 1049 chemicals in ToxRefDB v2.0. Second, the standardized chemical structure data, which are available in “QSAR-ready” form in simple molecular-input line-entry system (SMILES) format, were obtained from EPA CompTox Chemicals dashboard. Third, the SMILES strings were converted to Morgan fingerprints using the freely available python RDKit cheminformatics library (Landrum, 2015). The Morgan chemical fingerprints for all chemicals are provided as supplemental material (S2).
Predicting POD values using GenRA
GenRA uses similarity weighted activity to predict hazard classifications for a chemical of interested using information about the nearest neighbors (Shah et al., 2016). Here, we extended the GenRA algorithm to estimate POD values for a chemical of interest based on the POD values for the nearest neighbors using the following formula (Equation 1):
| [1] |
Where, is the predicted POD for the endpoint category (tox) of the chemical (ci) of interest , is the in vivo POD of the nearest neighbor is the Jaccard index for the chemical structure fingerprints of ci and cj, and k is the number of nearest neighbors. Per read-across terminology (Shah et al., 2016; Patlewicz et al., 2018), ci and cj are referred to as the target and source analogue, respectively. We used Equation 1 to predict the POD values for each chemical in ToxRefDB v2.0 by varying the number of source analogues (k)and the similarity threshold (s). We refer to kand s as the tuning parameters (or hyperparameters) for GenRA as they determine the local validity domain for an automated read-across prediction of POD and its accuracy. The default parameter settings of s=0.05 and k=10 (up to k source analogues) were used in this analysis, unless stated otherwise. These default values for GenRA were aimed at maximizing the ability to predict POD for as many chemicals as possible. We conducted a grid search on values of k and s to find the optimal parameter settings for each endpoint category and examined two choices for selecting k source analogues including: picking exactly k source analogues, and up to k source analogues. When choosing up to k analogues, predictions were not made unless there were at least k source analogues.
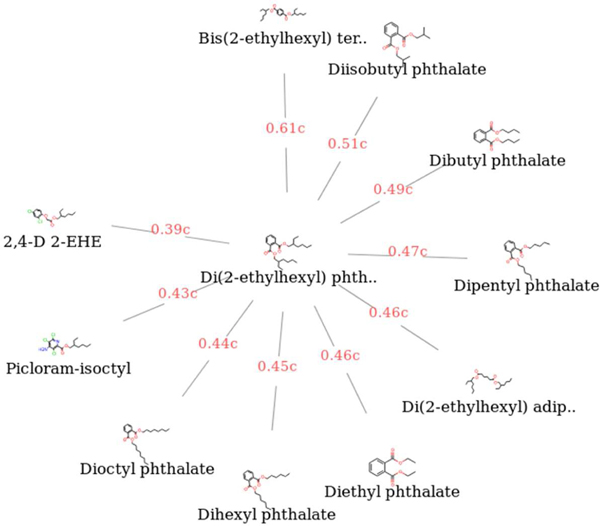
Illustrate prototypical predictionWe show an illustrative example of how to generate a GenRA systemic LOAEL prediction for target chemical Di(2-ethylhexyl) phthalate (DEHP). Source analogues characterised by their Morgan chemical fingerprints were used to search for up to 10 source analogues (k=10) with systemic LOAEL values. Figure 3 shows the results of searching the neighborhood of DEHP as a radial plot (which can be generated using the GenRA web tool (Helman et al., 2019b), which shows the 10 most similar chemicals to DEHP with systemic LOAEL data and their associated Jaccard similarity scores (the results are also shown in Table 2). The number of analogues returned by the similarity search depends on the choice of chemical, the fingerprint type used to represent the chemical and the metric used to measure similarity between chemicals. The prediction of the LOAEL for systemic toxicity for DEHP is computed as the similarity-weighted average of the source analogue LOAEL values. Therefore, ptox =(0.61*2.81+0.51*2.67+0.49*2.31…)/(0.61+0.51+0.49…) = 2.95, which is very similar to the ‘true’ or observed log molar systemic LOAEL for DEHP of qtox = 3.00.
Figure 3.
The analogues of Di(2-ethylhexyl) phthalate. The visualization shows the 10 analogues, or nearest neighbors, of Di(2-ethylhexyl) phthalate based on Morgan fingerprints and Jaccard similarity from ToxRefDB v2.0. The analogues are shown in a clockwise manner in descending order of Jaccard similarity, which is shown in red (as decimal numbers followed by a ‘c’).
Table 2.
Data used for calculating the systemic lowest observed adverse effect levels (LOAEL) for Di(2-ethylhexyl) phthalate using GenRA. The table shows the target chemical, Di(2-ethylhexyl) phthalate in the first row and the ten nearest neighbors in ToxRefDB 2 in descending order of similarity. The columns show the chemical name (Name), the DSSTox substance identifier (DSSTox SID), the Chemical Abstracts registry number (CAS RN), the molecular weight of the chemical (Mol Weight), the Jaccard similarity and the systemic LOAEL.
| Name | DSSTox SID | CAS RN | Mol Weight | Jaccard similarity | Systemic LOAEL |
|---|---|---|---|---|---|
| Di(2-ethylhexyl) phthalate | DTXSID5020607 | 117-81-7 | 390.564 | 1 (target) | 3.002148 |
| Bis(2-ethylhexyl) terephthalate | DTXSID7027625 | 6422-86-2 | 390.564 | 0.612245 | 2.812554 |
| Diisobutyl phthalate | DTXSID9022522 | 84-69-5 | 278.348 | 0.510638 | 2.666437 |
| Dibutyl phthalate | DTXSID2021781 | 84-74-2 | 278.348 | 0.489796 | 2.306154 |
| Dipentyl phthalate | DTXSID5031131 | 131-18-0 | 306.402 | 0.470588 | 4.805956 |
| Di(2-ethylhexyl) adipate | DTXSID0020606 | 103-23-1 | 370.574 | 0.461538 | 2.150474 |
| Diethyl phthalate | DTXSID7021780 | 84-66-2 | 222.24 | 0.456522 | 2.533993 |
| Dihexyl phthalate | DTXSID6025068 | 84-75-3 | 334.456 | 0.45283 | 2.621514 |
| Dioctyl phthalate | DTXSID1021956 | 117-84-0 | 390.564 | 0.436364 | 2.714783 |
| Picloram-isoctyl | DTXSID3039406 | 2695220-5 | 353.67 | 0.430769 | 3.111143 |
| 2,4-D 2-EHE | DTXSID4034235 | 1928-43-4 | 333.25 | 0.385714 | 4.045649 |
Performance evaluation
The prediction accuracy for a POD of each endpoint category across all chemicals was evaluated in local neighborhoods. For each endpoint category, linear regression was used to fit the predicted POD (ptox) and true POD (qtox) for all chemicals for k nearest neighbors (where the value of kranged from 1 to the maximum number of chemicals in the neighborhood), and with a similarity threshold, s (where the value of s ranged from the minimum to maximum values of s across all unique pairwise comparisons in the neighborhood). The coefficient of determination (R2) for the regression model was used as a measure of ‘global’ GenRA performance. Finally, Monte Carlo cross validation (MCCV) (Xu et al., 2004) was used to estimate confidence in R2 estimates. Briefly, 10% of the data for each endpoint category was randomly sampled (without replacement) as the holdout set to select targets. The remaining 90% of the dataset was used to search for source analogues for the chemicals in the holdout set. Performance of the holdout set predictions was calculated using R2. This process was repeated 100 times to estimate the variability in R2 for each endpoint category.
Performance evaluation in Local neighborhoods
In our previous work (Shah et al., 2016), we identified chemical structure-based clusters using an unsupervised K-means algorithm. As the set of chemicals analyzed in this work was the same, we used the same structure-based clusters that were identified previously. Briefly, we used K-means clustering to partition the chemicals based on structural similarity (defined by Morgan fingerprints and Jaccard index) and then used cluster stability analysis to identify the value of K for which the most reproducible clusters were identified. We found K=100 produced a statistically reliable and chemically meaningful set of clusters. Examples of these clusters included: pyrrolidones (cluster 3), cyclodienes (cluster 4), nitrobenzene-containing chemicals (cluster 5), and benzoylurea chemicals (cluster 16). The coefficient of determination (R2) for the regression model within structure-based clusters was used as a measure of ‘local’ GenRA performance. The membership of all chemicals in the clusters is provided as supplemental material (Table S3). Results and Discussion
Summary of toxicity data
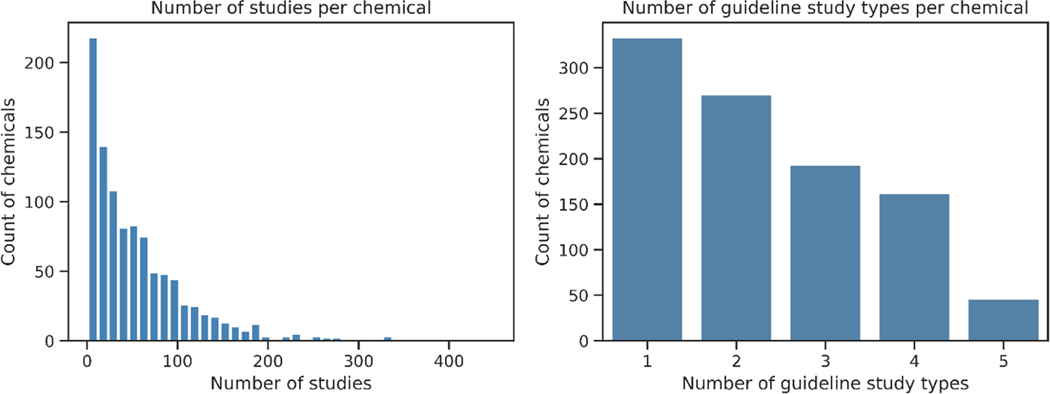
We identified 1,049 chemicals from ToxRefDB v2.0, each with an average of 27±22 (mean ± standard deviation) LOAEL values. The distributions of the number of studies per chemical, and the different types of guideline testing studies are shown in Figure 4. The contribution of the different types of guideline testing studies to the endpoint categories are given in Table 3. In all, there were 1041, 452, 488 and 85 unique chemicals with toxicity values for systemic toxicity, developmental toxicity, reproductive toxicity, and cholinesterase inhibition, respectively. While most chemicals (98.9%) had systemic toxicity values, only 7.9% of the chemicals had cholinesterase inhibition data.
Figure 4.
Distributions for the number of studies per chemical (left) and the number of guideline study types per chemical (right) in ToxRefDB v2.0.
Table 3.
The distribution of chemicals and lowest observed adverse effect level (LOAEL) values across guideline testing study types. The rows show the endpoint categories and the columns different type of guideline studies including: acute (ACU), chronic (CHR), developmental (DEV), multigenerational (MGR), neurotoxicity (NEU), other (OTH), reproductive (REP), sub-acute (SAC) and sub-chronic (SUB). Further details about these studies are available in ToxRefDB v2.0.
| Endpoint Category | ACU | CHR | DEV | DNT | MGR | NEU | OTH | REP | SAC | SUB |
|---|---|---|---|---|---|---|---|---|---|---|
| Cholinesterase inhibition | 65 (123) | 10 (10) | 17 (20) | 16 (17) | 2 (2) | 49 (69) | ||||
| Developmental effects | 391 (531) | 41 (54) | 149 (165) | 2 (2) | 12 (12) | 2 (2) | ||||
| Reproductive effects | 5 (5) | 297 (405) | 37 (42) | 146 (163) | 1 (1) | 2 (2) | 41 (53) | 13 (16) | 26 (32) | |
| Systemic effects | 3 (3) | 607 (1394) | 500 (831) | 92 (120) | 304 (339) | 10 (10) | 10 (13) | 65 (97) | 150 (418) | 569 (1099) |
GenRA ‘global’ predictions of POD
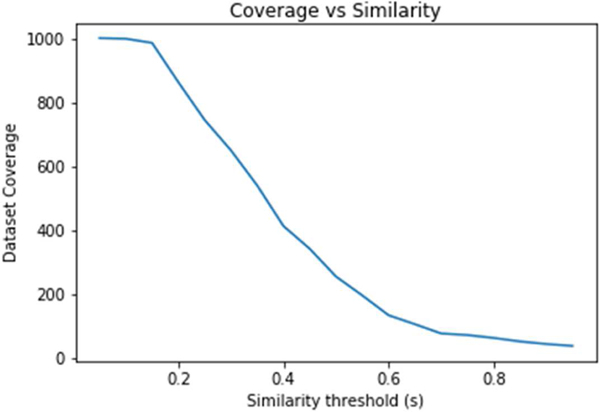
Out of 1,049 substances from ToxRefDB, 1014 could be mapped to chemical structures in the EPA CompTox Chemicals dashboard. We systematically analyzed the neighborhoods for each of the 1,014 chemicals to predict the POD for the four endpoint categories using GenRA. A key challenge for applying GenRA is identifying the optimal number of nearest neighbors (k) and the minimum similarity threshold (s) to accurately predict the POD. For low values of s, there are generally many potential source analogues but as the value of s increases, the number of analogues decreases. For high values of s, it may not be possible to make GenRA predictions as there may be insufficient (or no) source analogues that exceed the similarity threshold. The relationship between the number of chemicals for which POD values can be predicted using GenRA and the similarity threshold, which we call “coverage,” is shown in Figure 5. The coverage of the data set is 92.3% for low values of s (s=0.10) as most chemicals in the dataset have at least one source analogue. The coverage decreases rapidly as s increases to 12.6% at s=0.60. To establish a performance baseline for GenRA across this data set, we selected a low value of s=0.05 and k=10. These parameters ensure highly sensitive predictions, which may be relevant for data-poor chemicals with few structural analogues.
Figure 5.
Relationship between dataset coverage and the similarity threshold. The graph shows the number of chemicals in the dataset (y-axis), defined as the coverage for which there are analogues at a given level of Jaccard similarity threshold (x-axis). The dataset coverage decreases with an increasing similarity threshold.
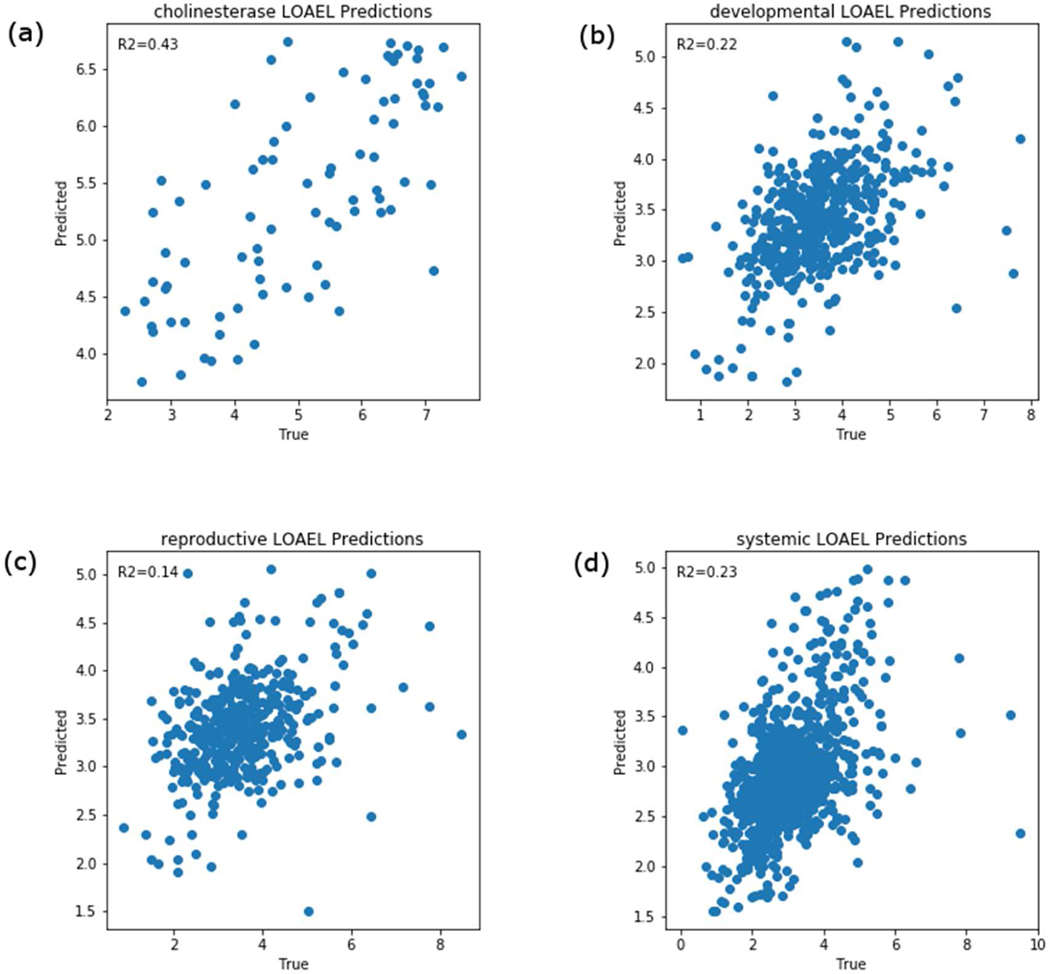
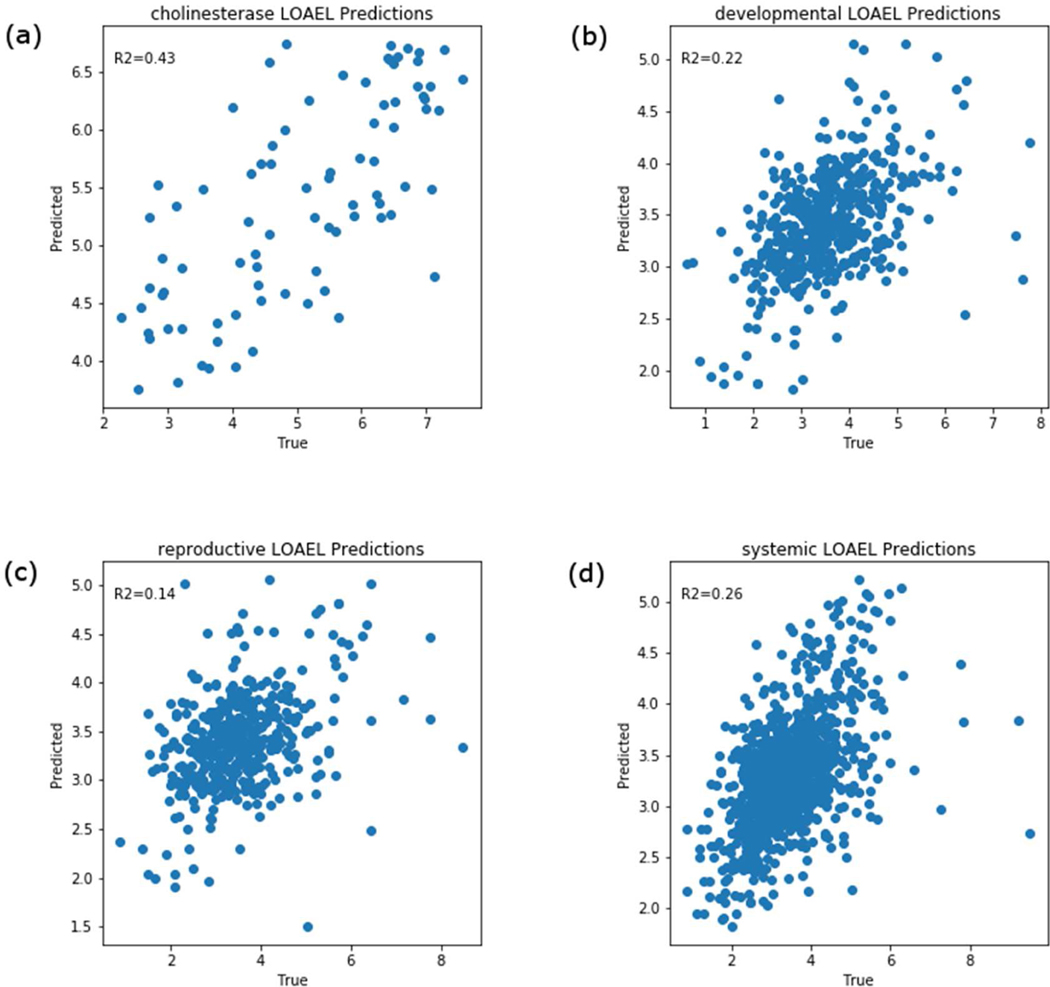
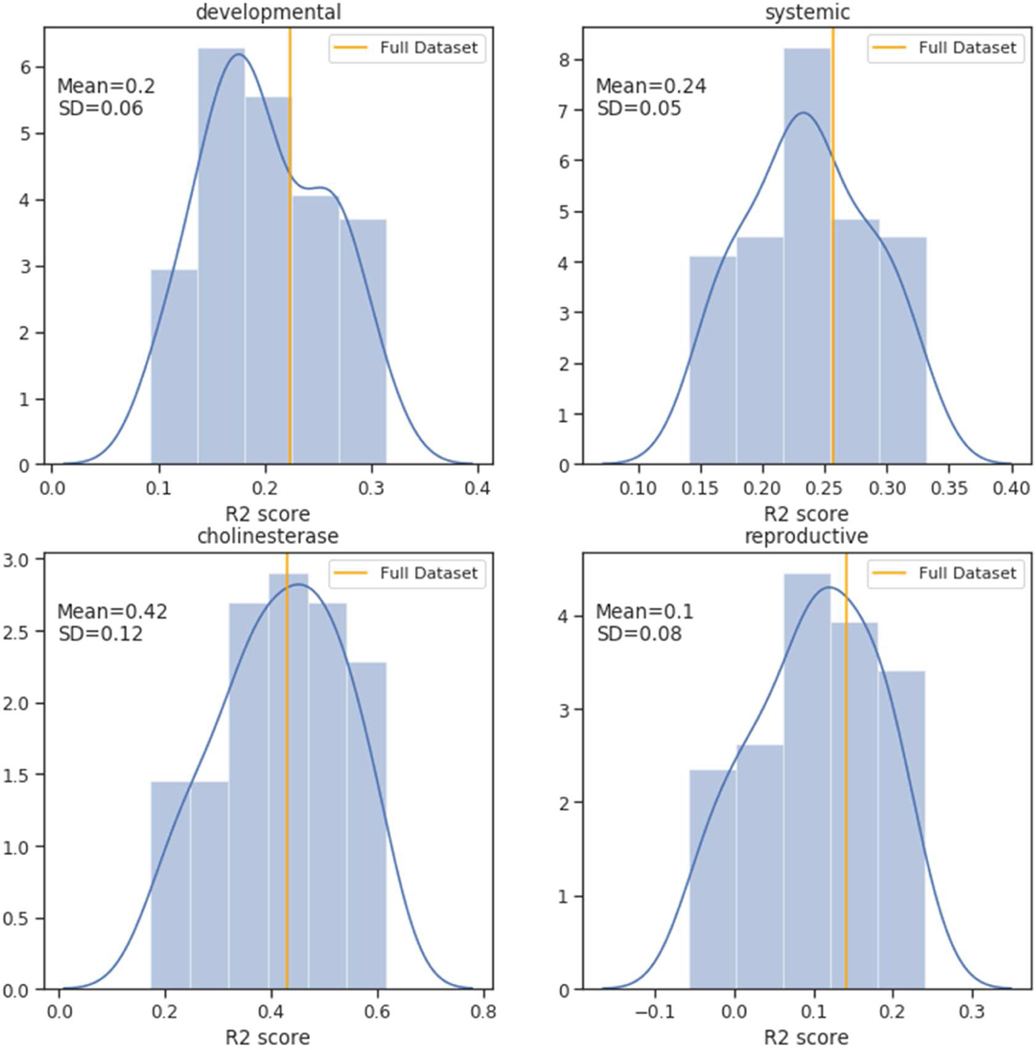
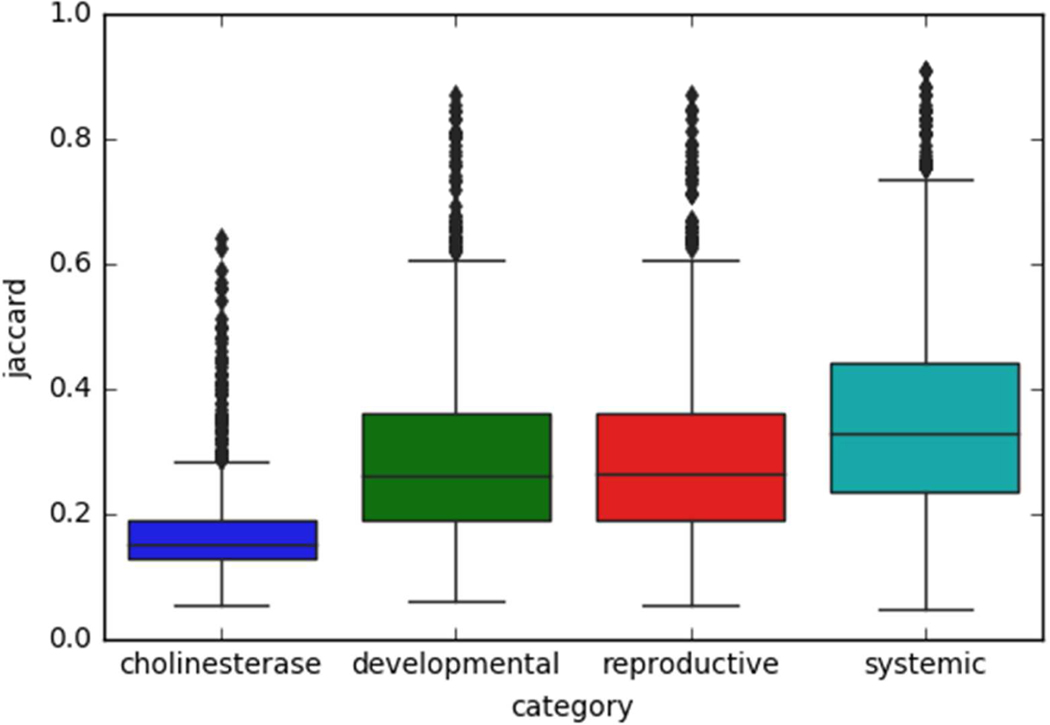
The GenRA prediction results for the LOAELs per chemical using s=0.05 and k=10 for the entire data set across the four endpoint categories are shown in Figures 6 and 7. As there could be multiple LOAEL values for each chemical for systemic toxicity (as we combined observations across multiple studies), we aggregated these as the minimum toxicity values. We found the R2 values for systemic toxicity, developmental toxicity, reproductive toxicity, and cholinesterase inhibition to be 0.23, 0.22, 0.14, and 0.43 respectively (Figure 6). Using the mean instead of the minimum of multiple toxicity values for each chemical had no impact on the results (see Figure 7) (R2 values for systemic effects, developmental effects, reproductive effects, and, cholinesterase inhibition to be 0.26, 0.22, 0.14, and 0.43, respectively). To evaluate confidence in GenRA POD predictions, we conducted cross-validation testing as described in Methods and the results are shown in Figure 8. As a result of the cross-validation testing analysis, the mean and standard deviation for R2 values for systemic toxicity, developmental toxicity, reproductive toxicity, and cholinesterase inhibition were 0.25±0.06, 0.21±0.07, 0.14±.09, and 0.42±0.17, respectively. The means of R2 values for subsamples of the data were found to be close to the entire dataset. However, there was considerable variability in R2 values for developmental, reproductive and cholinesterase endpoints. We suspect the variability can be attributed in part to insufficient data for developmental, reproductive, and cholinesterase endpoints, which makes it difficult to find appropriate source analogues to make accurate predictions. This is supported by the relationship between the average Jaccard similarity between the first 2 neighbors for each target chemical by endpoint category (Figure 9), where the median Jaccard similarity appears slightly higher for systemic toxicity-related information versus cholinesterase, developmental, and reproductive information. Figure 9 also shows that the endpoint categories with fewer chemicals generally have a smaller number of similar neighbors on average. Overall, GenRA POD predictions for systemic LOAELs had the greatest cross-validation performance and least variability, possibly due to a greater frequency of observed PODs available for systemic effects, such as changes in body or target organ weight, within ToxRefDB v2.0.
Figure 6.
GenRA predictions of the minimum aggregated lowest observed adverse effect levels (LOAELs) for (a) cholinesterase inhibition, (b) developmental effects, (c) reproductive effects and (d) systemic effects. The predictions are based on k=10 (analogues) and s=0.05 (Jaccard similarity threshold). Each scatterplot shows GenRA predictions (y-axis) and the true minimum aggregated LOAEL values in units of log10 molar of the daily mg/kg/day dose. The coefficient of determination (R2) values for GenRA predictions are shown in each plot.
Figure 7.
GenRA predictions of the mean aggregated lowest observed adverse effect levels (LOAELs) for (a) cholinesterase inhibition, (b) developmental effects, (c) reproductive effects and (d) systemic effects. The predictions are based on k=10 (analogues) and s=0.05 (Jaccard similarity threshold). Each scatterplot shows GenRA predictions (y-axis) and the true mean aggregated LOAEL values in units of log10 molar of the daily mg/kg/day dose. The coefficient of determination (R2) values for GenRA predictions are shown in each plot.
Figure 8.
GenRA cross-validation performance scores by endpoint category for mean aggregated LOAEL values. Each graph shows the distribution of the coefficient of determination (R2) scores (x-axis) for GenRA predictions based on k=10 and s=0.05, which were calculated using 100 cross-validation testing trials using a 90% training and 10% testing split of the data. The distributions are as visualized as histograms and smoothed density plots, and the performance of the full data set is shown for comparison (orange vertical line). The mean and standard deviation of performance scores are also shown on each graph.
Figure 9.
Similarity between target and source analogues by endpoint category. The distributions of the average Jaccard similarity (y-axis) between the target and first two source analogues are visualized as boxplots by endpoint category (x-axis).
Tuning GenRA parameters to improve ‘global’ performance
Although the cross validation R2 values were relatively low (ranging from 0.14–0.43), it is important to note that these performance scores summarize the accuracy for nearly the entire dataset, including those target chemicals without very similar (s<0.1) source analogues. For comparison, (Helman et al., 2019a) reported cross validation R2 values of 0.43–0.6 when applying a similar read-across approach to a dataset of 988 chronic LOAEL values for 671 unique chemicals. Wignall et al. (2018) reported Q2 between 0.2 and 0.45 for random forest regression QSAR models modelling toxicity values. Using parameter values s=0.05 and k=10, GenRA achieved 92.3% database coverage producing highly sensitive predictions of POD. Next, we attempted to improve the performance of GenRA by tuning the parameters, k and s using grid search. Grid search systematically explores a predefined range of values for k and s to find the best performing (optimal) combination. While tuning the parameters, we also considered two possible interpretations of the parameter k including: searching for up to k source analogues and searching for exactly k source analogues. In all, we systematically evaluated 800 different combinations of k and s including: the two interpretations of k, 20 values of k (1≤k≤20 in increments of 1), and 20 values of s (0.05≤s≤1 in increments of 0.05).
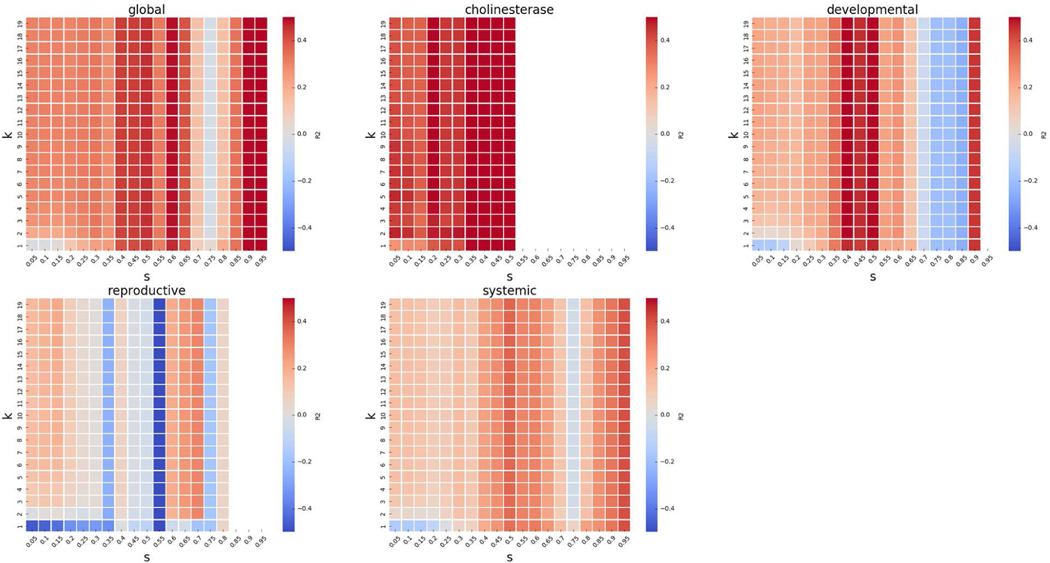
The results of the grid search for up to k source analogues can be found in Figure 10. We can see in the figures that the main factor determining the performance is the similarity threshold, and the predictions do not vary dramatically with respect to k. This is because we are searching for up to k source analogues, so increasing k only adds new source analogues to our predictions, and those new source analogues will have less Jaccard similarity, and therefore have less of an impact on the prediction.
Figure 10.
GenRA performance for mean aggregated LOAEL for up to k neighbours. The performance of GenRA calculated as the coefficient of determination (R2) for up to k analogues and Jaccard similarity score thresholds (s) is visualized as heatmaps for the entire dataset (global), cholinesterase inhibition, developmental effects, reproductive effects, and systemic effects. On each heatmap, increasing values of k (0<k<30) are shown in the rows (from bottom to top), and increasing values of s (0<s<1) are shown in the columns (from left to right). The color of each cell corresponds to the R2 value for a specific hyperparameter (k,s) combination where the red/blue indicate high/low R2 values.
We also observed high variability in performance scores for s>0.6, which we suspect to be due to an insufficient number of chemicals. This is because the number of source analogues and target chemicals available for prediction decreases as the similarity threshold is increased (see Figure 5). Thus, when there are very few chemicals available for prediction in the grid search then there can be considerable variability in predictive performance between adjacent values of k and s.
Globally across endpoint categories, we see a gradual increase in performance with increasing values of s until s=0.65 and then a decrease in performance (supplemental material Figure S4). This decrease in performance mainly occurs because there are similar decreases in performance for both the systemic and developmental effects. Performance for the reproductive effects has inflection points in the relationship between k and s, with decreased performances at both s=0.25 and again at s=0.4. For chemicals that produced reproductive effects (Figure S4), we found GenRA performed better when there were at least two or more source analogues. It is worth noting that reproductive predictions have poor performance across the grid search to begin with, being the worst performing of all four categories. For systemic, reproductive, and developmental categories, performance trends upward sharply for high values of s. Lastly, sufficient data do not currently exist for the cholinesterase inhibition category to produce confidence in the performance trend for high values of s (as this may be a result of instability caused by lack of data).
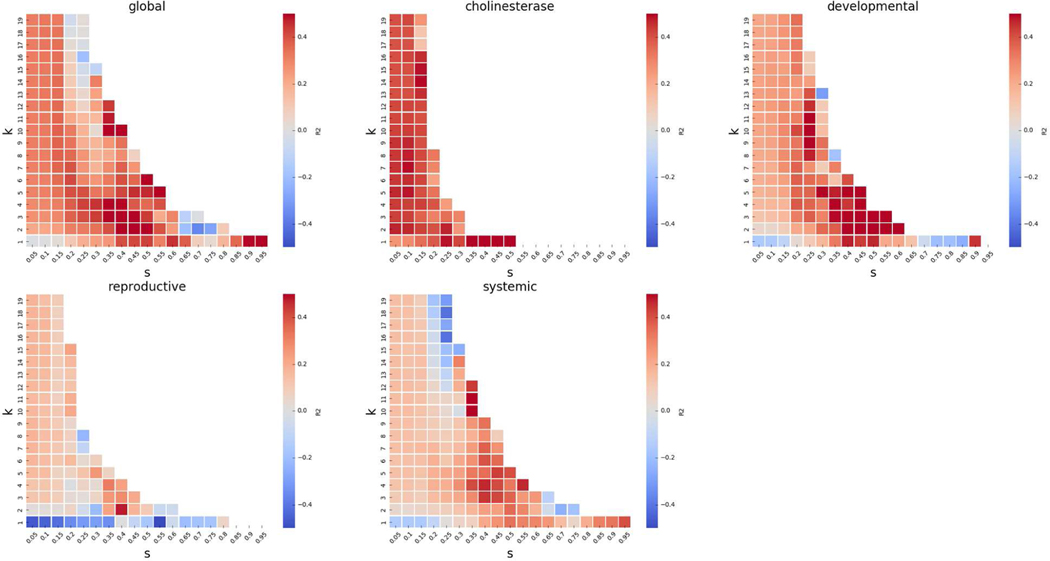
The results of the grid search for exactly k source analogues can be found in Figure 11. Note that because we are searching for exactly k source analogues, the amount of data at each point (i.e. each value of k and s) in the grid search is lesser than when searching for up to k analogues. For the sake of clarity, we only show points in the grid search where we were able to predict for more than 10 chemicals.
Figure 11.
GenRA performance for mean aggregated LOAEL values for exactly k neighbours. The performance of GenRA calculated as the coefficient of determination (R2) for exactly k analogues and Jaccard similarity score thresholds (s) is visualized as heatmaps for the entire dataset (global), cholinesterase inhibition, developmental effects, reproductive effects, and systemic effects. On each heatmap, increasing values of k (0<k<30) are shown in the rows (from bottom to top), and increasing values of s (0<s<1) are shown in the columns (from left to right). The color of each cell corresponds to the R2 value for a specific hyperparameter (k,s) combination where the red/blue indicate high/low R2 values.
We see more interesting variations between endpoint categories when conducting a grid search for k and s using exactly k analogues. The performance of GenRA for cholinesterase inhibition (Figure 10) is best when it has a single source analogue (k=1) and at least 0.45 similarity (s≥0.45). GenRA performance for developmental and reproductive effects is best with 2 source analogues (k=2), with at least 0.4 and 0.5 Jaccard similarity respectively. On the other hand, GenRA predictions for systemic toxicity were optimal when there were 10 source analogues (k=10) with at least 0.35 similarity (s≥0.35). Since systemic toxicity represents most of our data, we believe that a choice of k=10 may be considered a reasonable default value for GenRA.
GenRA ‘local’ predictions of POD
One of the unique features of GenRA is that it uses local validity domains to identify the optimal number of source analogues and similarity threshold to predict LOAEL values for different in vivo effects. However, aggregating these predictions globally, i.e. across all chemicals, results in performance scores that are relatively low. We were interested in identifying local chemical structural neighborhoods in which POD values could be quantitatively and accurately predicted by GenRA. We attempted to identify such structural neighborhoods by partitioning a large set of chemicals by similarity into 100 clusters (Shah et al., 2016). Next, we used chemicals in these 100 clusters to investigate the ‘local’ performance of GenRA for predicting LOAEL values. Since a cluster represents a structurally-related group of chemicals, we considered this a ‘local’ vs a ‘global’ analysis of predictive performance for GenRA.
The local predictions of GenRA used only chemicals in a cluster as the targets to predict the LOAEL values for each endpoint category using all chemicals as potential source analogues. Unlike the global analysis, the performance of the local analysis was calculated based on a linear regression between the predicted and measured LOAEL values for only the chemicals in each cluster (and reported as R2 scores). GenRA local predictions of endpoint categories were only made for clusters in which chemicals had at least two source analogues with LOAEL values.
We used a grid search to find the optimal values of k and s for each cluster and endpoint category. The values of k, s resulting in the maximum R2 values for GenRA predictions for each endpoint category and cluster are provided as supplemental material Table S5. Overall, we found 36/100 clusters in which the local GenRA predictions performed better than the global prediction by endpoint categories. These 36 clusters include 22% (222/1014) of all chemicals and their performance scores are shown in Table 4. The average R2 values for systemic, developmental, reproductive effects and cholinesterase inhibition for these 36 clusters were 0.73, 0.66, 0.60 and 0.79, respectively.
Table 4.
GenRA predictive performance for clusters. The table shows the clusters (rows) for which the GenRA performance improved for systemic, developmental, reproductive effects and cholinesterase inhibition (columns). The performance is reported using coefficient of determination (R2) followed by number of analogues (k), similarity threshold (s) and number of chemicals in the cluster for the endpoint category (n). The final row shows the mean ± standard deviation of R2 values for each endpoint category.
| Cluster | Systemic effect | Developmental effect | Reproductive effect | Cholinesterase inhibition |
|---|---|---|---|---|
| 0 | 0.75 (k=19,s=0.10,n=3) | |||
| 1 | 0.64 (k=2,s=0.30,n=4) | 0.31 (k=2,s=0.05,n=10) | ||
| 3 | 0.84 (k=1,s=0.05,n=2) | |||
| 4 | 1.00 (k=1,s=0.30,n=2) | |||
| 5 | 0.88 (k=3,s=0.45,n=2) | 0.28 (k=7,s=0.05,n=7) | ||
| 6 | 0.84 (k=5,s=0.05,n=3) | 0.69 (k=3,s=0.15,n=3) | ||
| 7 | 0.73 (k=1,s=0.70,n=6) | 0.95 (k=1,s=0.65,n=4) | 0.76 (k=7,s=0.20,n=2) | |
| 10 | 0.92 (k=3,s=0.35,n=2) | 0.77 (k=3,s=0.25,n=2) | 0.94 (k=2,s=0.05,n=3) | |
| 16 | 0.41 (k=3,s=0.20,n=3) | |||
| 18 | 0.56 (k=2,s=0.05,n=3) | |||
| 19 | 0.76 (k=1,s=0.35,n=3) | 0.50 (k=5,s=0.05,n=2) | ||
| 20 | 0.43 (k=13,s=0.05,n=4) | |||
| 21 | 0.44 (k=1,s=0.40,n=5) | |||
| 24 | 0.38 (k=3,s=0.05,n=5) | |||
| 25 | 0.86 (k=2,s=0.05,n=9) | 0.97 (k=12,s=0.15,n=2) | 0.86 (k=1,s=0.05,n=2) | |
| 28 | 0.62 (k=3,s=0.30,n=2) | |||
| 31 | 0.48 (k=3,s=0.40,n=2) | 0.24 (k=13,s=0.20,n=3) | 0.77 (k=5,s=0.20,n=6) | 0.52 (k=9,s=0.05,n=2) |
| 35 | 0.84 (k=4,s=0.35,n=18) | 0.98 (k=6,s=0.40,n=2) | 0.87 (k=4,s=0.30,n=2) | 0.85 (k=1,s=0.35,n=8) |
| 37 | 0.34 (k=3,s=0.05,n=2) | |||
| 53 | 0.91 (k=19,s=0.15,n=3) | |||
| 55 | 0.68 (k=1,s=0.90,n=2) | 0.73 (k=1,s=0.30,n=7) | 0.54 (k=4,s=0.25,n=5) | 0.98 (k=8,s=0.05,n=3) |
| 56 | 0.73 (k=1,s=0.05,n=4) | |||
| 58 | 0.72 (k=13,s=0.05,n=2) | |||
| 59 | 0.48 (k=6,s=0.20,n=4) | 0.37 (k=19,s=0.15,n=2) | ||
| 60 | 0.33 (k=11,s=0.05,n=2) | |||
| 63 | 0.84 (k=1,s=0.05,n=2) | |||
| 67 | 0.33 (k=14,s=0.15,n=6) | |||
| 75 | 0.34 (k=10,s=0.15,n=4) | 0.78 (k=9,s=0.15,n=4) | ||
| 76 | 0.76 (k=3,s=0.55,n=2) | 0.86 (k=2,s=0.20,n=3) | ||
| 77 | 0.67 (k=1,s=0.05,n=7) | 0.60 (k=2,s=0.20,n=4) | 0.62 (k=3,s=0.05,n=3) | |
| 78 | 0.34 (k=2,s=0.40,n=2) | |||
| 79 | 0.38 (k=1,s=0.05,n=7) | 0.54 (k=1,s=0.05,n=3) | ||
| 85 | 0.79 (k=2,s=0.25,n=2) | |||
| 86 | 0.95 (k=2,s=0.25,n=2) | 0.96 (k=7,s=0.05,n=2) | ||
| 96 | 0.65 (k=16,s=0.20,n=6) | |||
| 97 | 0.65 (k=15,s=0.15,n=4) | 0.50 (k=10,s=0.15,n=2) | 0.88 (k=3,s=0.15,n=2) | |
| Summary | 0.73 ± 0.16 | 0.66 ± 0.22 | 0.60 ± 0.24 | 0.79 ± 0.20 |
We discuss some illustrative examples of local GenRA predictions. For example, local GenRA prediction accuracy exceeded global accuracy for systemic, developmental, reproductive effects and cholinesterase inhibition for clusters 5, 7, 25 respectively (performance improved for multiple endpoints for some clusters). Cluster 5 includes thirty chemicals, a majority of which contain either a nitrobenzene or a nitrofuran moiety. Toxicity data were available for some of the chemicals in this cluster including: 3-nitrotoluene, 4-nitroaniline, 4-nitrobenzoic acid, 4-nitrophenol, 4-nitrotoluene, nitrofurantoin, nitrofurazone, norflurazon, methyl parathion and parathion. The range of LOAEL values for chemicals in this cluster were 0.0079–0.03 mg/kg/day for cholinesterase inhibition, 2–160 mg/kg/day for developmental toxicity, 20–2400 mg/kg/day for reproductive toxicity and 0.21–400 mg/kg/day for systemic toxicity. GenRA predicted reproductive and systemic toxicity LOAEL values with R2=0.28 (k=7, s=0.05) and R2=0.88 (k=3, s=0.45), respectively. The results of grid search for optimal values of k and s for this cluster show that reproductive toxicity could either be predicted using 7 source analogues with low similarity (0.05≤s≤0.15) or just using a single source analogue with higher similarity (0.25≤s≤0.35). The predictive accuracies for reproductive toxicity (R2=−2) and cholinesterase inhibition (R2=0.07) were lower than the global performance (Table S5). Although methyl parathion and parathion are potent cholinesterase inhibitors (Diggle and Gage, 1951), the absence of other source analogues with this toxic activity made it difficult for GenRA to accurately predict LOAEL values.
Cluster 7 contains a diverse group of 35 polyols and ethers out of which 13 chemicals had toxicity data including: 2-(2-butoxyethoxy)ethanol, 2-(2-ethoxyethoxy)ethanol, 2-butoxyethanol, 2-ethoxyethanol, 5-ethyl-1-aza-3,7-dioxabicyclo[3.3.0]octane, bis(2-methoxyethyl) ether, diethylene glycol, diethylene glycol monomethyl ether, dinotefuran, piperonyl butoxide, tepraloxydim, triethylene glycol and triethylene glycol dimethyl ether. The range of LOAEL values for chemicals in this cluster were 120–11260 mg/kg/day for developmental toxicity, 175–5175 mg/kg/day for reproductive toxicity and 3–2795 mg/kg/day for systemic toxicity. GenRA predicted developmental, reproductive and systemic toxicity LOAEL values with R2=0.95 (k=1, s=0.65), R2= 0.76 (k=7, s=0.20) and R2=0.73 (k=1, s=0.70), respectively. Grid search analysis results showed substantial variation in the predictive performance for different numbers of source analogues and similarity threshold across the endpoint categories. For reproductive toxicity, GenRA performance was poor (R2<0) for less than seven source analogues (k<7) and for s<0.15, but the performance was reasonable (R2>0) for a narrow range of k (6<k<12) and s (0.1<s<0.25). The converse was true for GenRA performance for developmental toxicity LOAEL values: most values of k and s produced reasonable predictions (R2>0), some range of k and s values produced poor predictions (R2<0) and a single source analogue with s=0.65 produced the best prediction. Polyols are known for their reproductive (Prooije et al., 1996) and developmental (Canimoglu and Rencuzogullari, 2013) effects.
Cluster 25 represents another group of 60 chemical including mostly linear alkanes and 9/60 had toxicity data. The median LOAEL values for chemicals in this cluster were 250 mg/kg/day for cholinesterase inhibition, 20 mg/kg/day for developmental toxicity, 16 mg/kg/day for reproductive toxicity and 58 mg/kg/day for systemic toxicity. GenRA predicted cholinesterase inhibition, reproductive and systemic toxicity LOAEL values with R2= 0.86 (k=1, s=0.05), R2= 0.97 (k=12, s=0.15) and R2= 0.86 (k=2, s=0.05), respectively. As with our previous analysis of grid search for optimal values of k and s, there was considerable variation in the predictive performance of GenRA between toxicity endpoints. Cholinesterase inhibition was predicted most accurately for the best source analogue, reproductive toxicity was predicted poorly (R2<0) for all but k=12 and s=0.15, and systemic toxicity could be predicted reasonably (R2>0) for most values of k and s with some exceptions. While GenRA local predictions of LOAEL values for the endpoint categories for 36% of the clusters exceeded the global accuracy, the performance was either lower than the global accuracy or could not be calculated for the remaining 64% of clusters (due to the lack of data).
Conclusions
We developed GenRA to investigate the feasibility of data driven approaches to augment the current practice of read-across, which is expert-driven in nature and does not readily scale to thousands of chemicals. GenRA used a dataset of 1,014 chemicals, 2,048 chemical descriptors, and Jaccard similarity scores to define local validity domains, and then applied similarity weighted activity to estimate LOAEL values using source analogues. Our analysis estimated the ‘global’ performance of GenRA (using mean aggregated LOAEL values) for predicting systemic effects, developmental effects, reproductive effects, and cholinesterase inhibition with R2 values of 0.26, 0.22, 0.14, and 0.43 respectively. This performance is comparable with recent published works such as studies by Helman et al. (Helman et al., 2019a) and Wignall et al. (Wignall et al., 2018). In contrast, the local performance of GenRA, based on structurally-related clusters of chemicals, improved the average R2 for systemic effects, developmental effects, reproductive effects, and cholinesterase inhibition to 0.73, 0.66, 0.60 and 0.79, respectively. Our development of GenRA version 2.0 supports the notion that local validity domains can be identified computationally in large-scale databases and simple predictive approaches (i.e. similarity weighted activity) can be useful for accurately predicting POD values.
The global prediction results show that overall, it is difficult to accurately predict LOAEL values for different toxicological effects using similarity weighted activity (the algorithm used in GenRA). Even optimizing the performance of GenRA by systematically searching for different numbers of source analogues and similarity thresholds did not improve predictive performance substantially. However, evaluation of performance within chemical clusters demonstrated that LOAEL values can be predicted more accurately than the global prediction identified. Though computationally identified clusters do not correspond to formal chemical categories, they may serve as a useful starting point for local structural domains with which to predict PODs for untested chemicals.
The performance of ‘local’ GenRA LOAEL predictions for in vivo effects, and the choice of optimal parameters k and s was highly dependent upon the chemical clusters. In other words, the performance results depend on the selection of chemicals in clusters, and the nature of in vivo data that are available for them. The choice of specific chemicals defines the context for read-across and determines the subsequent read-across inferences that can be made. This context-dependence is consistent with our evaluation of hazard predictions using GenRA (Shah et al, 2016), and it also agrees with current approaches for analogue identification and evaluation (Patlewicz, 2018). Like all nearest-neighbor approaches, GenRA predictions depend on the source analogues and the extent of data available for them: if source analogues change so do the predictions. Nevertheless, we believe that it is important to use automated techniques to group chemicals in the large-scale chemical landscape to identify regions where GenRA can (or cannot) confidently predict LOAEL values for specific toxicologically-relevant effects. Here, we have investigated only chemical structure descriptors for defining such regions, but it may be important to also consider physico-chemical properties (Helman et al, 2018), metabolism and in vitro bioactivity (as discussed in Patlewicz et al, 2018).
Prediction accuracy depends on the amount of available data. The global performance for different endpoint categories (R2) is roughly proportional to the number of chemicals with LOAEL values for each category. The distribution of chemicals across these effect types is partly due to nature of the underlying assays but depends more on the approach used for aggregating the data. For example, our analysis used a specific aggregation of the LOAEL data for each chemical across diverse study types into four toxicologically-relevant categories: neurotoxic effects (i.e. cholinesterase inhibition), reproductive effects, developmental effects and systemic effects. Using a different aggregation scheme, e.g. one that captures the effects by target organ, or differentiates between study types, would produce different LOAEL values and will result in different predictive accuracies. We plan to systematically compare the impact of alternative aggregation schemes on performance.
We generalized the ideas of similarity weighted activity proposed by Low et al (Low et al, 2013) as a simple starting point for a predictive algorithm because it is readily interpretable by domain experts. The first version of GenRA used multiple chemical structure and in vitro bioactivity descriptors to predict hazard classifications (true or false) using repeat-dose in vivo testing data from ToxRefDB v1.0 (Shah et al, 2016, Martin et al, 2010). To facilitate the interactive use of GenRA by domain experts, we have also implemented a web-based version of the tool (Helman et al., 2019b) in the EPA CompTox Chemicals dashboard (Williams et al., 2017). Here we have described the next major version of GenRA v2.0 in which we predict POD values quantitatively based on the most recent and augmented ToxRefDB v2.0 (Watford et al., 2019). In future work we will implement this functionality into the GenRA web-based tool to enable interactive prediction of hazard and POD for untested chemicals.
Supplementary Material
Highlights.
GenRA uses similarity-weighted activity to automate read-across predictions
GenRA now quantitatively predicts lowest observed adverse effect levels (LOAELs)
LOAEL predictions evaluated by cross-validation and reported as R2 scores
Chemical clusters identified where GenRA quantitative predictions are accurate
Quantitative GenRA can automatically predict point of departure (POD) values
Footnotes
Competing financial interests: The authors declare they have no actual or potential competing financial interests
Disclaimer: The views expressed in this article are those of the authors and do not necessarily represent the views or policies of the U.S. Environmental Protection Agency.
References
- Basant N, Gupta S, Singh KP, 2016. QSAR modeling for predicting reproductive toxicity of chemicals in rats for regulatory purposes. Toxicol. Res. (Camb). 5, 1029–1038. 10.1039/c6tx00083e [DOI] [PMC free article] [PubMed] [Google Scholar]
- Bhattacharya S, Shoda LKM, Zhang Q, Woods CG, Howell BA, Siler SQ, Woodhead JL, Yang Y, McMullen P, Watkins PB, Andersen ME, 2012. Modeling Drug- and Chemical-Induced Hepatotoxicity with Systems Biology Approaches. Front. Physiol. 3, 462. 10.3389/fphys.2012.00462 [DOI] [PMC free article] [PubMed] [Google Scholar]
- Bodenreider O, 2003. The Unified Medical Language System (UMLS): integrating biomedical terminology. Nucleic Acids Res. 32, 267D–270. 10.1093/nar/gkh061 [DOI] [PMC free article] [PubMed] [Google Scholar]
- Canimoglu S, Rencuzogullari E, 2013. The genotoxic and teratogenic effects of maltitol in rats. Toxicol. Ind. Health 29, 935–943. 10.1177/0748233712446727 [DOI] [PubMed] [Google Scholar]
- DeWoskin RS, Knudsen TB, Shah I, 2014. Virtual Models (vM), Encyclopedia of Toxicology: Third Edition. 10.1016/B978-0-12-386454-3.01059-9 [DOI] [Google Scholar]
- Diggle WM, Gage JC, 1951. Cholinesterase inhibition by parathion in vivo. Nature 168, 998. 10.1038/168998a0 [DOI] [PubMed] [Google Scholar]
- EC, 2006. Regulation (EC) No 1907/2006. Off. J. Eur. Union l396/1. [Google Scholar]
- ECCC/HC, 2016. Chemicals Management Plan. H. C. Environment and Climate Change. Ottowa, Ontario. [Google Scholar]
- EPA, 2018. Strategic Plan to Promote the Development and Implementation of Alternative Test Methods [WWW Document]. URL https://www.regulations.gov/document?D=EPA-HQ-OPPT-2017-0559-0584
- EPA, 2008. Overview: Office of Pollution Prevention and Toxics Laws and Programs [WWW Document]. URL https://archive.epa.gov/oppt/pubs/oppt101_tscalaw_programs_2008.pdf (accessed 1.21.18).
- Harrill J, Shah I, Setzer RW, Haggard D, Auerbach S, Judson R, Thomas RS, 2019. Considerations for Strategic Use of High-Throughput Transcriptomics Chemical Screening Data in Regulatory Decisions. Curr. Opin. Toxicol. 10.1016/J.COTOX.2019.05.004 [DOI] [PMC free article] [PubMed] [Google Scholar]
- Helman G, Shah I, Patlewicz G, 2019a. Transitioning the generalised read-across approach (GenRA) to quantitative predictions: A case study using acute oral toxicity data. Comput. Toxicol. 12, 100097. 10.1016/J.COMTOX.2019.100097 [DOI] [PMC free article] [PubMed] [Google Scholar]
- Helman G, Shah I, Patlewicz G, 2018. Extending the Generalised Read-Across approach (GenRA): A systematic analysis of the impact of physicochemical property information on read-across performance. Comput. Toxicol. 8. 10.1016/j.comtox.2018.07.001 [DOI] [PMC free article] [PubMed] [Google Scholar]
- Helman G, Shah I, Williams AJ, Edwards J, Dunne J, Patlewicz G, 2019b. Generalized Read-Across (GenRA): A workflow implemented into the EPA CompTox Chemicals Dashboard. ALTEX. 10.14573/altex.1811292 [DOI] [PMC free article] [PubMed] [Google Scholar]
- Houck KA, Richard AM, Judson RS, Martin MT, Reif DM, Shah I, 2013. ToxCast: Predicting Toxicity Potential Through High-Throughput Bioactivity Profiling, High-Throughput Screening Methods in Toxicity Testing. 10.1002/9781118538203.ch1 [DOI] [Google Scholar]
- Kavlock RJ, Bahadori T, Barton-Maclaren TS, Gwinn MR, Rasenberg M, Thomas RS, 2018. Accelerating the Pace of Chemical Risk Assessment. Chem. Res. Toxicol. 31, 287–290. 10.1021/acs.chemrestox.7b00339 [DOI] [PMC free article] [PubMed] [Google Scholar]
- Landrum G, 2015. RDKit: Open-Source Cheminformatics Software. [Google Scholar]
- Low Y, Sedykh A, Fourches D, Golbraikh A, Whelan M, Rusyn I, Tropsha A, 2013. Integrative Chemical–Biological Read-Across Approach for Chemical Hazard Classification. Chem. Res. Toxicol. 26, 1199–1208. 10.1021/tx400110f [DOI] [PMC free article] [PubMed] [Google Scholar]
- Luechtefeld T, Marsh D, Rowlands C, Hartung T, 2018. Machine learning of toxicological big data enables read-across structure activity relationships (RASAR) outperforming animal test reproducibility. Toxicol. Sci. 165, 198–212. 10.1093/toxsci/kfy152 [DOI] [PMC free article] [PubMed] [Google Scholar]
- OECD, 2017. Guidance on Grouping of Chemicals, Second Edition, OECD Series on Testing and Assessment. OECD. 10.1787/9789264274679-en [DOI] [Google Scholar]
- OECD, 2004. The report from the expert group on (Quantitative) Structure-Activity Relationships [(Q)SARs] on the principles for the validation of (Q)SARs. [Google Scholar]
- Patlewicz G, Helman G, Pradeep P, Shah I, 2017. Navigating through the minefield of read-across tools: A review of in silico tools for grouping. Comput. Toxicol. 3. 10.1016/j.comtox.2017.05.003 [DOI] [PMC free article] [PubMed] [Google Scholar]
- Prooije AES, Waalkens-Berendsen DH, Bär A, 1996. Embryotoxicity and Teratogenicity Study with Erythritol in Rats. Regul. Toxicol. Pharmacol. 24, S232–S236. 10.1006/RTPH.1996.0103 [DOI] [PubMed] [Google Scholar]
- Rogers D, Hahn M, 2010. Extended-Connectivity Fingerprints. J. Chem. Inf. Model. 50, 742–754. 10.1021/ci100050t [DOI] [PubMed] [Google Scholar]
- Rupp B, Appel KE, Gundert-Remy U, 2010. Chronic oral LOAEL prediction by using a commercially available computational QSAR tool. Arch. Toxicol. 84, 681–688. 10.1007/s00204-010-0532-x [DOI] [PubMed] [Google Scholar]
- Sahigara F, Mansouri K, Ballabio D, Mauri A, Consonni V, Todeschini R, 2012. Comparison of different approaches to define the applicability domain of QSAR models. Molecules 17, 4791–4810. 10.3390/molecules17054791 [DOI] [PMC free article] [PubMed] [Google Scholar]
- Shah I, Liu J, Judson RS, Thomas RS, Patlewicz G, 2016. Systematically evaluating read-across prediction and performance using a local validity approach characterized by chemical structure and bioactivity information. Regul. Toxicol. Pharmacol. 79, 12–24. 10.1016/j.yrtph.2016.05.008 [DOI] [PubMed] [Google Scholar]
- Shah I, Wambaugh J, 2010. Virtual tissues in toxicology. J. Toxicol. Environ. Heal. - Part B Crit. Rev. 13, 314–328. 10.1080/10937404.2010.483948 [DOI] [PubMed] [Google Scholar]
- Thomas RS, Bahadori T, Buckley TJ, Cowden J, Deisenroth C, Dionisio KL, Frithsen JB, Grulke CM, Gwinn MR, Harrill JA, Higuchi M, Houck KA, Hughes MF, Hunter ES, Isaacs KK, Judson RS, Knudsen TB, Lambert JC, Linnenbrink M, Martin TM, Newton SR, Padilla S, Patlewicz G, Paul-Friedman K, Phillips KA, Richard AM, Sams R, Shafer TJ, Setzer RW, Shah I, Simmons JE, Simmons SO, Singh A, Sobus JR, Strynar M, Swank A, Tornero-Valez R, Ulrich EM, Villeneuve DL, Wambaugh JF, Wetmore BA, Williams AJ, 2019. The next generation blueprint of computational toxicology at the U.S. Environmental Protection Agency. Toxicol. Sci. 10.1093/toxsci/kfz058 [DOI] [PMC free article] [PubMed] [Google Scholar]
- Venkatapathy R, Wang NCY, 2013. Developmental Toxicity Prediction, in: Methods in Molecular Biology (Clifton, N.J.). pp. 305–340. 10.1007/978-1-62703-0595_14 [DOI] [PubMed] [Google Scholar]
- Wambaugh J, Shah I, 2010. Simulating microdosimetry in a virtual hepatic lobule. PLoS Comput. Biol. 6. 10.1371/journal.pcbi.1000756 [DOI] [PMC free article] [PubMed] [Google Scholar]
- Watford S, Ly Pham L, Wignall J, Shin R, Martin MT, Friedman KP, 2019. ToxRefDB version 2.0: Improved utility for predictive and retrospective toxicology analyses. Reprod. Toxicol. 89, 145–158. 10.1016/J.REPROTOX.2019.07.012 [DOI] [PMC free article] [PubMed] [Google Scholar]
- Wignall JA, Muratov E, Sedykh A, Guyton KZ, Tropsha A, Rusyn I, Chiu WA, 2018. Conditional Toxicity Value (CTV) Predictor: An In Silico Approach for Generating Quantitative Risk Estimates for Chemicals. Environ. Health Perspect. 126, 057008. 10.1289/EHP2998 [DOI] [PMC free article] [PubMed] [Google Scholar]
- Williams AJ, Grulke CM, Edwards J, McEachran AD, Mansouri K, Baker NC, Patlewicz G, Shah I, Wambaugh JF, Judson RS, Richard AM, 2017. The CompTox Chemistry Dashboard: A community data resource for environmental chemistry. J. Cheminform. 9. 10.1186/s13321-017-0247-6 [DOI] [PMC free article] [PubMed] [Google Scholar]
- Xu QS, Liang YZ, Du YP, 2004. Monte Carlo cross-validation for selecting a model and estimating the prediction error in multivariate calibration. J. Chemom. 18, 112–120. 10.1002/cem.858 [DOI] [Google Scholar]
- Zhu H, Ye L, Richard A, Golbraikh A, Wright FA, Rusyn I, Tropsha A, 2009. A Novel TwoStep Hierarchical Quantitative Structure–Activity Relationship Modeling Work Flow for Predicting Acute Toxicity of Chemicals in Rodents. Environ. Health Perspect. 117, 1257–1264. 10.1289/ehp.0800471 [DOI] [PMC free article] [PubMed] [Google Scholar]
Associated Data
This section collects any data citations, data availability statements, or supplementary materials included in this article.


