ABSTRACT
The current study aimed to explored the regulatory effect of Tropomyosin-related kinases B (TrkB) in the development and function of chondrocyte. Correlation between clinicopathological characteristics and osteoarthritis (OA) were analyzed. The expressions of TrkA, brain-derived neurotrophic factor (BDNF), TrkB, Src homolog and collagen homolog B (ShcB), and ShcC in OA cartilage tissue and IL-1β-stimulated chondrocytes from normal cartilage were determined by Western blot/qRT-PCR. After manipulating the expressions of TrkA, shTrkB, ShcB, miR-146a-3p and nuclear paraspeckle assembly transcript 1 (NEAT1), the differentiation-related molecules, and apoptosis-related molecules were examined by Western blot/qRT-PCR, and migration, invasion, proliferation, tube formation, and apoptosis rate in IL-1β-stimulated chondrocyte were examined by scratch, Transwell, colony formation, and tube formation, and flow cytometry assays, respectively. Bioinformatics, dual-luciferase and Spearman were used to analyze the binding and correlation of target genes. The findings showed that OA was related to body mass Index (BMI). The expressions of TrkA, TrkB and ShcB and NEAT1 were up-regulated in OA and IL-1β-stimulated chondrocytes, while miR-146a-3p was donwnregulated and was negatively correlated with TrkB or NEAT1. NEAT1 competed with TrkB in chondrocytes for miR-146a-3p binding. ShTrkB reversed the decrease in expressions of differentiation-related molecules, migration, invasion and proliferation, and the increase in ShcB expression and tube formation, of IL-1β-stimulated chondrocytes. Overexpressed ShcB reversed effect of shTrkB on the functions of IL-1β-stimulated chondrocytes. MiR-146a-3p inhibitor reversed effects of shTrkB on the function and apoptosis-related molecules on IL-1β-stimulated chondrocytes, while NEAT1 reversed role of miR-146a-3p. This paper demonstrated that NEAT1/miR-146a-3p/TrkB/ShcB axis regulates the development and function of chondrocyte.
KEYWORDS: Osteoarthritis, chondrocyte, tropomyosin-related kinases B, miR-146a-3p, nuclear paraspeckle assembly transcript 1
Introduction
Osteoarthritis (OA) is a chronic degenerative joint disease, which is mainly characterized by recurrent joint pain and gradual movement disorders[1]. As a common aging disease the incidence of OA is increasing in aging society. According to statistics, more than 240 million population suffer from OA worldwide, 10% of them are males and over 18% are females[2]. The progressive loss of articular cartilage and the formation of osteophytes in OA will cause joint pain, deformities and patient dysfunction[3]. The treatment of OA currently lacks targeted drug interventions, and surgical treatment such as artificial joint replacement is often required in the later stage[4]. Therefore, it is particularly important to understand the pathogenesis of OA, so as to find effective therapeutic targets for disease intervention.
Researchers believed that OA was an inevitable phenomenon associated with human aging in the past[5], but recent studies confirmed that the pathogenesis of OA is related to multiple factors[6]. For example, biomechanical factors will disrupt the normal coupling of chondrocytes, extracellular matrix and subchondral bone, and changes in articular cartilage all contribute to the development of OA. Atukorala[7] found that changes take place in the joint synovium precede before in other joint tissues, thus, the expression of synovitis and inflammatory factors is the key to OA. In addition, chondrocyte apoptosis, nerve growth factor (NGF), matrix metalloproteinases (MMPs), transforming growth factor β (TGF-β), and Wnt/β-catenin signaling pathways are all inducing factors of OA [8,9]. Recent research indicates that NGF/Tropomyosin-related kinases A (TrkA) and brain-derived neurotrophic factor (BDNF)/TrkB signaling pathways are involved in regulating the pain in OA patients[10]. Trk is a class of nerve growth factor receptor, and its family consists of highly homologous TrkA, TrkB, and TrkC, and is closely related to cell proliferation, differentiation, metabolism, and apoptosis[11]. Previous study showed that blocking the activation of TrkA can relieve pain in OA patients. However, the role of TrkB and its regulatory mechanism have not been reported [10,12]. Grimsholm[13] reported that BDNF and TrkB expressions are up-regulated in synovial tissues of patients with rheumatoid arthritis and OA; Gowler[14] found that TrkB positively regulates proinflammatory chemokines in OA synovium, and using TrkB-Fc chimera to isolate endogenous BDNF could relieve the pain in OA model rats. However, the specific regulatory mechanism of TrkB intervention in OA has not yet been reported.
MicroRNAs (miRNAs) play important roles in the occurrence and development of OA, and serve as circulating biomarkers of OA[15]. Swingler[15] found that the loss of miRNA in chondrocytes will cause bone growth defects and articular cartilage degradation. In addition, miR-203, miRNA-140, miRNA-145, and miRNA-146a are closely related to the production and metabolism of extracellular matrix of cartilage[16]. These findings indicated that miRNAs have certain potentials to be used in OA treatment. Therefore, the current study used the glial activator IL-1β to stimulate an OA cell model[17], which was studied to determine the effects and regulatory mechanisms of TrkB and its downstream target genes on OA, hoping to provide more evidence for developing a molecular-targeted therapy of OA.
Method
1. Ethical statement and cartilage tissue collection
The study was approved by the Ethics Committee of Henan Luoyang Orthopedic Hospital(Henan Provincial Rehabilitation Hospital). The informed consent was obtained from all the patients, who were diagnosed with the disease in the Orthopedics Department of our hospital. The OA cartilage samples (OA group, n = 16) were collected from the patients during total knee arthroplasty. The samples in the cartilage control group (Healthy group, n = 12) were obtained from the lower extremities of amputees suffered from trauma but without knee joint disease. The samples were collected from August 2017 to July 2019.The provider’s age, gender, height, weight, body mass Index (BMI), lesions (left knee or right knee), and Kellgren-Lawrence classification were systematically analyzed.
2. Cell culture and stimulation of IL-1β
The complete medium for culturing human normal chondrocytes CHON-001 (ATCC ® CRL-2846 ™) and Eagle’s medium (30–2002) were purchased from the American Type Culture Collection (ATCC, USA). The Eagle’s medium (30–2002) was added with fetal bovine serum (FBS, 10%, 30–2020). The cells were cultured in an incubator (Herocell 180, RADOBIO, China) at 37°C with 5% CO2, then digested by trypsin-EDTA solution of GIBCO (0.25%, 25,200–056, USA). Gradient concentrations (5 ng/mL, 10 ng/mL, 30 ng/mL) of interleukin-1β (IL-1β, WL03479, Wanleibio, China) were used to stimulate chondrocytes for 24 hours (h) to induce OA cell models. 10 ng/ml was finally determined as the stimulating concentration of IL-1β in the subsequent studies, according to the regulatory effect of gradient concentrations of IL-1β on TrkA, BDNF, TrkB, ShcB, and ShcC.
3. Western blot
Western blot was performed as previously described[18]. The proteins were separated from cell lysates of chondrocytes (100 μL, C874806, Macklin, China) by BCA method, and the protein concentration was determined. After the cartilage tissues were ground, the proteins were obtained according to the above method. The proteins (50 μg) were isolated by sodium dodecyl sulfate–polyacrylamide gel electrophoresis (SDS–PAGE) and transferred to a PVDF membrane (IPVH00010, Millipore, USA). The PVDF membrane was blocked by 5% blocking solution (SW3015-500 ml, Solarbio, China) for 2 h. Then the primary antibody corresponding to the target gene was added and co-incubated together for 24 h at 4°C. The primary antibodies used were as follows: Tropomyosin-related kinases A (TrkA, ab76291, 87KD, 1:1000), brain-derived neurotrophic factor (BDNF, ab108319, 15KD, 1:1000), TrkB (ab18987, 92KD, 1:1000), Src homolog and collagen homolog B (ShcB, ab243385, 62KD, 1:1000), ShcC (ab233477, 64KD, 1:1000), Bcl-2 (ab59348, 26KD, 1:1000), Bax (ab32503, 21KD, 1:2000), Clever caspase-3 (ab2302, 17KD, 1:1000), and glyceraldehyde-3-phosphate dehydrogenase (GAPDH, ab8245, 36KD, 1:5000). After washing the PVDF membrane, the corresponding anti-secondary antibody (Anti-Mouse, 1:10,000, ab6728; Anti-Rabbit, 1:10,000, ab6721) was added to the PVDF membrane and incubated at room temperature for 1.5 h, and the PVDF membrane was washed three times. Finally, ECL liquid (1 mL, NCI5079, ThermoFisher, USA) was used to develop the strips, and the gray values were measured using a Bio-rad GelDoc XR Biorad (USA). GAPDH served as an internal reference. All the antibodies were purchased from Abcam (UK).
4. Total RNA extraction and quantitative real-time polymerase chain reaction (qRT-PCR)
Trizol method (1 mL, 15,596–026, Invitrogen, USA) was used to extract total RNAs from tissues and cells in this study. The tissues were ground, added with Trizol, and then added chloroform, isopropanol, and ethanol. The concentration of total RNAs were measured by ultramicro-spectrophotometer (SpectraMax QuickDrop, MOLECULAR DEVICES, USA), and the total RNAs were reverse-transcribed into cDNAs by RevertAidFirst Strand cDNA Synthesis Kit (k1622, ThermoFisher, USA). The qRT-PCR reaction system consisted of 2 μL diluted cDNA, 6 μL DEPC water, 2 μL diluted primers, and 10 μL SYBR reagent (04913914001, Roche, Switzerland) under the following reaction conditions of the PCR instrument (T100, Bio-Rad, USA): pre-denaturation at 95°C for 10 minutes (min), denaturation at 95°C for 15 seconds (s), annealing at 60°C for 1 min, for a total of 40 cycles. The mRNA expression levels were calculated by 2−ΔΔCT[19]. The primer sequences used in our study were as follows: TrkA-F, 5ʹ-TACCCCCGATCTTGACGGT-3ʹ, and TrkA-R, 5ʹ-TGAGCCGAGGAGTGAAATGG-3ʹ; BDNF-F, 5ʹ-TAGCCTGACAAGGCGAAGGT-3ʹ, and BDNF-R, 5ʹ-CCCACCACTTGGTGTGACTT-3ʹ; TrkB-F, 5ʹ-GGAATTGGGTTGGAGCAGGA-3ʹ, and TrkB-R, 5ʹ-AAAGGGGAATGCGGAGACTG-3ʹ; ShcB-F, 5ʹ-CCACGAGGAGCACCTGTATG-3ʹ, and ShcB-R, 5ʹ-GATGCTCTCAAACAGCACGTC-3ʹ; ShcC-F, 5ʹ-CTGCAAGCCGAGACTTGGTA-3ʹ, and ShcC-R, 5ʹ-GCTACACCTTCCTAGTGGCA-3ʹ; SRY-related high-mobility-group box 9 (SOX9)-F, 5ʹ-TCTACTCCACCTTCACCTACAT-3ʹ, and SOX9-R, 5ʹ-CTGTGTGTAGACGGGTTGTT-3ʹ; collagen II-F, 5ʹ-CTCCCAGAACATCACCTACCAC-3ʹ, and collagen II-R, 5ʹ-CCATCCTTCAGGGCAGTGTA-3ʹ; Aggrecan-F, 5ʹ-GTTGTATTCCACTACCGCCCG-3ʹ, and Aggrecan-R, 5ʹ-TCACACTGCTCATAGCCTGCC-3ʹ; proteoglycan-F, 5ʹ-TTCGAGAGAGGGAGGGAGTG-3ʹ, and proteoglycan-R, 5ʹ-CCTGAAGGTGGAGGTGCTTT-3ʹ; miR-146a-3p-F, 5ʹ-CAGTTCTTCAGGTCGTATCCAGT-3ʹ, and miR-146a-3p-R, 5ʹ-GTATCCAGTGCGTGTCGTGG-3ʹ; nuclear paraspeckle assembly transcript 1 (NEAT1)-F, 5ʹ-GGCAGGTCTAGTTTGGGCAT-3ʹ, and NEAT1-R, 5ʹ-CCTCATCCCTCCCAGTACCA-3ʹ; GAPDH-F, 5ʹ-GATGCTGGTGCTGAGTATGRCG-3ʹ, and GAPDH-R, 5ʹ-GTGGTGCAGGATGCATTGCTCTGA-3ʹ; U6-F, 5ʹ-AAAGCAAATCATCGGACGACC-3ʹ, and U6-R, 3ʹ-GTACAACACATTGTTTCCTCGGA-3ʹ. Both GAPDH and U6 served as internal references.
5. Plasmid construction and transfection
We used shRNA short hairpin RNA (shRNA) vector (shrna0001, RIBOBIO, China) to construct silent TrkA (shTrkA), silent TrkB (shTrkB), and silent NEAT1 (shNEAT1) plasmids. pcDNATM3.1 (V79520, ThermoFisher, USA) was used to compound over-expressed ShcB plasmid and over-expressed NEAT1 plasmid; miR-146a-3p inhibitor (MH13059) and miR-146a-3p mimic (MC13059) were purchased from ThermoFisher, USA. Target sequence of shTrkA, shTrkB, shNEAT1 and over-expressed ShcB were as follow: shTrkA, 5ʹ-CCCTTAAAGGAACCAATGAGTCC-3ʹ; shTrkB, 5ʹ-GGCAGAAAACGGCAGGAAAAAGA-3ʹ; shNEAT1 5ʹ-CTCCTTTTGGACTTTTCTCTAGG-3ʹ; ShcB, 5ʹ-CTGTGGTTTATAGTAAACCGTGT-3ʹ. And the mature miRNA sequence of miR-146a-3p was 5ʹ-CCUCUGAAAUUCAGUUCUUCAG-3ʹ. Chondrocytes were pre-digested before the cell transfection. LipofectamineTM 3000 (L3000008, ThermoFisher, USA) with high transfection efficiency and repeatability was used to the following cell transfection. Opti-MEMTM I reagent (50 μL, 31,985,070, Gibco, USA) and LipofectamineTM 3000 reagent (3 μL) were used to dilute the plasmids, respectively. The mixture was allowed to stand for 15 min at room temperature, and then added with the pre-treated chondrocytes. Transfection efficiency of OA cells was detected by qRT-PCR after 48 h.
6. Scratch assay
Parallel lines were evenly drawn at the back of 12-well plate with a space of 0.8 cm between two lines. The pre-digested cells were added into 12-well plate at 3 × 10⁵ cells/well. The OA cells were incubated in cell incubators with 5% CO2 at 37°C overnight. The trace perpendicular to the line drawn was drawn using the pipette. Serum-free Eagle medium was added and further incubated with the cells for 48 h. Cell migration was observed under a microscope (CKX53, OLYMPUS, Japan) at 100 times magnification.
7. Transwell
Transwell was purchased from American BD Biosciences Company (8 μm). After the pre-digestion treatment the chondrocytes were adjusted to concentration of 2 × 10⁶ cells/mL. Transwell chamber was placed in the sterile culture plate, and then the upper chamber was coated by Matrigel glue (YZ-356234, Solarbio, China), and inoculated with chondrocytes (100 μL), while Eagle medium (600 μL) containing 10% FBS was added to the lower chamber. The chamber was cultured in a cell incubator with 5% CO2 at 37°C for 48 h. Next, the Transwell chamber was removed and the culture medium was discarded. The cells were fixed by 4% paraformaldehyde for 30 min at room temperature and then stained by methylrosanilnium Chloride Solution (0.1%, C6191, Macklin, China) for 5 min. Cell invasion was observed under a microscope at 250 times.
8. Cell colony formation
The digested chondrocytes (1 × 10³ cells/mL) was prepared though RPMI1640 with FBS (15%). Cell suspensions (10 mL) were added to the corresponding culture dishes. The chondrocytes were cincubated in Herocell 180 cell incubator at 37°C for 2 weeks (w). The chondrocytes were fixed by methanol for 15 min after the incubation, and stained by Giemsa for 20 min at room temperature. Cell proliferation were counted using Leica DMi1 microscope (Germany).
9. Tube formation assay
The effects of TrkB, ShcB, miR-146a-3p, and NEAT1 expression levels on the tubule elongation and branch formation of human Umbilical Vein Endothelial Cells (HUVECs) were examined by tube formation assay. 100 µL of HUVECs in logarithmic growth phase (1 × 10⁵ cell/mL) were inolulated into a 96-well plate containing Matrigel glue (50 µL). Cell culture supernatants transfected with shTrkB, overexpressed ShcB, miR-146a-3p inhibitor, and shNEAT1 were then added to 96-well plates. After incubation in a 5% CO2 incubator at 37°C for 4 h, the formation of HUVECs tubule-like structures was observed under a microscope at a magnification of 100 times.
10. Target gene prediction and dual-luciferase experiment
TargetScan database (http://www.targetscan.org) predicted that TrkB targeted miRNA miR-146a-3p, and StarBase v2.0 (http://starbase.sysu.edu.cn/starbase2/index.php) predicted that miR-146a-3p targeted NEAT1. The targeted binding sites between TrkB and miR-146a-3p, miR-146a-3p and NEAT1 were also analyzed by these two databases. Dual-luciferase experiment was performed to verify the predictions. Dual-luciferase reporter plasmids were constructed using pmirGLO Vector (Promega, USA), namely, wild type TrkB (TrkB-WT), mutant TrkB (TrkB-mut), NEAT1-WT and NEAT1-mut. The digested chondrocytes were diluted into 5 × 10⁵ cell/mL using eagle medium. Each reporter plasmid (50 ng) and miR-146a-3p (100 pmol) inhibitor were then co-transfected into the chondrocytes. After 48 h, PLB regent (500 μL, E1910, Promega, USA), sample lysate (20 μL) and Luciferase Assay Reagent II (100 μl, E1483, Promega, USA) were added into chondrocytes in sequence. The reaction was terminated by Stop&Glo reagent, and Tecan GENios Pro plate (Switzerland) was used to detect the Firefly luciferase and Renilla luciferase. The ratio of firefly/Renilla indicated the experimental results.
11. Flow cytometry
The digested chondrocytes were washed thoroughly by PBS 3 times. Chondrocyte suspension was fixed by ethanol (70%) overnight at 4°C, and washed by Annexin V-FITC reagent (5 uL, APOAF-50TST, Merck, Germany) and propidium iodide reagent (10 μL, S19136, Yuanye, China) at 37°C for 20 min. Flow cytometer (CytoFLEX, Beckman Coulter, USA) was used to detect the cell apoptosis.
12. Statistical analysis
All the data were analyzed by SPSS 23.0 (USA). Difference between two groups was compared by Student’s two-tailed t-test; and comparisons of differences among more than two groups were analyzed by one-way ANOVA or two-way ANOVA. The correlation analysis between TrkB, miR-146a-3p and NEAT1 were performed using Spearman correlation coefficient. Statistically different was defined if p < 0.05.
Result
1. TrkA, BDNF, TrkB, ShcB and ShcC expressions in the OA cartilage tissues and IL-1β-stimulated chondrocytes
From the clinical pathological information of the patients, we found that the occurrence of OA was only related to their BMI (Table 1, p < 0.01), and unrelated to age, gender, height, weight or other factors. The expressions of TrkA, BDNF, TrkB, ShcB, and ShcC in cartilage tissues were detected by Western blot, which showed that the expressions of TrkA, TrkB, and ShcB were increased significantly (Figure 1a, p < 0.001), but BDNF and ShcC did not change significantly. The mRNA expressions of these genes in the normal chondrocytes (CHON-001) stimulated by IL-1β also showed the same trend, the mRNA expression of TrkA, TrkB, and ShcB gradually increased (Figure 1b-f, p < 0.05) as the concentration of IL-1β increased, but those of BDNF and ShcC did not change significantly.
Table 1.
Clinical pathological information of patients with osteoarthritis (OA)
| Healthy (n = 12) | OA (n = 16) | P value | |
|---|---|---|---|
| Age, years | 71.4 ± 18.7 | 65.1 ± 5.4 | 0.210 |
| Gender | 0.233 | ||
| Male | 4 | 4 | |
| Female | 8 | 12 | |
| Height, m | 1.61 ± 0.091 | 1.60 ± 0.063 | 0.734 |
| Weight, kg | 65.4 ± 7.3 | 66.2 ± 8.7 | 0.799 |
| BMI, kg*m−2 | 23.8 ± 2.5 | 26.5 ± 1.9 | 0.003 |
| Side | 0.191 | ||
| Right | 5 | 8 | |
| Left | 7 | 8 | |
| Kellgren-Lawrence | - | ||
| 0 | 9 | - | |
| I | 3 | - | |
| III | - | 5 | |
| IV | - | 11 |
Figure 1.
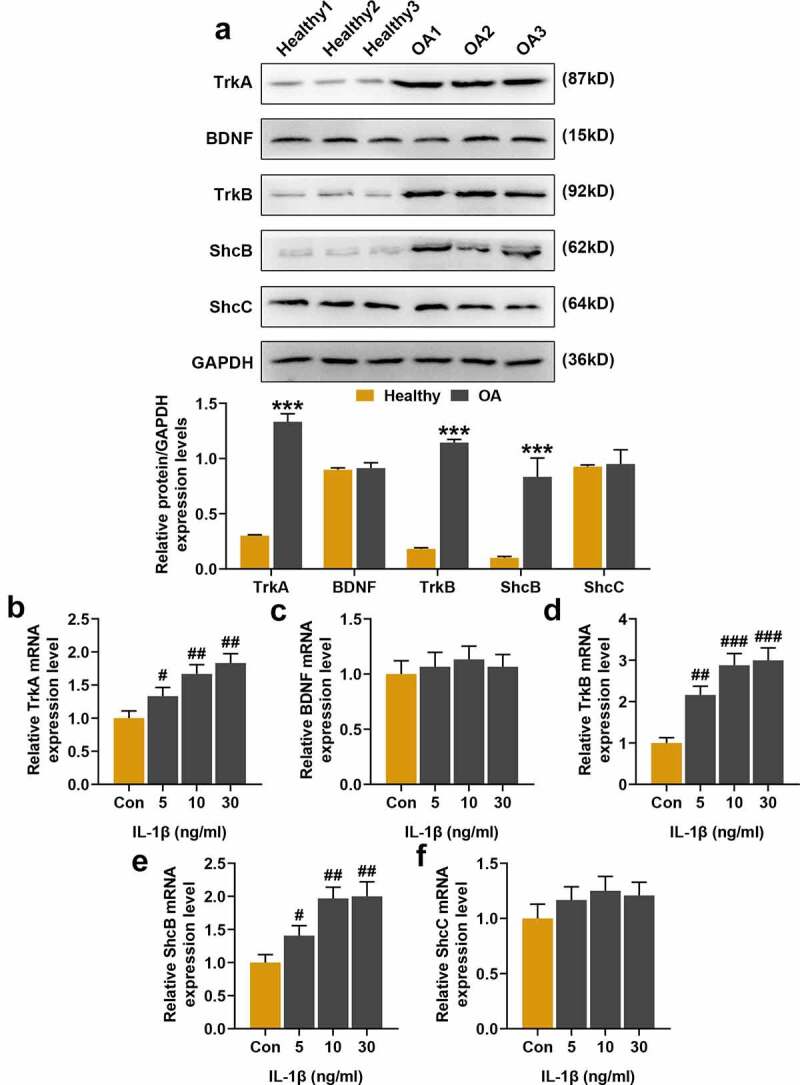
Expression of Tropomyosin-related kinases A (TrkA), brain-derived neurotrophic factor (BDNF), TrkB, Src homolog and collagen homolog B (ShcB), ShcC in the cartilage tissues and gradient concentrations of interleukin-1β (IL-1β) stimulation in normal chondrocytes. (a) Western blot was used to detect the protein expressions of TrkA, BDNF, TrkB, ShcB and ShcC in cartilage tissues. GAPDH served as an internal reference. (b-f) Quantitative Real Time-Polymerase Chain Reaction (qRT-PCR) was used to detect TrkA, BDNF, TrkB, ShcB, and ShcC expressions in normal chondrocytes stimulated by gradient concentrations IL-1β (5 ng/ml, 10 ng/ml, 30 ng/ml). GAPDH served as an internal reference. Normal chondrocytes: CHON-001. All experiments were repeated three times to average. *** p < 0.001 vs. Healthy; # p < 0.05, ## p < 0.01, ### p < 0.001 vs. Control (Con)
2. Effects of shTrkA and shTrkB on the expressions of TrkA, TrkB, ShcB, cartilage differentiation-related factors and cell migration of chondrocytes stimulated by IL-1β
We used shRNA for silencing TrkA and TrkB expression in normal chondrocytes. Based on the results of previous experiments, 10 ng/ml IL-1β was used to stimulate the chondrocytes in subsequent studies, and the effects of shTrkA and shTrkB on the expressions of differentiation-related factors in IL-1β-stimulated chondrocytes were further compared. After the stimulation of chondrocytes by IL-1β, the expressions of TrkA, TrkB and ShcB were significantly increased (Figure 2a-c, p < 0.01), but the mRNA levels of SOX9, Collagen II, Aggrecan and proteoglycan were greatly decreased (Figure 2d-g, p < 0.01). ShTrkA only reversed the TrkA expression increased by IL-1β (Figure 2a, p < 0.001), which had no significant effect on the expressions of other factors. ShTrkB partially reversed the expressions of TrkB, ShcB, SOX9, Collagen II, Aggrecan, and proteoglycan increased by IL-1β, except for TrkA (Figure 2b-g, p < 0.05). The scratch assay showed that IL-1β stimulation inhibited the migration of chondrocytes (Figure 2h, p < 0.01), which was partially reversed by shTrkB (Figure 2h, p < 0.01) rather than shTrkA.
Figure 2.
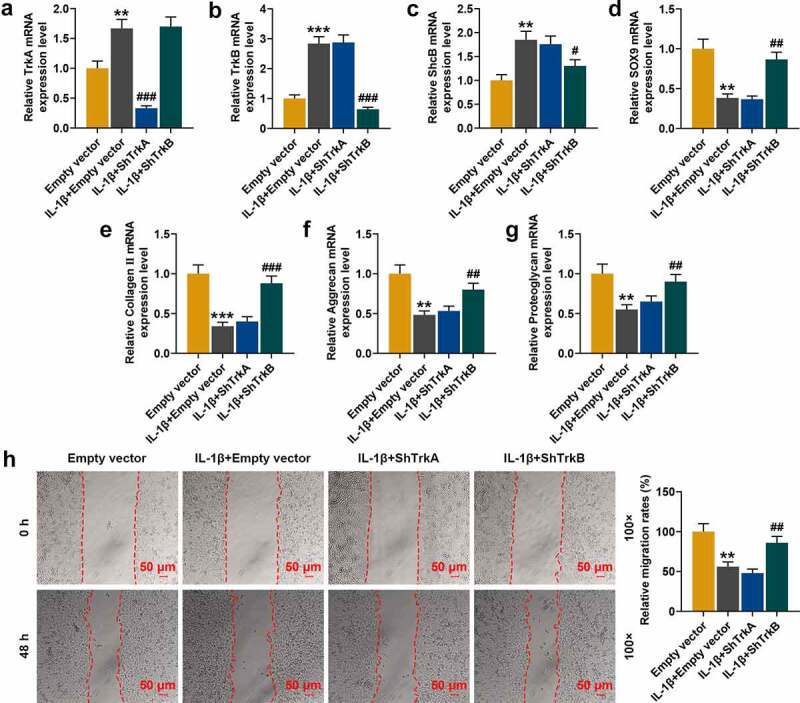
Effect of silencing TrkA (shTrkA) and silencing TrkB (shTrkB) using shRNA on the expressions of TrkA, TrkB, ShcB, cartilage differentiation-related factors and cell migration of IL-1β-stimulated normal chondrocytes. (a-g) The effects of shTrkA and shTrkB on the expressions of TrkA, TrkB, ShcB, and cartilage differentiation-related factors in IL-1β-stimulated chondrocytes were detected by qRT-PCR. GAPDH served as an internal reference. (h) The effects of shTrkA and shTrkB on migration of IL-1β-stimulated normal chondrocyte (CHON-001) were examined by a scratch assay. The magnification was 100 times. Normal chondrocytes: CHON-001. ** p < 0.01, *** p < 0.001 vs. Empty vector; # p < 0.05, ## p < 0.01, ### p < 0.001 vs. IL-1β + empty vector
3. Effects of ShTrkA and shTrkB on IL-1β-stimulated chondrocyte invasion, proliferation and tube formation of HUVECs
To further determine the effects of ShTrkA and shTrkB on the functions of chondrocytes, we observed changes of chondrocyte invasion, proliferation, and tube formation in HUVECs by Transwell assay, cell colony formation assay, and tube formation assay. The results showed that the invasion and proliferation of chondrocytes were decreased after IL-1β stimulation (Figure 3a-b, p < 0.001), but the tube formation of HUVECs was significantly enhanced (Figure 3c, p < 0.01). However, these effects were partially reversed by the intervention of shTrkB (Figure 3a-c, p < 0.01), and ShTrkA did not affect the changes of chondrocytes after IL-1β stimulation.
Figure 3.
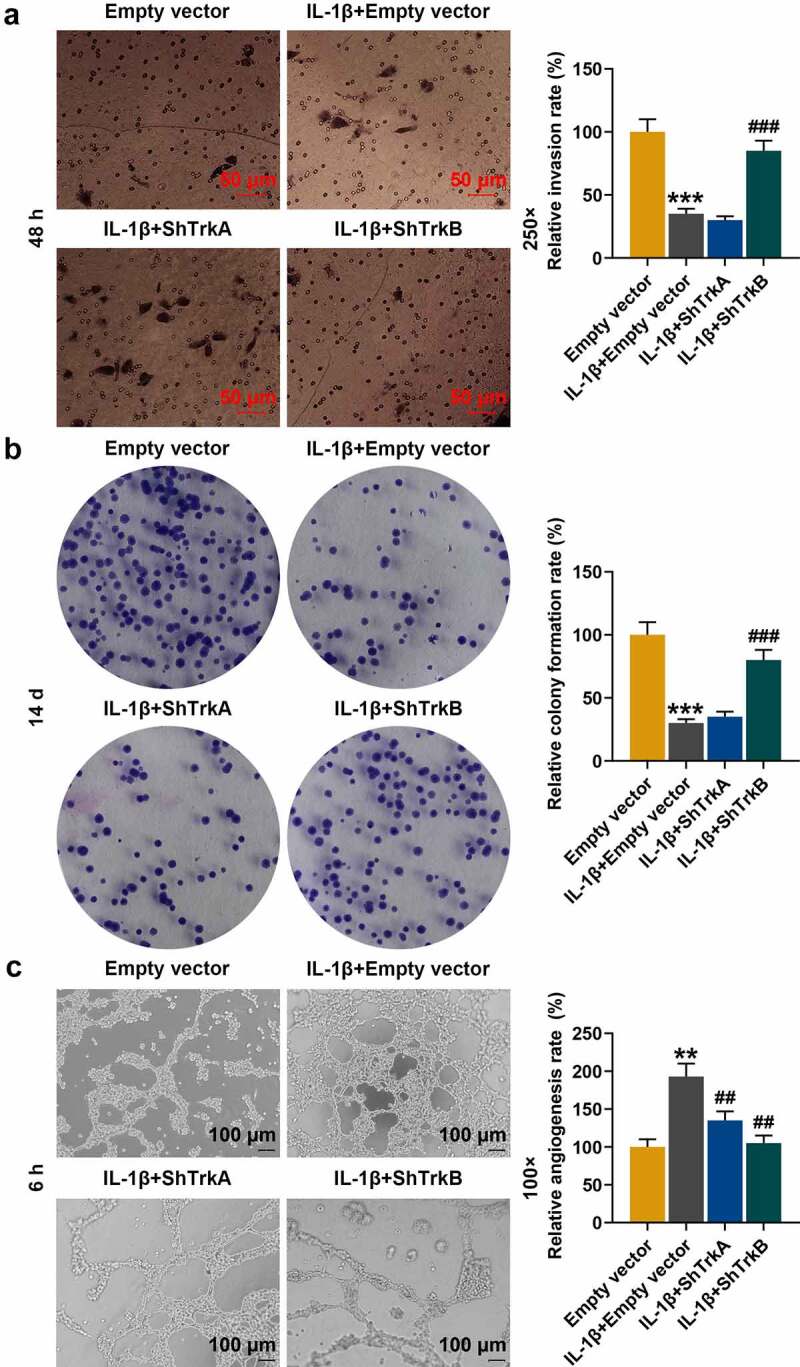
Effects of ShTrkA and shTrkB on IL-1β-stimulated normal chondrocyte invasion, proliferation, and tube formation of HUVECs. (a) The effects of ShTrkA and shTrkB on the invasion of IL-1β-stimulated normal chondrocytes were examined by Transwell assay. Magnification was 250 times. (b) The effects of ShTrkA and shTrkB on the proliferation of normal chondrocytes stimulated by IL-1β were detected by cell colony formation assay. (c) The effects of ShTrkA and shTrkB on the tube formation of HUVECs stimulated by IL-1β were detected by tube formation assay. Magnification was 100 times. Normal chondrocytes: CHON-001. ** p < 0.01, *** p < 0.001 vs. Empty vector; ## p < 0.01, ### p < 0.001 vs. IL-1β + empty vector
4. Effects of overexpressed ShcB and shTrkB on chondrocyte metastasis, proliferation and tube formation of HUVECs
As the expression of ShcB in the cartilage tissues and cells also changed in previous experiments, we constructed ShcB overexpression plasmids and studied the effects of overexpressed ShcB and shTrkB on the functions of chondrocytes. ShTrkB significantly promoted migration (Figure 4a, p < 0.05), invasion (Figure 4b, p < 0.01), and proliferation (Figure 5a, p < 0.001) of chondrocytes, but inhibited the tube formation of HUVECs (Figure 5b, p < 0.01), and overexpression of ShcB had the opposite effects (Figs 4–5, p < 0.01). The effects of shTrkB on chondrocyte migration, invasion, proliferation, and tube formation of HUVECs were partially reversed by the overexpressed ShcB (Figs 4–5, p < 0.05).
Figure 4.
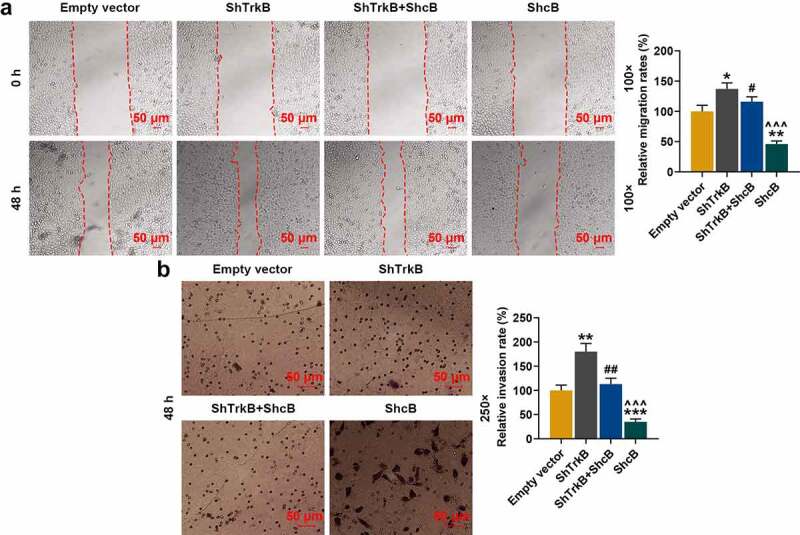
Effects of overexpressed ShcB and shTrkB on the migration and invasion of normal chondrocytes. (a) The effects of overexpressed ShcB and shTrkB on normal chondrocyte migration were examined by a scratch assay. The magnification was 100 times. (b) The effects of overexpressed ShcB and shTrkB on normal chondrocyte invasion were detected by Transwell assay. Magnification was 250 times. Normal chondrocytes: CHON-001. * p < 0.05, ** p < 0.01, *** p < 0.001 vs. Empty vector; # p < 0.05, ## p < 0.01 vs. ShTrkB; ^^^ p < 0.001 vs. ShTrkB + ShcB
Figure 5.
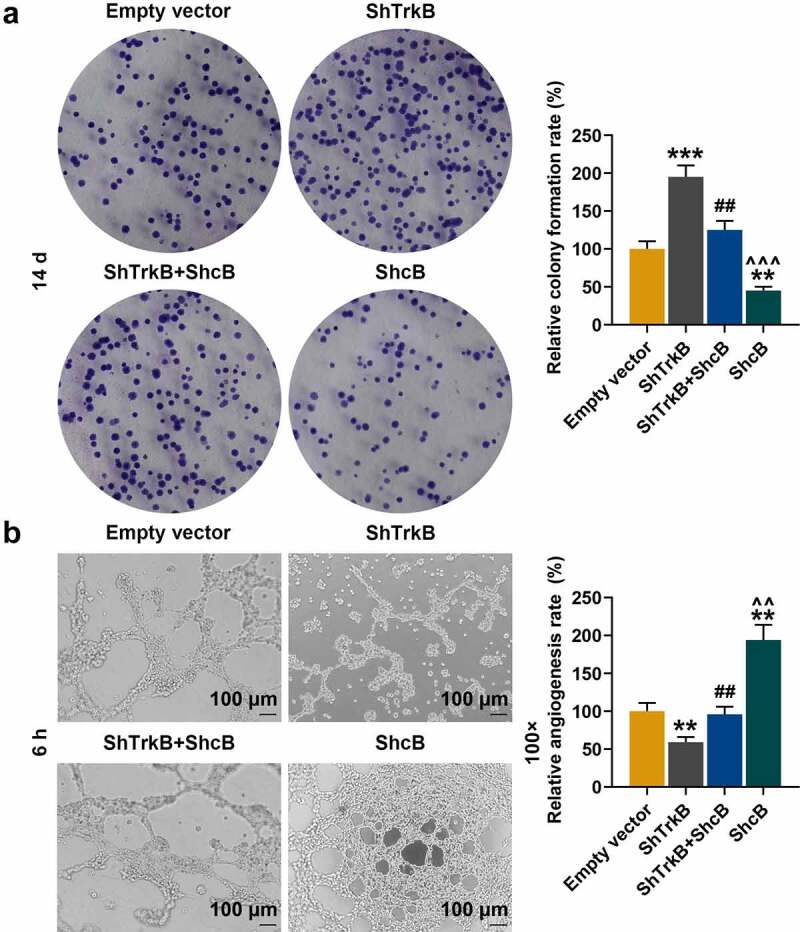
Effects of overexpressed ShcB and shTrkB on normal chondrocyte proliferation and tube formation in HUVECs. (a) The effects of overexpressed ShcB and shTrkB on normal chondrocyte proliferation ability were examined by cell colony formation assay. (b) The effects of overexpression of ShcB and shTrkB on the tube formation ability of HUVECs were detected by tube formation assay. Magnification was 100 times. Normal chondrocytes: CHON-001. ** p < 0.01, *** p < 0.001 vs. Empty vector; ## p < 0.01 vs. ShTrkB; ^^ p < 0.01, ^^^ p < 0.001 vs. ShTrkB + ShcB
5. TrkB and miR-146a-3p targeting relationship verification, their expressions and correlation in OA cartilage tissue
TargetScan database predicted that miR-146a-3p was a target gene for TrkB with their binding sites (Figure 6a), which was further verified by dual-luciferase experiment. From Figure 6b and Figure 6c, it could be found that miR-146a-3p was a target gene for TrkB, as the cells co-transfected with miR-146a-3p mimic and TrkB-WT showed significantly reduced fluorescence activity (Figure 6b, p < 0.001), and the fluorescence activity of the cells co-transfected with miR-146a-3p inhibitor and TrkB-WT was significantly increased (Figure 6c, p < 0.01). The expressions of TrkB and miR-146a-3p in OA cartilage tissues were determined, and we found that mRNA expression of miR-146a-3p was reduced (Figure 6d, p < 0.001), and TrkB expression was reduced (Figure 6e, p < 0.001). Correlation analysis found that miR-146a-3p and TrkB was negatively correlated in healthy human cartilage tissues (Figure 6f, r = −0.717, p = 0.009) and OA cartilage tissues (Figure 6g, r = −0.672, p = 0.004).
Figure 6.
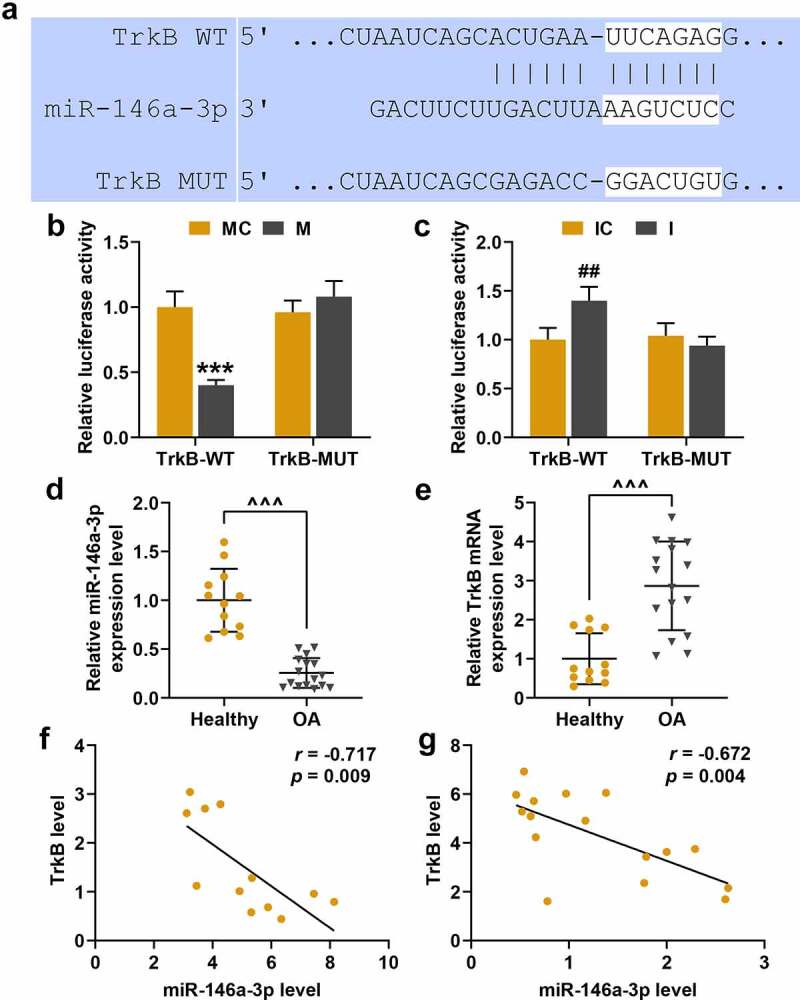
TrkB and miR-146a-3p targeting relationship verification, expression and correlation research in osteoarthritis (OA) cartilage tissues. (a) The TargetScan database predicted the targeted binding sites for TrkB and miR-146a-3p. (b-c) Dual-luciferase experiment was used to verify the targeting relationship between TrkB and miR-146a-3p. (d-e) The expression of miR-146a-3p and TrkB in OA cartilage tissues was detected by qRT-PCR. GAPDH served as an internal reference. (f-g) The correlation analysis between miR-146a-3p and TrkB in healthy human cartilage tissues and OA cartilage tissues was obtained by Spearman correlation coefficient. All experiments were repeated three times to average. *** p < 0.001 vs. miR-146a-3p mimic control (MC); ## p < 0.01 vs. miR-146a-3p inhibitor control (IC); ^^^ p < 0.001 vs. Healthy
6. Effects of miR-146a-3p inhibitor and shTrkB on TrkB expression and chondrocyte proliferation
QRT-PCR found that the transfection efficiency of miR-146a-3p inhibitor and shTrkB. MiR-146a-3p inhibitor increased the expression of TrkB in chondrocytes (Figure 7a, p < 0.01), and partially reversed the inhibition of shTrkB (Figure 7a, p < 0.01). Moreover, miR-146a-3p inhibitor and shTrkB inhibited chondrocyte proliferation (Figure 7b, p < 0.01), and partially reversed promoting effect shTrkB on chondrocyte proliferation (Figure 7b, p < 0.01).
Figure 7.
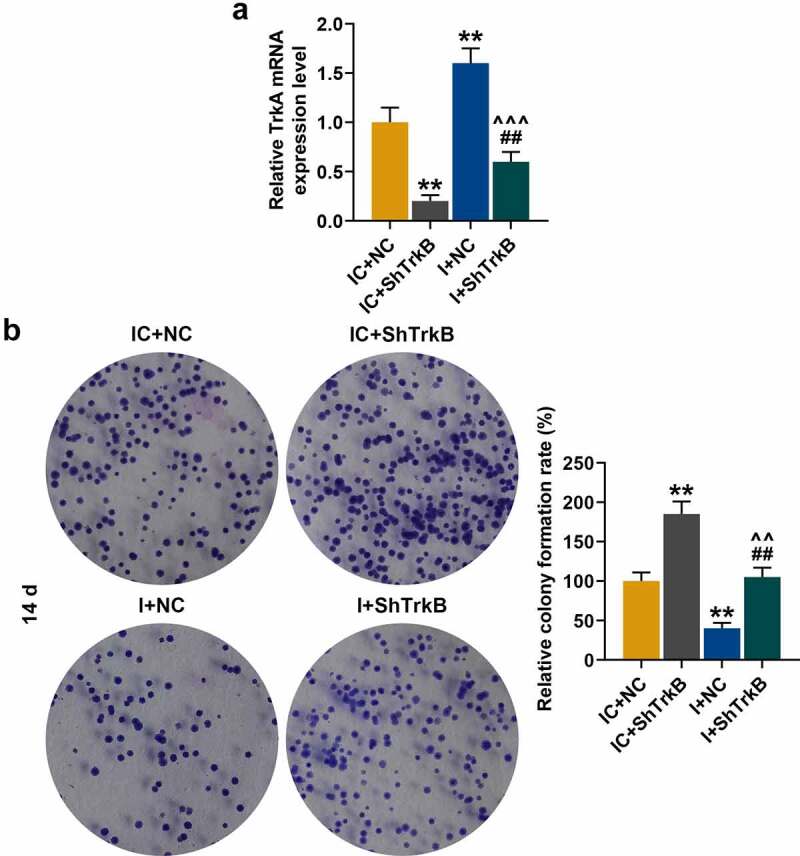
Effects of miR-146a-3p inhibitor and shTrkB on TrkB expression and normal chondrocyte proliferation. (a) QRT-PCR was used to compare the effects of miR-146a-3p inhibitor and shTrkB on TrkB expression in normal chondrocytes. GAPDH served as an internal reference. (b) The effects of miR-146a-3p inhibitor and shTrkB on the proliferation of normal chondrocytes were detected by cell colony formation assay. All experiments were repeated three times to average. Normal chondrocytes: CHON-001. ** p < 0.01 vs. IC + negative control (NC); ## p < 0.01 vs. IC + shTrkB; ^^ p < 0.01, ^^^ p < 0.001 vs. miR −146a-3p inhibitor (i) + NC
7. Effects of miR-146a-3p inhibitor and shTrkB on chondrocyte apoptosis and expressions of apoptosis-related proteins
Flow cytometry was used to detect the effects of miR-146a-3p inhibitor and shTrkB on chondrocyte apoptosis, and we found that shTrkB inhibited chondrocyte apoptosis (Figure 8a, p < 0.05), which was significantly promoted by miR-146a-3p inhibitor (Figure 8a, p < 0.001) and partially reversed the effect of shTrkB on the cell apoptosis (Figure 8a, p < 0.01). We further analyzed the effects of miR-146a-3p inhibitor and shTrkB on the expressions of apoptosis-related proteins (Figure 8b), and observed that shTrkB increased Bcl-2 expression and reduced protein expressions of Bax and Clever caspase-3 (C caspase-3) (Figure 8b, p < 0.001), however, miR-146a-3p inhibitor produced completely opposite regulatory effects on Bcl-2, Bax, and C caspase-3 (Figure 8b, p < 0.05), and partially reversed shTrkB regulation of apoptosis-related genes (Figure 8b, p < 0.05).
Figure 8.
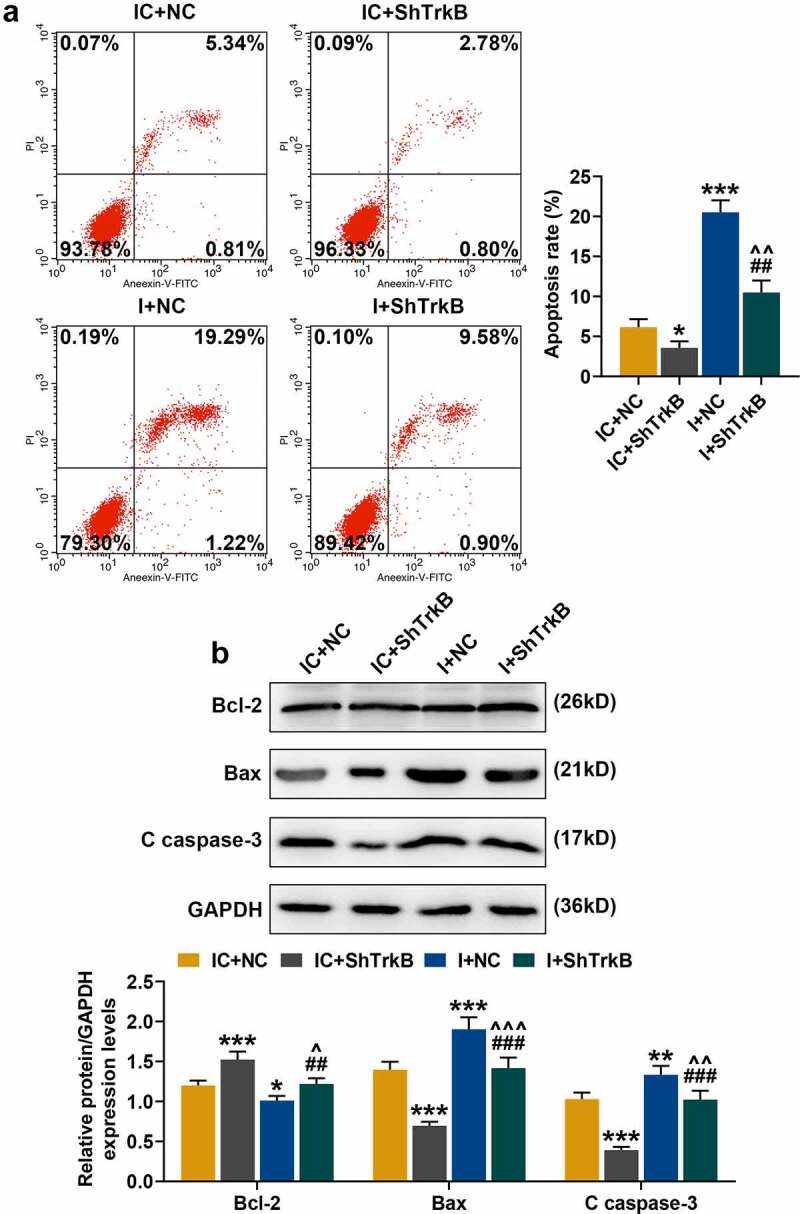
Effects of miR-146a-3p inhibitor and shTrkB on normal chondrocyte apoptosis and expression of apoptosis-related proteins. (a) The effects of miR-146a-3p inhibitor and shTrkB on normal chondrocyte apoptosis were detected by flow cytometry. (b) The effects of miR-146a-3p inhibitor and shTrkB on apoptosis-related proteins expression in normal chondrocytes were detected by Western blot. GAPDH served as an internal reference. All experiments were repeated three times to average. Normal chondrocytes: CHON-001. * p < 0.05, ** p < 0.01, *** p < 0.001 vs. IC + NC; ## p < 0.01, ### p < 0.001 vs IC + shTrkB; ^ p < 0.05, ^^ p < 0.01 vs. I + NC
8. Effects of miR-146a-3p inhibitor and shTrkB on chondrocyte migration, invasion and tube formation of HUVECs
In addition to chondrocyte proliferation and apoptosis, we also examined the effects of miR-146a-3p inhibitor and shTrkB on chondrocyte migration, invasion, and tube formation of HUVECs. From Figure 9a and Figure 9b, it could be observed that shTrkB significantly promoted the migration and invasion of chondrocytes (Figure 9a-b, p < 0.01), but miR-146a-3p inhibitor produced the opposite effects (Figure 9a-b, p < 0.01) and also partially reversed the promotion of shTrkB (Figure 9a-b, p < 0.01). Tube formation assay showed that shTrkB inhibited the ability of HUVECs to generate new blood vessels (Figure 9c, p < 0.05), while miR-146a-3p significantly promoted the tube formation ability of HUVECs (Figure 9c, p < 0.01), and also partially reversed the inhibitory effect of shTrkB (Figure 9c, p < 0.01).
Figure 9.
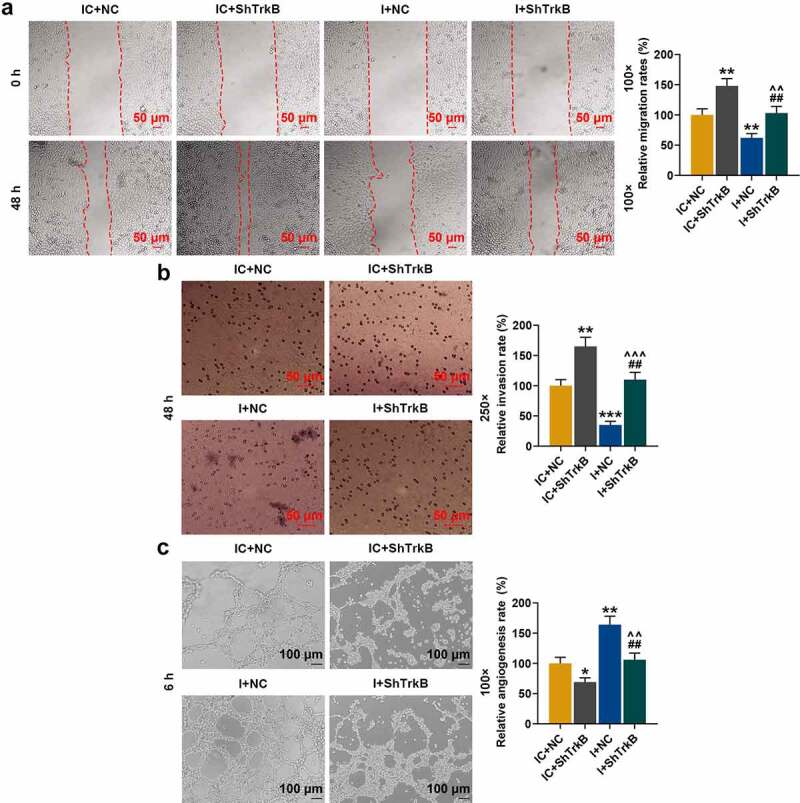
Effects of miR-146a-3p inhibitor and shTrkB on normal chondrocyte migration, invasion and tube formation of HUVECs. (a) The effects of miR-146a-3p inhibitor and shTrkB on normal chondrocyte migration were examined by scratch test. The magnification was 100 times. (b) The effects of miR-146a-3p inhibitor and shTrkB on normal chondrocyte invasion ability were detected by Transwell assay. Magnification was 250 times. (c) The effects of miR-146a-3p inhibitor and shTrkB on the tube formation ability of HUVECs were tested by tube formation assay. Magnification was 100 times. Normal chondrocytes: CHON-001. All experiments were repeated three times to average. * p < 0.05, ** p < 0.01, *** p < 0.001 vs. IC + NC; ## p < 0.01 vs. IC + shTrkB; ^^^ p < 0.001 vs. I + NC
9. NEAT1 and miR-146a-3p targeting relationship verification, their expressions and correlation research in OA cartilage tissue
StarBase predicted that NEAT1 as a target gene of miR-146a-3p (Figure 10a), which was verified by dual-luciferase experiment, as the fluorescence activity of cells co-transfected with miR-146a-3p mimic and NEAT1-WT was significantly lower than that of the Blank group (Figure 10b, p < 0.001). QRT-PCR analysis revealed that the expression of NEAT1 in the OA cartilage tissues was lower than that in the healthy tissues (Figure 10c, p < 0.001). In the following correlation studies, NEAT1 showed negatively correlated with miR-146a-3p expression in the healthy cartilage tissues (Figure 10d, r = −0.715, p = 0.009) and the OA cartilage tissues (Figure 10e, r = −0.642, p = 0.007). However, NEAT1 and TrkB was positively correlated in the healthy cartilage tissues (Figure 10f, r = 0.791, p = 0.002) and OA cartilage tissues (Figure 10g, r = 0.727, p = 0.001,).
Figure 10.
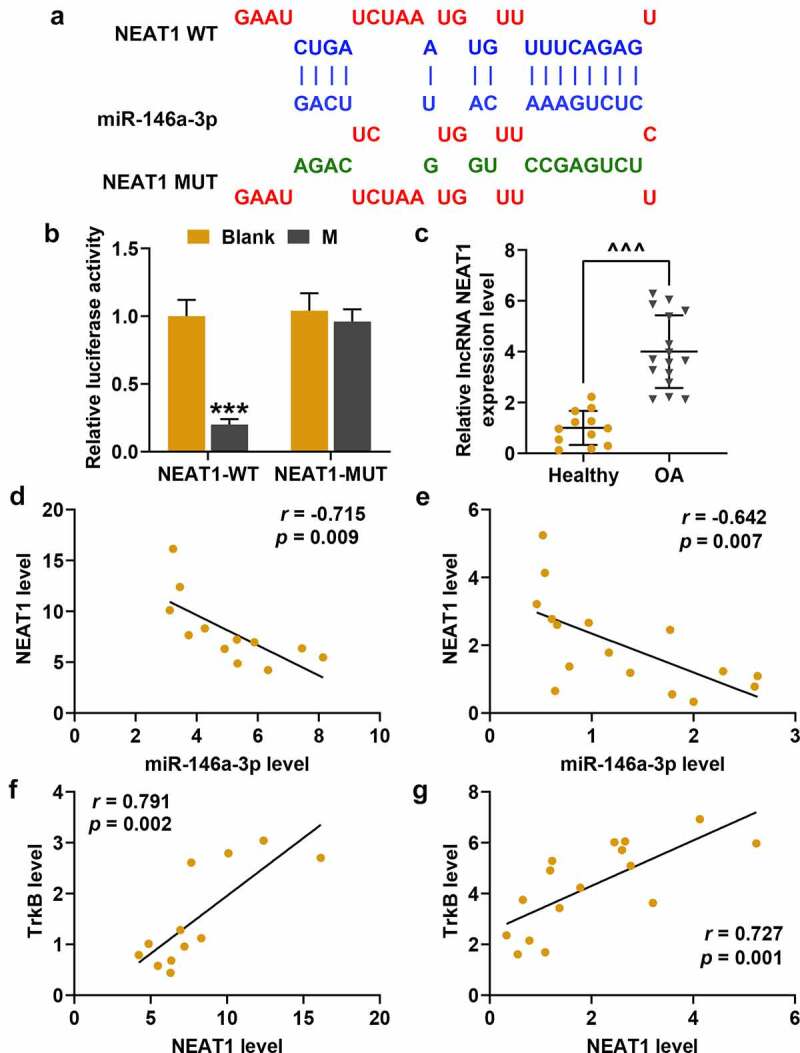
Nuclear paraspeckle assembly transcript 1 (NEAT1) and miR-146a-3p targeting relationship verification, expression and correlation research in OA cartilage tissues. (a) The starBase predicted the targeted binding sites for NEAT1 and miR-146a-3p. (b) Dual-luciferase experiment was used to verify the targeting relationship between NEAT1 and miR-146a-3p. (c) The expressions of NEAT1 and miR-146a-3p in OA cartilage tissues were detected by qRT-PCR. GAPDH served as an internal reference. (d-e) The correlation analysis between NEAT1 and miR-146a-3p in cartilage tissues (d) and OA cartilage tissues (e) of healthy people was obtained by Spearman correlation coefficient. (f-g) Correlation analysis of NEAT1 and TrkB in healthy human cartilage tissues (f) and OA cartilage tissues (g) was obtained by Spearman correlation coefficient. All experiments were repeated three times to average. *** p < 0.001 vs. Blank; ^^^ p < 0.001 vs. Healthy
10. Effect of silenced/overexpressed NEAT1 on miR-146a-3p expression and chondrocyte proliferation
QRT-PCR showed that after cell transfection, silencing NEAT1 significantly inhibited NEAT1 expression, and overexpressed NEAT1 effectively increased NEAT1 expression in chondrocytes (Figure 11a, p < 0.001). Moreover, both silencing and overexpressed NEAT1 increased the expression of miR-146a-3p. Silencing NEAT1 (shNEAT1) increased miR-146a-3p expression, which was reduced by overexpressed NEAT1 (Figure 11b, p < 0.01).Moreover, we found that the inhibitory effect of overexpressed NEAT1 on chondrocytes was partially reversed by miR-146a-3p mimic (Figure 11c, p < 0.01), similarly, the effect of shNEAT1 on promoting chondrocyte proliferation was also partially reversed by miR-146a-3p inhibitor (Figure 11c, p < 0.01).
Figure 11.
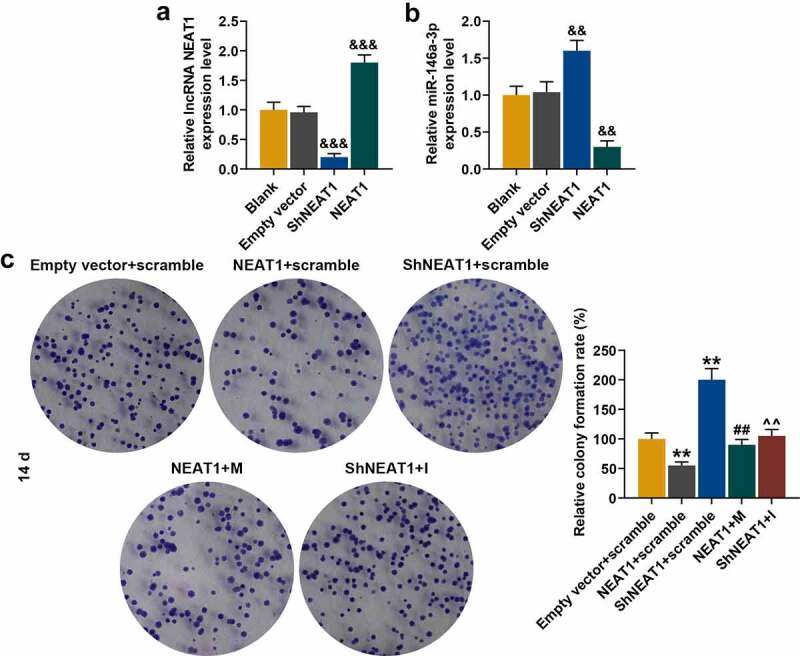
Effect of silenced or overexpressed NEAT1 on miR-146a-3p expression and normal chondrocyte proliferation. (a) QRT-PCR was used to detect the transfection rate of silencing or overexpressed NEAT1 in normal chondrocytes. GABDH was served as an internal reference. (b) QRT-PCR was used to detect the effect of silenced or overexpressed NEAT1 on miR-146a-3p mRNA level. U6 served as an internal reference. (c) The effects of silencing overexpressed NEAT1 and miR-146a-3p mimic and inhibitor on the chondrocyte proliferation ability were detected by cell colony formation assay. All experiments were repeated three times to average. Normal chondrocytes: CHON-001. && p < 0.01, &&& p < 0.001 vs. Empty vector; ** p < 0.01 vs. Empty vector + scramble; ## p < 0.01 vs. NEAT1 + scramble; ^^ p < 0.01 vs. silenced NEAT1 (ShNEAT1) + scramble
11. Effects of silenced/overexpressed NEAT1 and miR-146a-3p mimic/inhibitor on apoptosis and expressions of apoptosis-related proteins in chondrocytes
Flow cytometry was performed to analyze the effects of silencing and overexpressed NEAT1 and miR-146a-3p mimic/inhibitor on chondrocyte apoptosis, and the data showed that overexpressed NEAT1 promoted apoptosis, which was inhibited by shNEAT1 (Figure 12a, p < 0.05), but these effects were partially reversed by miR-146a-3p mimic and miR-146a-3p inhibitor, respectively (Figure 12a, p < 0.01). These differentially expressed apoptosis-related proteins were shown in Figure 12b. shNEAT1 increased the expression of Bcl-2 and decreased the protein levels of Bax and C caspase-3 (Figure 12b, p < 0.001), and overexpressed NEAT1 produced opposite regulatory effects to silencing NEAT1 (Figure 12b, p < 0.01). MiR-146a-3p mimic (for overexpressed NEAT1) and miR-146a-3p inhibitor (for shNEAT1) partially reversed the regulation of NEAT1 on apoptosis-related genes (Figure 12b, p < 0.05).
Figure 12.
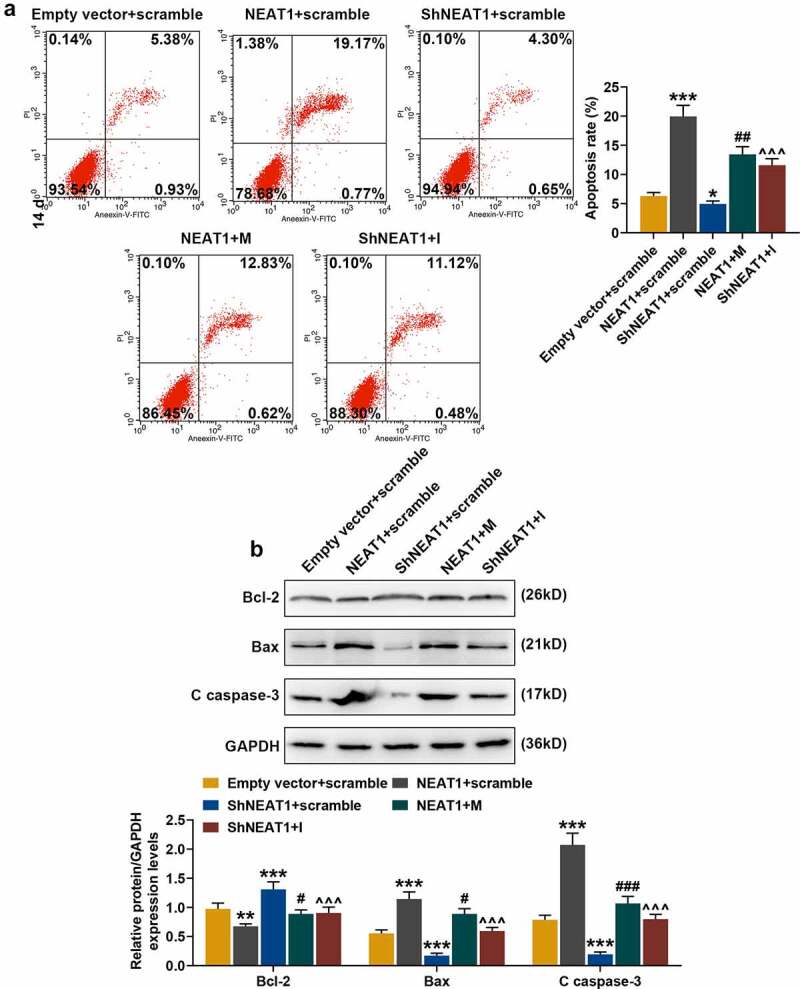
Effects of silenced/overexpressed NEAT1 and miR-146a-3p mimic/inhibitor on apoptosis and apoptosis-related proteins expression in normal chondrocytes. (a) The effects of silencing and overexpressed NEAT1 and miR-146a-3p mimic and inhibitor on normal chondrocyte apoptosis were examined by flow cytometry. (b) The effects of silencing and overexpressed NEAT1 and miR-146a-3p mimic and inhibitor on the expressions of apoptosis-related proteins in normal chondrocytes were detected by Western blot. GAPDH served as an internal reference. All experiments were repeated three times to average. Normal chondrocytes: CHON-001. * p < 0.05, ** p < 0.01, *** p < 0.001 vs. Empty vector + scramble; # p < 0.05, ## p < 0.01, ### p < 0.001 vs. NEAT1 + scramble; ^^^ p < 0.001 vs. ShNEAT1 + scramble
12. Effects of silencing and overexpressed NEAT1 and miR-146a-3p mimic and its inhibitor on chondrocyte migration, invasion and tube formation of HUVECs
The effects of silencing and overexpressed NEAT1 and miR-146a-3p mimic and inhibitor on chondrocyte migration, invasion, and tube formation of HUVECs were detected. Figure 13a and Figure 13b showed that shNEAT1 significantly promoted the migration and invasion of chondrocytes (Figure 13a-b, p < 0.01), while overexpression of NEAT1 had the opposite effect (Figure 13a-b, p < 0.01). However, the effect of overexpressed NEAT1 was partially reversed by miR-146a-3p mimic, and that of shNEAT1 was partially reversed by miR-146a-3p inhibitor (Figure 12a-b, p < 0.01). The results of the tube formation (Figure 13c) showed that shNEAT1 inhibited the ability of HUVECs to generate new blood vessels (Figure 13c, p < 0.05), and overexpressed NEAT1 significantly promoted the tube formation of HUVECs (Figure 13c, p < 0.01). The effect of overexpressed NEAT1 was partially reversed by miR-146a-3p mimic, and that of shNEAT1 was partially reversed by miR-146a-3p inhibitor (Figure 13c, p < 0.05).
Figure 13.
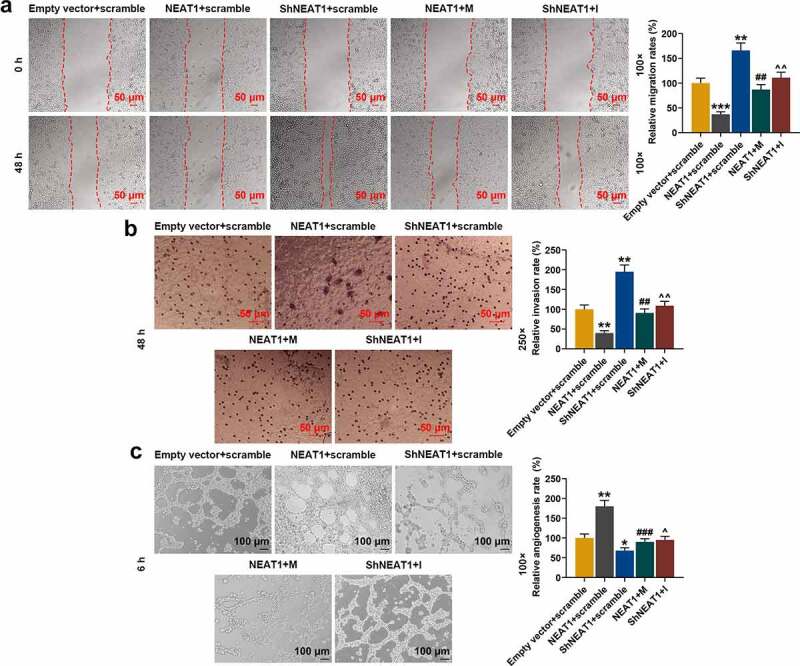
Effects of silencing and overexpressed NEAT1 and miR-146a-3p mimic and inhibitor on normal chondrocyte migration, invasion, and tube formation of HUVECs. (a) The effects of silencing and overexpressed NEAT1 and miR-146a-3p mimic and inhibitor on normal chondrocyte migration were examined by a scratch assay. The magnification was 100 times. (b) The effects of silencing and overexpressed NEAT1 and miR-146a-3p mimic and inhibitor on normal chondrocyte invasion ability were examined by Transwell assay. Magnification was 250 times. (c) The effects of silencing overexpressed NEAT1 and miR-146a-3p mimic and inhibitor on the tube formation ability of HUVECs were examined by tube formation assay. Magnification was 100 times. All experiments were repeated three times to average. Normal chondrocytes: CHON-001. * p < 0.05, ** p < 0.01, *** p < 0.001 vs. Empty vector + scramble; ## p < 0.01, ### p < 0.001 vs. NEAT1 + scramble; ^ p < 0.05, ^^ p < 0.01 vs. ShNEAT1 + scramble
Discussion
Consistent with the results of previous studies[14], the current study showed that TrkB expression was increased in the cartilage tissues derived from the OA patients and IL-1β-stimulated chondrocytes. Knockdown of TrkB was found to promote the metastasis and proliferation of chondrocytes, and inhibited the tube formation of HUVECs. In addition, ShcB expression was significantly increased in both the OA cartilage tissues and IL-1β-stimulated chondrocytes. ShcB is a member of the Sch family, and acts as an adapter protein in regulating upstream signaling and further activates downstream pathways to promote neuronal maturation[20]. Studies have confirmed that ShcB binds to Trk receptor in a phosphotyrosine-dependent manner via their N-terminal phosphotyrosine binding domain at Tyr[21]. Huang[22] confirmed that as a downstream gene of TrkB, Shc disrupts TrkB-Shc signaling and exacerbates hippocampal neuron death induced by epilepsy. Research has focused the role of ShcB in brain diseases, as it is mainly expressed in neural cells[23], and only one study relating ShcB to OA and reported that inhibition of Shc/Erk activation results in a loss of chondrocyte differentiation and cartilage capacity[24]. The current study was the first to confirm that ShcB expression is increased in OA patients, and that overexpressed ShcB could reverse the effect of shTrkB on physiological functions of chondrocytes.
We predicted and verified that miR-146a-3p was a target gene for TrkB, and their effects on OA were explored. MiR-146a is high-expressed in various inflammatory cells such as in T lymphocytes and macrophages[25]. Multiple studies found that miR-146a is an important factor for cartilage degradation and pain induced by OA, and its expression is inhibited in chondrocytes of advanced OA patients[26], which are consistent with the findings obtained in the current study. The mechanism of miR-146a intervention in OA has been widely reported. Taganov[27] showed that miRNA-146a/b can negatively regulate NF-κB-dependent genes; Li et al.[28] found that miRNA-146a regulates cartilage and synovial inflammation to relieve OA symptoms; Jin[29] indicated that miRNA-146a inhibits the Smad4 signaling pathway by increasing the expressions of vascular endothelial growth factor (VEGF) and TGF-β, thereby reducing chondrocyte apoptosis and cartilage mechanical damage; Nakasa[30] confirmed that overexpressed miR-146a reduces osteoclast formation and prevents joint destruction in arthritic mice; Zhang[31] demonstrated that miR-146a regulates Camk2d/Ppp3r2 to maintain cartilage homeostasis in OA treatment. In this study, miR-146a-3p negatively regulates TrkB expression, miR-146a-3p inhibitor partially reversed the effect of shTrkB on chondrocytes, and miR-146a-3p promotes chondrocyte apoptosis by reducing Bcl-2 expression and increasing the expressions of Bax and C caspase3.
The target LncRNA NEAT1 of miR-146a-3p was first discovered in 2007[32]. NEAT1 is transcribed from chromosome 11 and is an important part of the subnuclear plaques involved in the formation and maintenance of plaques[32]. Studies found that NEAT1 is abnormally expressed in a variety of tumors and is related to tumor formation, treatment and prognosis, and is involved in tumor cell survival and proliferation, cell cycle, apoptosis, invasion and metastasis, and cell differentiation[33]. In the study on the mechanism of NEAT1 intervention in tumors, NEAT1 has been found to play an important role in immune and inflammatory responses. The combination of NEAT1 and splicing factor proline/glutamine-rich (SFPQ) activates the transcription of IL-8, which has critical functions in the innate immune response through the transcriptional regulation of antiviral genes[34]; Huang[35] proposed that knocking down NEAT1 may attenuate the ability of megakaryocytes to clear intracellular mycobacterium tuberculosis; Liu[36] confirmed that NEAT1, which is high-expressed in inflammatory bowel disease, participates in the inflammatory response of the disease by regulating the intestinal epithelial barrier and macrophage polarization; the mechanism of NEAT1 on regulating inflammatory response may be realized through the regulation of MAPK signaling and NF-κB signaling pathways [37,38]. Studies on NEAT1 and OA found that knockdown of NEAT1 inhibits inflammation, apoptosis, and reduces the production of extracellular matrix[39]. This is consistent with our experimental results that knockdown of NEAT1 promoted the proliferation, migration and invasion of chondrocytes, inhibited apoptosis, and reversed the regulation of miR-146a-3p inhibitor on the physiological function of chondrocytes.
In conclusion, TrkB expression is increased in the OA cartilage tissues and IL-1β-induced chondrocytes. Knocking down TrkB improves the biological function of IL-1β-induced chondrocytes. Functional experimental studies prove that TrkB regulates the development and function of chondrocytes via the NEAT1/miR-146a-3p/TrkB/ShcB axis.
Acknowledgments
Not applicable
Funding Statement
This work was supported by grants from the National Natural Science Foundation of China [81502817].
Disclosure statement
No potential conflict of interest was reported by the author(s).
Availability of Data and Materials
The analyzed data sets generated during the study are available from the corresponding author on reasonable request.
References
- [1].Barnett R. Osteoarthritis. Lancet. 2018;391(10134):1985. [DOI] [PubMed] [Google Scholar]
- [2].Nelson AE. Osteoarthritis year in review 2017: clinical. Osteoarthritis Cartilage. 2018;26(3):319–325. [DOI] [PMC free article] [PubMed] [Google Scholar]
- [3].Pereira D, Ramos E, Branco J. Osteoarthritis. Acta Médica Portuguesa. 2015;28(1):99–106. [DOI] [PubMed] [Google Scholar]
- [4].Taruc-Uy RL, Lynch SA. Diagnosis and treatment of osteoarthritis. Primary Care: Clinics in Office Practice. 2013;40(4):821–836. [DOI] [PubMed] [Google Scholar]
- [5].Bijlsma JW, Berenbaum F, Lafeber FP. Osteoarthritis: an update with relevance for clinical practice. Lancet. 2011;377(9783):2115–2126. [DOI] [PubMed] [Google Scholar]
- [6].Liebherr JK. The Mecyclothorax beetles (Coleoptera, Carabidae, Moriomorphini) of Tahiti, Society Islands. ZooKeys. 2013;322:1–170. [DOI] [PMC free article] [PubMed] [Google Scholar]
- [7].Atukorala I, Kwoh CK, Guermazi A, et al. Synovitis in knee osteoarthritis: a precursor of disease? Ann Rheum Dis. 2016;75(2):390–395. [DOI] [PMC free article] [PubMed] [Google Scholar]
- [8].Xia B, Di C, Zhang J, et al. Osteoarthritis pathogenesis: a review of molecular mechanisms. Calcif Tissue Int. 2014;95(6):495–505. [DOI] [PMC free article] [PubMed] [Google Scholar]
- [9].Lambova SN, Muller-Ladner U. Editorial: osteoarthritis - Current Insights in Pathogenesis, Diagnosis and Treatment. Curr Rheumatol Rev. 2018;14(2):91–97. [DOI] [PubMed] [Google Scholar]
- [10].Bratus-Neuenschwander A, Castro-Giner F, Frank-Bertoncelj M, et al. Changes in synovium of knee osteoarthritis patients. Genes (Basel). 2018;9(7):338. [DOI] [PMC free article] [PubMed] [Google Scholar]
- [11].Lange AM, Lo HW. Inhibiting TRK proteins in clinical cancer therapy. Cancers (Basel). 2018;10(4):105. [DOI] [PMC free article] [PubMed] [Google Scholar]
- [12].Sousa-Valente J, Calvo L, Vacca V, et al. Role of TrkA signalling and mast cells in the initiation of osteoarthritis pain in the monoiodoacetate model. Osteoarthritis Cartilage. 2018;26(1):84–94. [DOI] [PubMed] [Google Scholar]
- [13].Grimsholm O, Rantapaa-Dahlqvist S, Dalen T, et al. BDNF in RA: downregulated in plasma following anti-TNF treatment but no correlation with inflammatory parameters. Clin Rheumatol. 2008;27(10):1289–1297. [DOI] [PubMed] [Google Scholar]
- [14].Gowler PRW, Li L, Woodhams SG, et al. Peripheral brain-derived neurotrophic factor contributes to chronic osteoarthritis joint pain. Pain. 2020;161(1):61–73. [DOI] [PubMed] [Google Scholar]
- [15].Swingler TE, Niu L, Smith P, et al. The function of microRNAs in cartilage and osteoarthritis. Clin Exp Rheumatol. 2019;37(Suppl 120):40–47. [PubMed] [Google Scholar]
- [16].Endisha H, Rockel J, Jurisica I, et al. The complex landscape of microRNAs in articular cartilage: biology, pathology, and therapeutic targets. JCI Insight. 2018;3(17):e121630. [DOI] [PMC free article] [PubMed] [Google Scholar]
- [17].Liu L, Gu H, Liu H, et al. Protective effect of resveratrol against IL-1β-induced inflammatory response on human osteoarthritic chondrocytes partly via the TLR4/MyD88/NF-κB signaling pathway: an “in vitro study”. Int J Mol Sci. 2014;15(4):6925–6940. [DOI] [PMC free article] [PubMed] [Google Scholar]
- [18].Kim B. Western Blot Techniques. Methods Mol Biol. 2017;1606:133–139. [DOI] [PubMed] [Google Scholar]
- [19].Schmittgen TD, Livak KJ. Analyzing real-time PCR data by the comparative CT method. Nat Protoc. 2008;3(6):1101–1108. [DOI] [PubMed] [Google Scholar]
- [20].Sakai R, Henderson JT, O’Bryan JP, et al. The mammalian ShcB and ShcC phosphotyrosine docking proteins function in the maturation of sensory and sympathetic neurons. Neuron. 2000;28(3):819–833. [DOI] [PubMed] [Google Scholar]
- [21].Liu HY, Meakin SO. ShcB and ShcC activation by the Trk family of receptor tyrosine kinases. J Biol Chem. 2002;277(29):84–94. [DOI] [PubMed] [Google Scholar]
- [22].Huang YZ, He XP, Krishnamurthy K, et al. TrkB-Shc signaling protects against hippocampal injury following status epilepticus. J Neurosci. 2019;39(23):61–73. [DOI] [PMC free article] [PubMed] [Google Scholar]
- [23].Ponti G, Conti L, Cataudella T, et al. Comparative expression profiles of ShcB and ShcC phosphotyrosine adapter molecules in the adult brain. Neuroscience. 2005;133(1):105–115. [DOI] [PubMed] [Google Scholar]
- [24].Schulze-Tanzil G, Mobasheri A, de Souza P, et al. Loss of chondrogenic potential in dedifferentiated chondrocytes correlates with deficient Shc–Erk interaction and apoptosis. Osteoarthritis Cartilage. 2004;12(6):448–458. [DOI] [PubMed] [Google Scholar]
- [25].He X, Tang R, Sun Y, et al. MicroR-146 blocks the activation of M1 macrophage by targeting signal transducer and activator of transcription 1 in hepatic schistosomiasis. EBioMedicine. 2016;13:339–347. [DOI] [PMC free article] [PubMed] [Google Scholar]
- [26].Miyaki S, Asahara H. Macro view of microRNA function in osteoarthritis. Nat Rev Rheumatol. 2012;8(9):26046–26056. [DOI] [PMC free article] [PubMed] [Google Scholar]
- [27].Taganov KD, Boldin MP, Chang KJ, et al. NF- B-dependent induction of microRNA miR-146, an inhibitor targeted to signaling proteins of innate immune responses. Proc Natl Acad Sci U S A. 2006;103(33):4624–4626. [DOI] [PMC free article] [PubMed] [Google Scholar]
- [28].Li X, Kroin JS, Kc R, et al. Altered spinal microRNA-146a and the microRNA-183 cluster contribute to osteoarthritic pain in knee joints. J Bone Miner Res. 2013;28(12):2512–2522. [DOI] [PMC free article] [PubMed] [Google Scholar]
- [29].Jin L, Zhao J, Jing W, et al. Role of miR-146a in human chondrocyte apoptosis in response to mechanical pressure injury in vitro. Int J Mol Med. 2014;34(2):451–463. [DOI] [PMC free article] [PubMed] [Google Scholar]
- [30].Nakasa T, Shibuya H, Nagata Y, et al. The inhibitory effect of microRNA-146a expression on bone destruction in collagen-induced arthritis. Arthritis Rheumatism. 2011;63(6):1582–1590. [DOI] [PubMed] [Google Scholar]
- [31].Zhang X, Wang C, Zhao J, et al. miR-146a facilitates osteoarthritis by regulating cartilage homeostasis via targeting Camk2d and Ppp3r2. Cell Death Dis. 2017;8(4):e2734. [DOI] [PMC free article] [PubMed] [Google Scholar]
- [32].Sasaki YT, Ideue T, Sano M, et al. MENε/β noncoding RNAs are essential for structural integrity of nuclear paraspeckles. Proc Natl Acad Sci U S A. 2009;106(8):2525–2530. [DOI] [PMC free article] [PubMed] [Google Scholar]
- [33].Yu X, Li Z, Zheng H, et al. NEAT1: a novel cancer-related long non-coding RNA. Cell Prolif. 2017;50(2):e12329. [DOI] [PMC free article] [PubMed] [Google Scholar]
- [34].Imamura K, Imamachi N, Akizuki G, et al. Long noncoding RNA NEAT1-dependent SFPQ relocation from promoter region to paraspeckle mediates IL8 expression upon immune stimuli. Mol Cell. 2014;53(3):393–406. [DOI] [PubMed] [Google Scholar]
- [35].Huang S, Huang Z, Luo Q, et al. The Expression of lncRNA NEAT1 in human tuberculosis and its antituberculosis effect. Biomed Res Int. 2018;2018:9529072. [DOI] [PMC free article] [PubMed] [Google Scholar]
- [36].Liu R, Tang A, Wang X, et al. Inhibition of lncRNA NEAT1 suppresses the inflammatory response in IBD by modulating the intestinal epithelial barrier and by exosome-mediated polarization of macrophages. Int J Mol Med. 2018;42:2903–2913. [DOI] [PubMed] [Google Scholar]
- [37].Zhang F, Wu L, Qian J, et al. Identification of the long noncoding RNA NEAT1 as a novel inflammatory regulator acting through MAPK pathway in human lupus. J Autoimmun. 2016;75:96–104. [DOI] [PubMed] [Google Scholar]
- [38].Chen Y, Qiu J, Chen B, et al. RETRACTED: long non-coding RNA NEAT1 plays an important role in sepsis-induced acute kidney injury by targeting miR-204 and modulating the NF-κB pathway. Int Immunopharmacol. 2018;59:252–260. [DOI] [PubMed] [Google Scholar]
- [39].Liu F, Liu X, Yang Y, et al. NEAT1/miR-193a-3p/SOX5 axis regulates cartilage matrix degradation in human osteoarthritis. Cell Biol Int. 2019;44(4):947–957. [DOI] [PubMed] [Google Scholar]
Associated Data
This section collects any data citations, data availability statements, or supplementary materials included in this article.
Data Availability Statement
The analyzed data sets generated during the study are available from the corresponding author on reasonable request.


