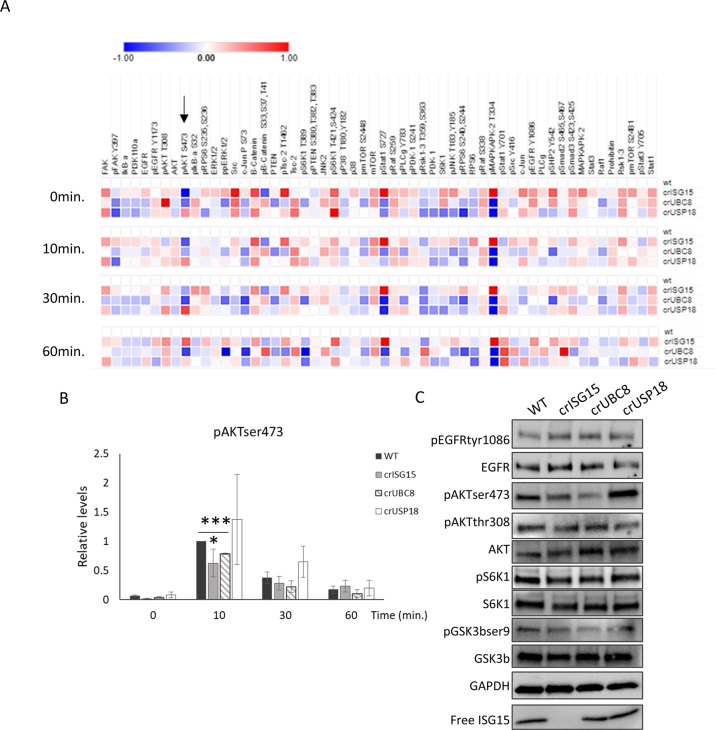
Fig. 3. Loss of ISGylation is associated with decreased Akt phosphorylation.
A RPPA analysis performed in WT and the different ISGylation CRISPR clones, treated with EGF 10 ng/ml for 0, 10, 30 and 60 min. Heatmap displays the Log2 of intensity normalised to WT at the different time points. Arrow indicates pAkt data. Averaged, n = 3 B Bar graph of pAkt intensities obtained in the RPPA. Values displayed are the mean ± S.E.M. n = 3. C Confirmation of RPPA data by WB analysis. Cells were treated with EGF 10 ng/ml for 10 min, WB and incubated with indicated antibodies.

