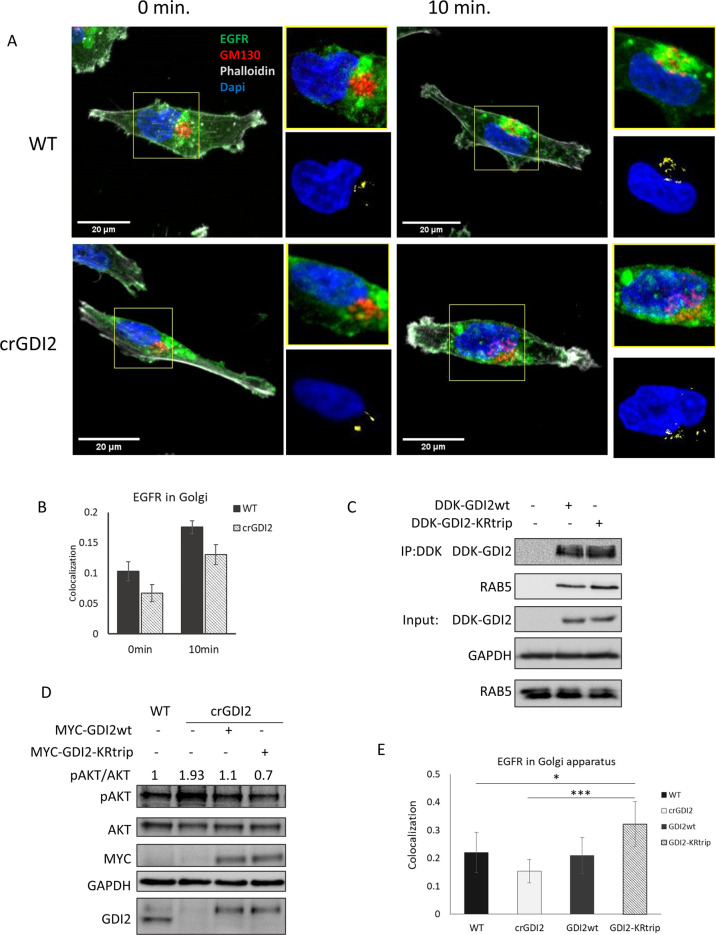
Fig. 6. ISGylation of GDI2 reduces its activity and increases Akt activation.
A Representative confocal images, obtained at 60x, of WT and crGDI2 cells pre-treated with cycloheximide for 15 min. and stimulated for 10 min. with EGF 10 ng/ml. EGFR in green, GM130 as Golgi marker in red, phalloidin in grey and DAPI, in blue. At top right of each image, zoom of Golgi structure displayed. At bottom right of each image, visualisation of the co-localisation between EGFR and the Golgi marker GM130 of the images in yellow and DAPI, in blue as reference. 20 µm scale bars are displayed in the bottom-left corner. B Bar graph shows the average EGFR-GM130 co-localisation showed in A using Costes method, average ± SD; n = 8 field of view. C WB of WT cells transfected with MYC-DDK-GDI2wt, or MYC-DDK-GDI2-KRtrip and after 48 h were lysed and subjected to Flag IP. GDI2 activity was measured by the levels of Rab5 detected in the pulldowns. Blots show the pulldowns and a 5% of the total lysates (Input). D Analysis of the effect GDI2-KRtrip has on Akt activation. WB of lysates from WT cells, crGDI2 cells, crGDI2 cells transfected GDI2wt or GDI2-KRtrip, treated for 10 min. with EGF. Values at in the upper part of the WB show the pAkt/Akt ratio as measure of Akt activation, normalised to the ratio in WT cells. E Quantification of EGFR-GM130 co-localisation displayed in Fig. S7. Bar graph of the average EGFR co-localisation with GM130 using Costes method ± SD of WT cells, crGDI2 cells, crGDI2 transfected with GDI2 expression vector, GDI2wt, or with the mutant GDI2, GDI2-KRtrip, treated for 10 min. with EGF. n = 8 fields of view. p value < 0.05 (*), p value < 0.005 (***).

