Doi: https://doi.org/10.1093/plcell/koab068
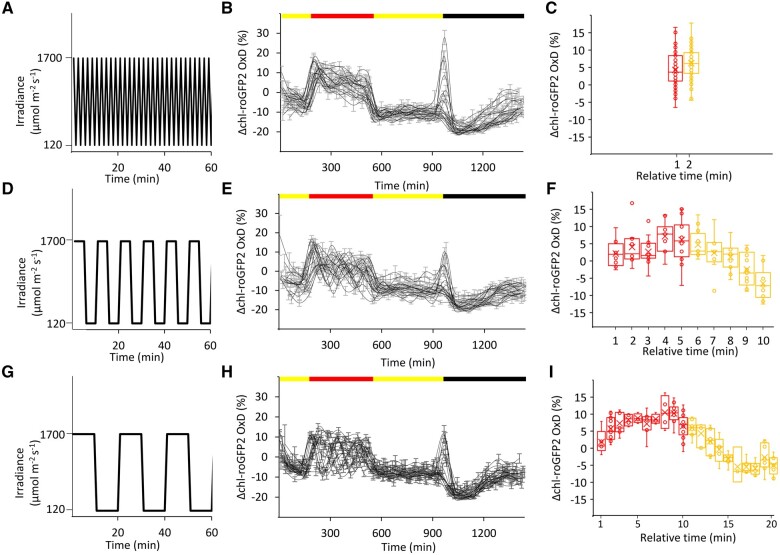
During production of the corrected proof of this article, Figure 3 was inadvertently replaced with a duplicate of Figure 4. The correct Figure 3 appears below and replaces the version in the corrected proof. The publisher apologizes for the error.
Figure 3.
Diurnal changes in chl-roGFP2 OxD under fluctuating light conditions. (A, D, G) Light irradiance during time over a 60-min period, extracted from the fluctuating light phase, is presented for the applied intervals of 1, 5 and 10 min. (B, E, H) Changes in chl-roGFP2 OxD values (ΔOxD) over time in Arabidopsis plants expressing chl-TKTP-roGFP2. After the start of the illumination period (yellow bar, 120 µmol m−2 s−1 for 3 h), the regime was switched to fluctuating light (red bar), alternating between HL (1700 µmol m−2 s−1) and normal light (120 µmol m−2 s−1) with different intervals. After 6 h fluctuating light, illumination remained at 120 µmol m−2 s−1 for 7 h before the diurnal cycle ended with 8 h darkness (black bar). Oxidation values were normalized to steady state values (as observed during the day at constant light conditions of 120 µmol m−2 s−1). Each black line represents the oxidation dynamics recorded for an independent well plate which consists of 8 plants. Values represent means of these 8 plants ± SE. (C, F, I) ΔOxD as a function of relative time (min) within each fluctuating light cycle. Values measured during the HL (1700 µmol m−2 s−1) phases within each light cycle are presented in red. Values measured during the phases with normal light intensities (120 µmol m−2 s−1) during each light cycle are presented in yellow. The presented box spans the interquartile range, and whiskers represent the minimum and maximum values (not including outliers). The median and mean of at least six plants are marked by a vertical line and x sign inside the box, respectively.


