

Abstract
The migratory cardiac neural crest cells (CNCCs) contribute greatly to cardiovascular development. A thorough understanding of the cell lineages, developmental chronology, and transcriptomic states of CNCC derivatives during normal development is essential for deciphering the pathogenesis of CNCC‐associated congenital anomalies. Here, we perform single‐cell transcriptomic sequencing of 34,131 CNCC‐derived cells in mouse hearts covering eight developmental stages between E10.5 and P7. We report the presence of CNCC‐derived mural cells that comprise pericytes and microvascular smooth muscle cells (mVSMCs). Furthermore, we identify the transition from the CNCC‐derived pericytes to mVSMCs and the key regulators over the transition. In addition, our data support that many CNCC derivatives had already committed or differentiated to a specific lineage when migrating into the heart. We explore the spatial distribution of some critical CNCC‐derived subpopulations with single‐molecule fluorescence in situ hybridization. Finally, we computationally reconstruct the differentiation path and regulatory dynamics of CNCC derivatives. Our study provides novel insights into the cell lineages, developmental chronology, and regulatory dynamics of CNCC derivatives during development.
Keywords: cardiac neural crest cell, embryonic development, mural cell, neonatal development, single‐cell RNA‐seq
Subject Categories: Cardiovascular System, Development, Methods & Resources
A single‐cell transcriptomic atlas of mouse cardiac neural crest cell (CNCC) derivatives reveals that many had already committed or differentiated to a specific lineage when migrating into the heart.
Introduction
Neural crest cells (NCCs) are a multipotent, migratory cell population that delaminates from the dorsal part of the neural tube via epithelial‐to‐mesenchymal transition (Bhatt et al, 2013). During embryogenesis, migratory NCCs give rise to a plethora of cell lineages and contribute to the development of a variety of tissues and organs, such as the skull bones, adrenal gland, enteric nervous system, and heart (Szabó & Mayor, 2018). While the heart is mostly of mesodermal origin, NCCs, which are ectodermal derivatives, contribute greatly to heart development (Sieber‐Blum, 2004). The subpopulation of NCCs contributing to the heart is referred to as cardiac NCCs (CNCCs) (Plein et al, 2015). Since these cells were first discovered by Kirby et al (1983), CNCCs have been demonstrated to play essential roles in cardiovascular development including the remodeling of the pharyngeal arch arteries, cardiac outflow tract (OFT) septation, valvulogenesis, and cardiac innervation (Keyte & Hutson, 2012). Genetic or environmental disturbance of the migration, survival, and differentiation of CNCCs may result in congenital cardiovascular anomalies. Various human syndromes involving severe congenital heart defects have been associated with CNCCs, such as DiGeorge, Noonan, and CHARGE syndromes (Keyte & Hutson, 2012; Plein et al, 2015). A thorough understanding of the cell lineages, transcriptomic states, and regulatory networks of CNCC derivatives during normal development is essential for deciphering the pathogenesis of these CNCC‐associated congenital cardiovascular anomalies.
In recent decades, significant advances in understanding the CNCC contributions to heart development have been made by using lineage tracing mouse models such as Wnt1‐Cre mice (Jiang et al, 2000), although some aspects remain contentious. In these models, all CNCCs and their derivatives are genetically labeled by the Cre‐loxP recombinase system and observed via LacZ staining or fluorescence imaging (imaging‐based lineage tracing) (Wu et al, 2019). After delamination from the neural tube (embryonic day 8.5, E8.5), CNCC derivatives first colonize the pharyngeal arch artery and ultimately differentiate into vascular smooth muscle cells (VSMCs) of the aortic arch (Plein et al, 2015). Starting at E10.5, CNCC‐derived mesenchymal cells migrate into the OFT and join the cushion mesenchyme, where they participate in the formation of the aorticopulmonary septum for complete separation of the pulmonary and systemic circulation (Lin et al, 2012). These CNCC‐derived mesenchymal cells eventually give rise to part of the smooth muscle walls of the great arteries (Sawada et al, 2017). The remodeling of OFT cushions also results in the formation of semilunar valvular leaflets, among which CNCC derivatives mainly contribute to the two leaflets adjacent to the aorticopulmonary septum (Jiang et al, 2000; Nakamura et al, 2006). CNCCs have also been suggested to directly contribute to the smooth muscle walls of the proximal coronary arteries (Jiang et al, 2000; Arima et al, 2012). In addition to the entry point described above (i.e., the arterial pole of the heart), CNCC derivatives enter the heart from a second entry point, the venous pole at E12.5, whereby they penetrate the heart and migrate into the atrioventricular valves (Poelmann et al, 2004; Nakamura et al, 2006). All the melanocytes in atrioventricular valves are derived from CNCCs (Nakamura et al, 2006).
In addition, neurons and glial cells derived from CNCCs contribute to the parasympathetic innervation of the heart (Nakamura et al, 2006; Hildreth et al, 2008). CNCC‐derived neurons in the heart were first observed at E11.5 (Hildreth et al, 2008; Végh et al, 2016). Although it has been suggested that CNCCs are required for normal development of the cardiac conduction system (CCS), it remains contentious whether CNCCs directly contribute to the CCS, which is known to be derived from the myocardium (myocardial conducting cells) (Keyte & Hutson, 2012; Plein et al, 2015). Likewise, the presence of CNCC‐derived cardiomyocytes in amniotes (e.g., mice) remains controversial (Engleka et al, 2005; Plein et al, 2015), although the contribution of CNCCs to myocardium has been demonstrated in non‐amniotic vertebrates, for example, zebrafish (Cavanaugh et al, 2015; Tang et al, 2019).
Mural cells include pericytes that discontinuously ensheath capillaries and microvascular smooth muscle cells (mVSMCs) that cover larger caliber vessels of the microcirculation as well as their transitional cells (Avolio & Madeddu, 2016; Holm et al, 2018). Neural crest‐derived mural cells have been identified in various organs, such as the brain, retina, head, and thymus (Zachariah & Cyster, 2010; Trost et al, 2013). However, one previous study did not find any CNCC‐derived mural cells in the heart ventricle at E14.5 using lineage tracing (Chen et al, 2016). Given that only one developmental stage was examined in the previous study, it remains an open question whether CNCCs contribute to cardiac mural cells.
It has become increasingly evident that even at the beginning of the migration from the neural tube, the NCCs are heterogeneous, comprising multipotent cells, cells whose differentiation potential are restricted to varying degrees (fate‐restricted cells), and even precursors committed to a particular lineage (Kalcheim, 2006). Although transcriptomic states have been investigated for pre‐migratory or early migrating NCCs in the dorsal neural tube of the embryo (Lignell et al, 2017; Tani‐Matsuhana et al, 2018; Ling & Sauka‐Spengler, 2019; Soldatov et al, 2019), little is known regarding the states of CNCC derivatives and their differentiation potential when they arrive at the heart or during embryonic and neonatal development of the heart.
One obvious drawback of imaging‐based lineage tracing is that it cannot provide detailed molecular information about cell state transitions (Wu et al, 2019). Recent technical advances in large‐scale single‐cell RNA‐seq have enabled the transcriptomes of tens of thousands of cells to be assayed at a single‐cell resolution (Zheng et al, 2017). As a complement to conventional imaging‐based lineage tracing, large‐scale single‐cell RNA‐seq allows unbiased cellular heterogeneity dissection, molecular signature identification, and developmental trajectory reconstruction at an unprecedented scale and resolution. Large‐scale time‐series single‐cell RNA‐seq is becoming a powerful tool for studying the development of complex tissues, organs, and even whole organisms (Plass et al, 2018; Cao et al, 2019). However, to our knowledge, the transcriptomic landscape of CNCC derivatives during embryonic and neonatal development of the heart has not yet been examined at a single‐cell resolution.
Here, we performed single‐cell RNA‐seq of CNCC derivatives in mouse hearts from eight developmental stages between E10.5 and P7 (postnatal day 7). We sought to systematically characterize the cell lineages, define the developmental chronology and elucidate the regulatory dynamics of CNCC derivatives during embryonic and neonatal development.
Results
Single‐cell transcriptomic sequencing of CNCC derivatives during embryonic and neonatal development
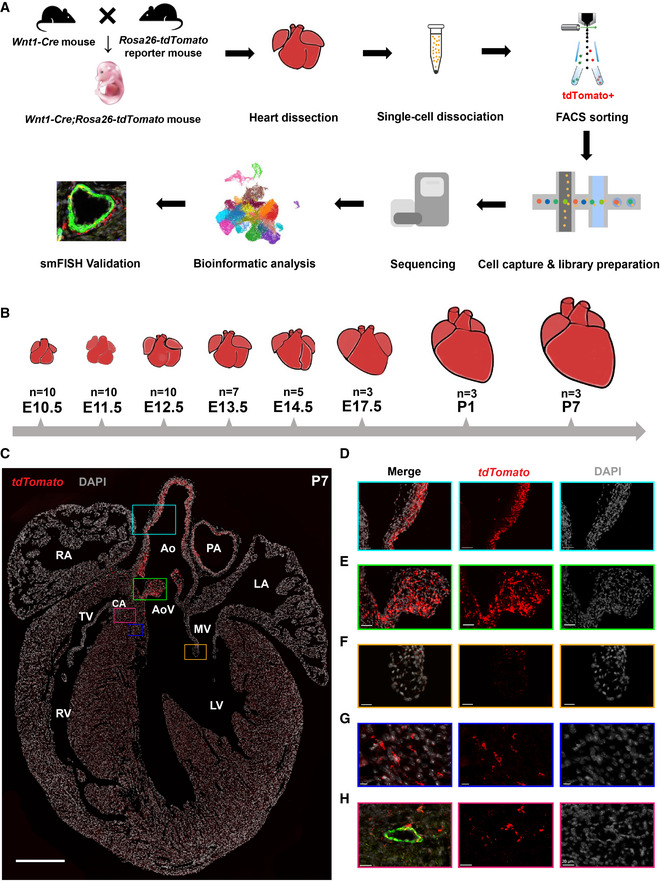
To investigate the transcriptomic landscape of CNCC derivatives during development, we used the Wnt1‐Cre;Rosa26‐tdTomato mouse model to specifically label CNCC‐derived cells (Fig 1A). Whole hearts were dissociated, and tdTomato‐positive cells were sorted for single‐cell capture. The developmental stages we selected spanned from the very early time when CNCC derivatives arrived at the cardiac OFT during embryonic development (i.e., E10.5) (Lin et al, 2012) to neonatal stage P7 (Fig 1B). 10X Genomics Chromium Single Cell 3′ transcriptomic sequencing libraries were constructed and subjected to sequencing. The sequencing quality metrics were similar across samples, reflecting relatively little technical variation (Table EV1). After stringent quality control, we obtained high‐quality single‐cell transcriptomes of 34,131 CNCC‐derived cells from eight stages. UMAP plots showing UMI count, gene count, S phage score, G2M phase score, the proportion of the UMI count of mitochondrial genes, and Scrublet doublet score were in Fig EV1. To facilitate further data exploration, we developed a web‐based interface for our dataset (http://scrnaseqcncc.fwgenetics.org) that permits interactive examination of expression for any gene of interest.
Figure 1. Single‐cell RNA‐seq and spatial distribution of the CNCC derivatives in mice.
-
ASchematic representation of the experimental procedure.
-
BThe developmental stages at which the hearts were sampled. Multiple hearts were pooled as a sample for each stage.
-
CThe spatial distribution of the CNCC derivatives labeled by tdTomato. It was stained for tdTomato, Myh11, and Pdgfra, and the same staining with all channels is shown in Appendix Fig S1. Scale bar: 500 μm.
-
D–HMagnified views of the rectangular regions in (C). The same regions are indicated by the same colors. In (H), the vessel wall is indicated by the green fluorescence of the VSMC marker Myh11. Scale bar in (D): 50 μm. Scale bar in (E): 40 μm. Scale bar in (F): 20 μm. Scale bar in (G): 10 μm. Scale bar in (H): 20 μm.
Data information: Ao, aorta; AoV, aortic valve; CA, coronary artery; LA, left atrium; LV, left ventricle; MV, mitral valve; PA, pulmonary artery; RA, right atrium; RV, right ventricle; TV, tricuspid valve.
Figure EV1. UMAP plots showing the distributions of quality metrics and each sample before/after CCA integration.
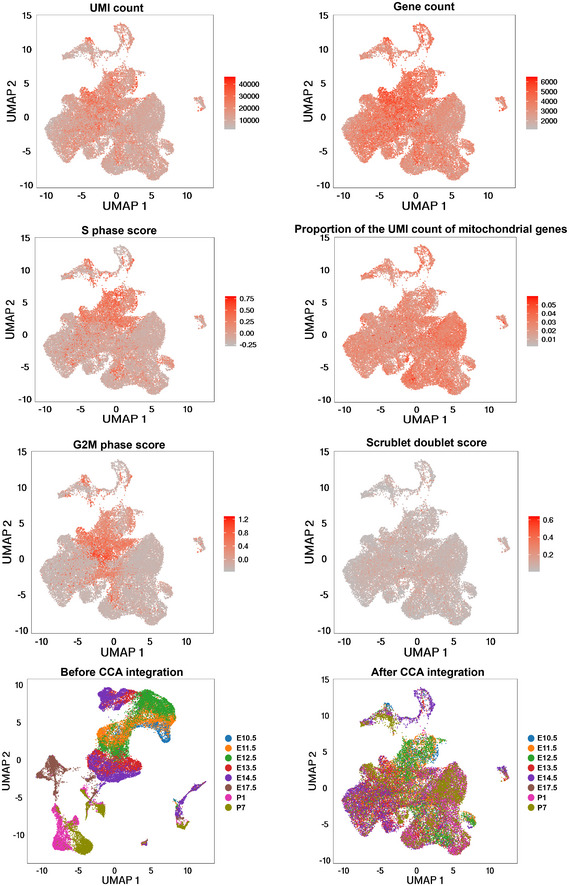
The distributions of the quality metrics including UMI count, gene count, S phase score, G2M phase score, the proportion of the UMI count of mitochondrial genes, and Scrublet doublet score are shown.
The spatial distribution of the CNCC derivatives
The visualization of tdTomato‐positive cells by single‐molecule fluorescence in situ hybridization (smFISH) enabled us to accurately obtain spatial distribution information for the CNCC derivatives (Fig 1C; Appendix Fig S1). At neonatal stage P7, we observed a large number of tdTomato‐positive cells in the walls of the aorta and pulmonary artery (Fig 1C and D) as well as the aortic (Appendix Fig S2A) and pulmonary (Appendix Fig S2B) valve leaflets (Fig 1E), reflecting the great contribution of CNCCs to the OFT development. Notably, our smFISH results indicated that CNCC‐derived cells only populated the inner medial cells of both ascending aorta and aortic root (Fig 1C and D; Appendix Fig S3A–H), thus supporting the view put forth in the most recent report about the distribution of CNCC‐ and SHF‐derived VSMCs (Sawada et al, 2017). Consistent with previous reports (Jiang et al, 2000; Nakamura et al, 2006), the CNCC derivatives were found mainly in the two leaflets adjacent to the aorticopulmonary septum of aortic and pulmonary valves (i.e., right and left leaflets) (Appendix Fig S2). Compared with the aortic and pulmonary valves (Fig 1E), the CNCCs made a much smaller contribution to the atrioventricular valves (Fig 1F), which is consistent with the previous report (Nakamura et al, 2006). In addition, tdTomato‐positive cells were found to be embedded in the walls of ventricles (Fig 1G), but they were not cardiomyocytes (Fig EV2). CNCC‐derived VSMCs were observed in the coronary vasculature, as evidenced by the co‐expression of tdTomato and a specific marker for mature VSMCs (i.e., Myh11; Fig 1H; Appendix Fig S1).
Figure EV2. Immunofluorescence staining of the P7 heart with td‐Tomato, cTnT, and DAPI.
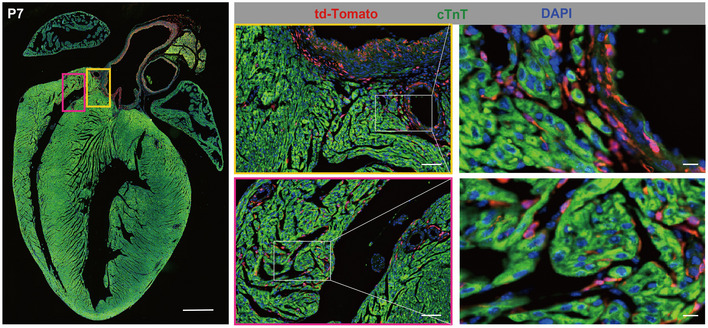
The staining shows that the tdTomato‐positive cells in the ventricle of the mouse heart were not co‐stained with the myocardial marker cTnT. Scale bar: 500 μm for the left large panel, 50 μm for the middle panels, and 10 μm for the right panels.
Cell lineages and states of the CNCC derivatives during embryonic and neonatal development
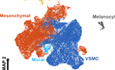
After recognizing the spatial distribution of the CNCC derivatives, we systematically dissected the cell lineages and transcriptomic states of the CNCC derivatives. The unsupervised clustering of the 34,131 CNCC‐derived cells from eight stages identified 21 cell clusters, which represent different cell lineages or states during development (Fig 2A). Six cell lineages were revealed by hierarchical clustering of the clusters based on the average expression of 2,000 selected features (Fig 2B) and the expression of established markers (Fig 2C). The representative molecular signatures for each cluster are shown in Fig 2D (Dataset EV1).
Figure 2. Cell lineages and transcriptomic states of CNCC derivatives during embryonic and neonatal development.
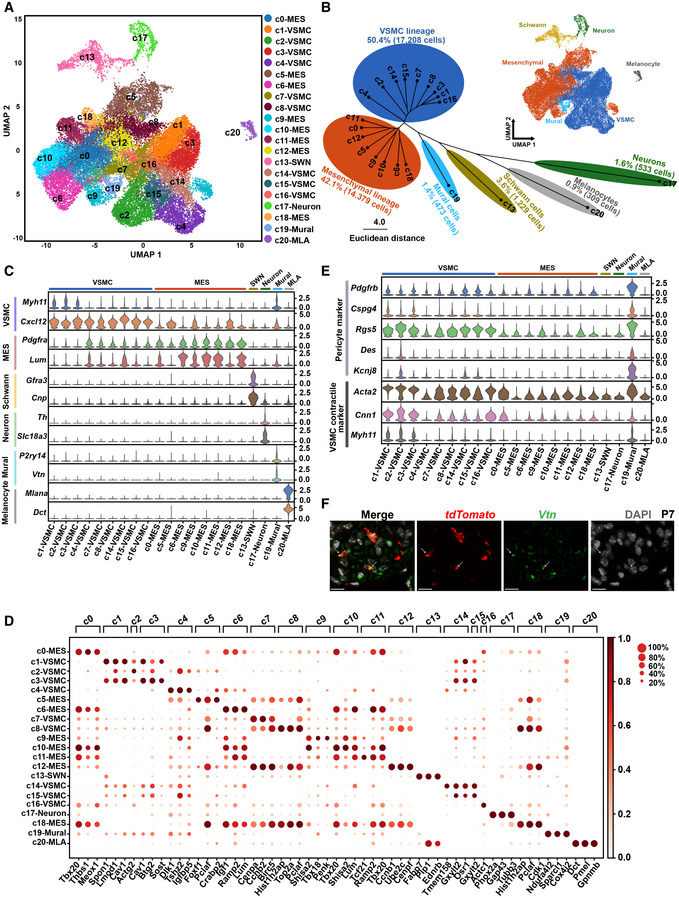
- Single‐cell transcriptomes of 34,131 CNCC derivatives projected on a two‐dimensional UMAP embedding. Clusters are distinguished by different colors.
- Hierarchical clustering of the clusters based on the average expression of 2,000 selected features. The small panel shows cells colored by lineages.
- Expression of established markers for each cell lineage in each cluster.
- Representative molecular signatures for each cluster. The area of the circles denotes the proportion of cells expressing the gene, and the color intensity reflects the expression intensity.
- Expression of canonical pericyte markers and VSMC contractile markers.
- smFISH validation of CNCC‐derived pericytes. Hearts from P7 mice were used. Arrows indicate the co‐expression of tdTomato and the pericyte marker Vtn. Scale bar: 10 μm.
Data information: MES, mesenchymal cell; MLA, melanocyte; SWN, Schwann cell; UMAP, uniform manifold approximation and projection; VSMC, vascular smooth muscle cell.
The VSMC (c1, c2, c3, c4, c7, c8, c14, c15, and c16; marked by the mature VSMC marker Myh11 and the immature VSMC marker Cxcl12) (Sinha et al, 2014; Liu et al, 2019) and mesenchymal (c0, c5, c6, c9, c10, c11, c12, and c18; marked by Pdgfra and Lum) (Camp et al, 2015; Farahani & Xaymardan, 2015) lineages constituted the two largest lineages of the CNCC derivatives (accounting for 50.4 and 42.1% of the derivatives, respectively). The representative markers that distinguish each subpopulation from one another of the VSMC and mesenchymal lineages are shown in Fig EV3A and B, respectively, and many of them represent novel markers of these previously unrecognized cellular states. For example, the VSMC subpopulations c1 and c3 were distinguishable by the expression levels of markers such as Bcam, Cebpb, and Ppp1r15a. Consistent with the differentiation of mesenchymal cells into VSMCs during development, these two lineages were aligned closely in the UMAP embedding (Fig 2A), and some intermediate subpopulations, such as c4, expressed markers of both lineages (Fig 2C). As expected, we identified CNCC‐derived neurons (c17; marked by the parasympathetic neuron marker Slc18a3 and the sympathetic neuron marker Th) (Hildreth et al, 2008), Schwann cells (c13; marked by Gfra3 and Cnp) (Skelly et al, 2018), and melanocytes (c20; marked by Mlana and Dct) (Brito & Kos, 2008; Hulin et al, 2019). The smFISH results confirmed that the melanocytes were mainly localized in the valves, such as aortic and mitral valves, and they were all CNCC‐derived (Appendix Fig S4A–D). We did not find any CCS or myocardial cell clusters, so our data do not support a direct contribution of CNCCs to the CCS and myocardium in the mouse.
Figure EV3. The representative markers distinguishing each subpopulation from one another of the VSMC and mesenchymal lineages.
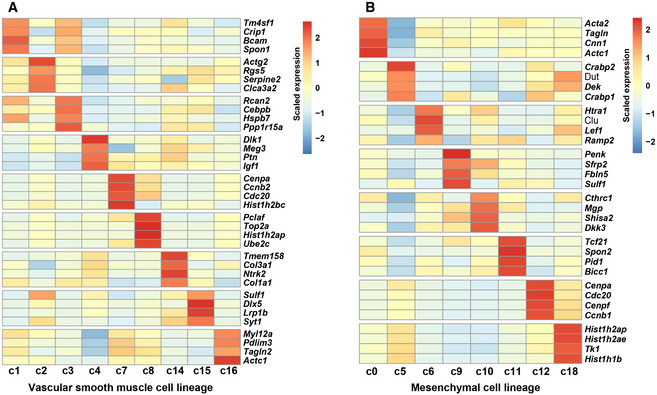
- The representative markers for each VSMC subpopulation.
- The representative markers for each mesenchymal subpopulation.
Intriguingly, we observed a cluster of mural cells (c19) based on the pericyte markers recently reported from single‐cell studies: P2ry14 (Skelly et al, 2018) and Vtn (Farbehi et al, 2019) (Fig 2B and C), thus supporting the existence of CNCC‐derived mural cells. To further confirm their mural cell identity, we examined the expression of canonical pericyte markers and VSMC contractile markers (Fig 2E). Compared with the others, the c19 cluster expressed higher levels of canonical pericyte markers including Pdgfrb, Cspg4, Rgs5, Des, and Kcnj8 (Holm et al, 2018; Vanlandewijck et al, 2018). It also exhibited high expression of VSMC contractile markers, including Acta2, Cnn1, and Myh11 (Sinha et al, 2014), reflecting a heterogeneous microvascular mural population comprising both pericytes and mVSMCs. Our smFISH results ultimately validated the presence of CNCC‐derived pericytes in the heart through the co‐expression of tdTomato and Vtn (Fig 2F). Immunofluorescence staining of another pericyte marker Kcnj8 and tdTomato also confirmed the presence of CNCC‐derived pericytes (Appendix Fig S5A–H).
CNCC‐derived pericytes transition to microvascular smooth muscle cells
To understand the heterogeneity of the CNCC‐derived mural cells, we performed subclustering of the c19 cells from stage P7 (227 cells, accounting for 48% of the cluster). Two subclusters were identified, sc1 and sc2, which correspond to pericytes and mVSMCs, respectively, based on the expression of markers (Fig 3A and B). RNA velocity analysis represents a computational framework that can infer the direction and rate of cellular state changes based on the relative abundance of spliced and unspliced transcripts (La Manno et al, 2018). Our RNA velocity analysis revealed a transition (trans‐differentiation) from pericytes to mVSMCs (Fig 3C), which is in agreement with the previous report that pericytes serve as progenitors for smooth muscle cells of the coronary vasculature based on lineage‐tracing evidence (Volz et al, 2015).
Figure 3. Cellular transition from CNCC‐derived pericytes to microvascular smooth muscle cells.
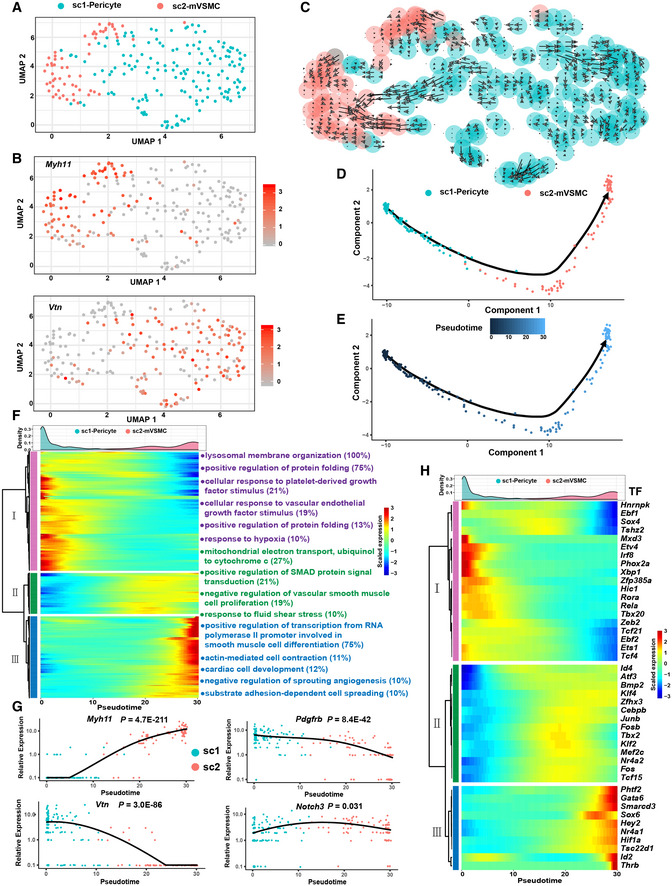
- Subclustering of the mural cell cluster c19 reveals two subpopulations. mVSMC, microvascular smooth muscle cells. Only P7 cells were considered in this analysis.
- The expression distribution of the VSMC‐specific marker Myh11 and the pericyte marker Vtn.
- RNA velocity analysis reveals a transition from CNCC‐derived pericytes to mVSMCs. The direction and length of the arrow reflect the direction and rate of cellular state changes, respectively.
- Linear trajectory constructed via pseudo‐temporal ordering of cells.
- Transition trajectory colored according to pseudotime.
- Hierarchical clustering of the genes that were significantly regulated during the progression of the transition reveals three gene modules. Only genes with an adjusted P‐value < 1E‐04 are shown here. The number in the parentheses represents the percentage of genes associated with the Gene Ontology term for which the gene module is significantly enriched (adjusted P‐value < 0.05). The density curves of the pseudotime for the two subpopulations are shown.
- The expression changes in Myh11, Vtn, Pdgfrb, and Notch3 during the progression of the cellular transition. Likelihood ratio tests implemented in the “differentialGeneTest” function of Monocle were used.
- Transcriptional factors that were significantly regulated during the transition. The density curves of the pseudotime for the two subpopulations are shown.
The single‐cell data provided a unique opportunity for interrogating the regulatory changes during the transition. Pseudo‐temporal ordering of the cells using Monocle2 resulted in the construction of a linear trajectory of cellular transition (Fig 3D and E). We further identified 952 genes that were significantly regulated during the progression of the transition (Fig 3F; Dataset EV2, adjusted P‐value < 1E‐04). Hierarchical clustering of the identified genes revealed three modules. Gene module I represented the molecular characteristics of pericytes and was mainly enriched for lysosomal membrane organization, cellular response to platelet‐derived growth, cellular response to vascular endothelial growth factor stimulus, and response to hypoxia (Fig 3F; Table EV2). Gene module II reflected the phenotype of transitioning cells and was mainly enriched for mitochondrial electron transport, positive regulation of SMAD protein signal transduction, negative regulation of vascular smooth muscle cell proliferation, and the response to fluid shear stress. Gene module III represented the characteristics of mVSMCs and was mainly enriched for positive regulation of transcription from RNA polymerase II promoter involved in smooth muscle cell differentiation and substrate adhesion‐dependent cell spreading. Figure 3G shows the expression dynamics of the pericyte markers Vtn and Pdgfrb as well as the VSMC marker Myh11, reflecting a continuum of phenotypic changes in cells embedded in the walls of the microvasculature. Interestingly, Notch3 signaling has been suggested to be important in the pericyte to VSMC transition (Volz et al, 2015). We found that Notch3 was significantly up‐regulated specifically in the middle phase of the trajectory (Fig 3G; adjusted P‐value = 0.031), while other Notch receptors including Notch1, Notch2, and Notch4 were not significantly regulated. Moreover, we examined the transcription factors (TFs) that were significantly regulated during the transition (Fig 3H). Notably, Fosb, Tbx2, and Klf2 were specifically up‐regulated in the middle phase of the trajectory, implying that they may play roles in the transition.
Developmental chronology and transcriptomic state change dynamics of CNCC derivatives during development
The study of the developmental chronology of CNCC derivatives has previously been limited by improper or limited cell markers for each developmental stage. The large‐scale single‐cell RNA‐seq dataset gave us an unpreceded opportunity since the cells were clustered in an unbiased manner based on the whole transcriptome, without the need for a priori knowledge about the cell markers. Figure 4A and B shows the proportion of each cluster in each stage and the proportion of cells from each stage in each cluster, respectively. Figure EV4A shows the relative proportion of each subpopulation in the VSMC and mesenchymal lineages. Figure EV4B shows the relative proportion of each subpopulation in each stage. As shown in cluster I of Fig 4B, the melanocyte lineage first appeared at E11.5 and then greatly expanded at E14.5. These results are consistent with a previous report that Dct (a melanocyte marker) expression is first observed at E11.5 and that a larger number of melanocytes are found in the atrioventricular endocardial cushions at E14.5 (Brito & Kos, 2008), reflecting the reliability of our dataset. Surprisingly, CNCC‐derived neurons were found to appear first at E10.5, which was earlier than previously recognized (E11.5) (Poelmann et al, 2004; Hildreth et al, 2008). Although only six E10.5 neuron cells were captured, they all expressed neuron‐specific markers (Table EV3), thus excluding errors from data integration and clustering.
Figure 4. The developmental chronology and transcriptomic state change dynamics of CNCC derivatives.
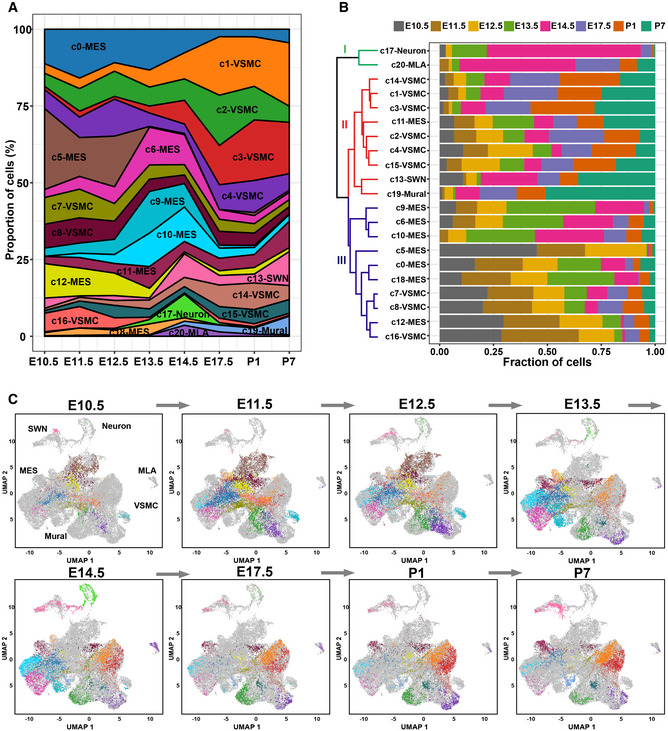
- The proportion of cells of each cluster in each stage.
- The proportion of cells from each stage in each cluster. All samples are normalized to the same number of cells (2,026). The dendrogram shows the hierarchical clustering of the cell clusters based on the proportion of cells from each stage.
- Dynamic changes in the transcriptomic states of CNCC derivatives during development. The cells are colored according to the clusters.
Data information: MES, mesenchymal cell; MLA, melanocyte; SWN, Schwann cell; UMAP, uniform manifold approximation and projection; VSMC, vascular smooth muscle cell.
Figure EV4. The relative proportion of each subpopulation in the VSMC and mesenchymal lineages.
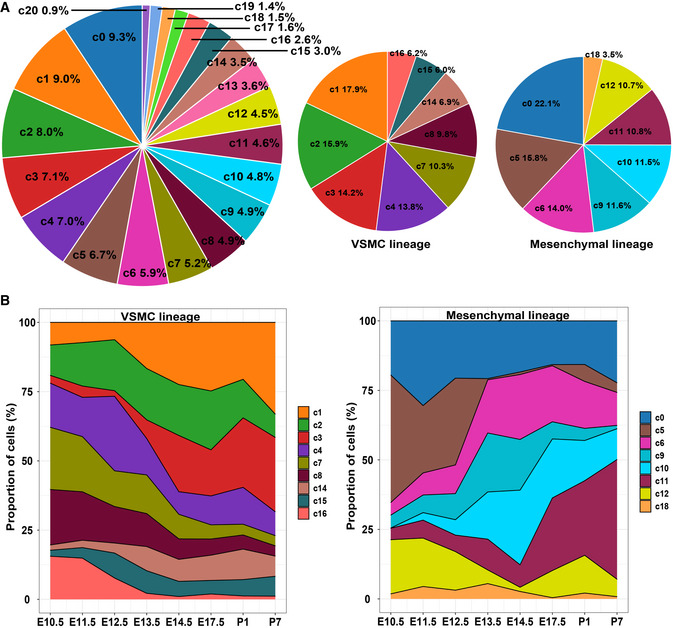
- The relative proportion of each subpopulation in all the captured cells (left panel), the VSMC lineage (middle panel), and the mesenchymal lineage (right panel).
- The relative proportion of each VSMC subpopulation (left panel) and each mesenchymal subpopulation (right panel) in each stage.
As expected, the VSMC lineage expanded mainly at the later stages of development (after E14.5; cluster II in Fig 4B), and the mesenchymal lineage expanded mainly at the early stages (before E14.5; cluster III in Fig 4B). Notably, the mural cells expanded greatly postnatally (especially at P7), in line with the increase in capillary growth during the postnatal development of the heart (Riley & Smart, 2011). The transcriptomic state change dynamics during the development of the CNCC‐derived lineages can be visualized in Fig 4C. Notably, the earliest sample from E10.5 included multiple cell lineages, supporting the view that many CNCC derivatives had already committed or differentiated to a specific lineage when they arrived at the heart.
Gradual loss of proliferation and the neural crest molecular signature with development in CNCC derivatives
We further characterized the CNCC derivatives concerning their proliferation ability and differentiation potential when they arrived at the heart as well as during embryonic and postnatal development. We found that the CNCC derivatives were highly proliferative when they arrived at the heart (E10.5) and switched from a proliferative to a quiescent state with the progression of development (Fig 5A). Some clusters, such as c18, c12, c8, c5, and c7, were highly proliferative (Fig 5B). We further investigated the differentiation potential of CNCC derivatives by examining the expression of a list of markers for pluripotency and pre‐migratory NCCs that was compiled by a previous study (Lignell et al, 2017). No cell clusters were found to exhibit high expression of pluripotency genes such as Nanog and Pou5f1 (Oct4), suggesting that the CNCC‐derived cells generally did not possess stemness after migrating into the heart (Fig 5C). Moreover, we observed a gradual loss of the neural crest molecular signature with development in the CNCC derivatives (Fig 5D). Notably, the CNCC‐derived cell lineages exhibited differences in the neural crest molecular signature (Fig 5E). Surprisingly, the melanocytes, rather than the mesenchymal cells, were most similar to pre‐migratory NCCs. The melanocytes also showed high expression of other neural crest markers, including Pax3 and Kit (Hatzistergos et al, 2015) (Appendix Fig S6A and B), which may reflect a relatively late consolidation of melanocytic fate as previously proposed (Soldatov et al, 2019).
Figure 5. Gradual loss of proliferation and the neural crest molecular signature with development in the CNCC derivatives.
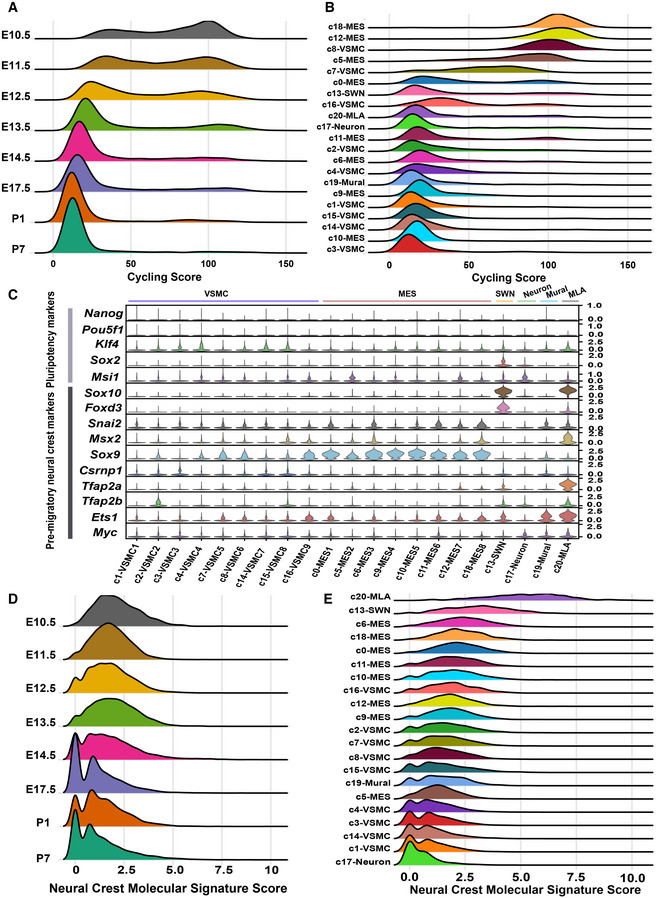
- Ridge plot showing that CNCC derivatives switched from a proliferative to a quiescent state with the progression of development. The cycling score of each cell was calculated by summing the log‐normalized expression of the cycling genes (“g2m.genes” and “s.genes” in Seurat).
- Ridge plot showing the proliferative ability of each cell cluster.
- The expression of pluripotency and pre‐migratory neural crest markers in each cell cluster.
- Ridge plot showing that the divergence in molecular signatures between the CNCC derivatives and pre‐migratory neural crest cells increased during development. The neural crest molecular signature score was calculated by summing the log‐normalized expression of the pre‐migratory neural crest markers (shown in C).
- Ridge plot showing the distribution of the neural crest molecular signature score in each cluster.
Spatial distribution of some critical subpopulations of CNCC derivatives during development
We next explored the spatial distribution of some critical CNCC‐derived subpopulations with smFISH. Cluster c1, c2, and c3 exhibited high expression of Myh11, thus representing relatively mature VSMCs (Fig 2C). However, c2 was aligned distant from c1 and c3 in the UMAP space (Fig 2A), suggesting that c2 represents another branch of the VSMC lineage distinct from c1 and c3, while the last two clusters aligned together closely. Interestingly, compared with c1 and c3, c2 expressed significantly higher levels of contractile markers such as Myh11 and Cnn1 as well as pericyte markers such as Rgs5 and Kcnj8 (Fig 6A). Cluster c1 and c3 expressed significantly higher levels of extracellular matrix genes such as Eln and Fbln2 than c2. Our smFISH results confirmed that the coronary arteries expressed significantly higher levels of Myh11 than the great arteries (Fig 6B and C). Taken together, c2 represents the CNCC‐derived VSMCs of the coronary vasculature, while c1 and c3 represent the CNCC‐derived VSMCs of the great arteries.
Figure 6. Spatial distribution of critical cell subpopulations of CNCC derivatives during development.
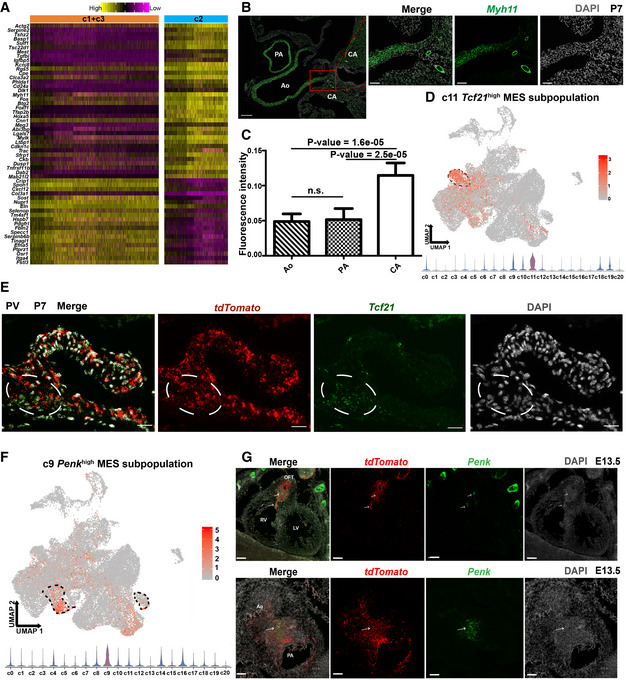
- Heatmap showing the difference between VSMC clusters c2 and c1 + c3. The significance threshold was set to an adjusted P‐value < 0.05 and log2‐fold change > 0.25.
- smFISH results showing significantly higher expression of the contractile marker Myh11 in VSMCs of the coronary arteries than in VSMCs of the great arteries. Scale bar (long): 200 μm. Scale bar (short): 50 μm.
- Quantitative analysis of the fluorescent intensity of Myh11 expression confirms significantly higher expression of Myh11 in VSMCs of the coronary arteries than in VSMCs of the great arteries. The bar height represents the average intensity of five biological replicates (mean ± SE). One‐way ANOVA with post hoc test (LSD). n.s. not significant.
- Mesenchymal cluster c11 exhibits a high expression of Tcf21. The dashed area indicates cluster c11.
- smFISH results showing that the CNCC‐derived Tcf21 high cells represent valve interstitial cells localized in the valve annulus. PV: pulmonary valve. The white circle indicates the valve annulus region where the CNCC‐derived Tcf21 high cells are localized. Scale bar: 20 μm.
- Mesenchymal cluster c9 shows high expression of Penk. The dashed area indicates cluster c9.
- smFISH results showing that the Penk high cells are mainly localized in the OFT region and are all derived from CNCC. The upper panel shows the expression of Penk in the whole heart, and the lower panel shows the expression in the cross section of OFT. Scale bar in the upper panel: 100 μm. Scale bar in the lower panel: 50 μm.
Data information: Ao, aorta; CA coronary artery; LV, left ventricle; OFT, outflow tract; PA, pulmonary artery; RV, right ventricle.
The mesenchymal cluster c11 showed high expression of the TF Tcf21 (Fig 6D); however, it did not display specifically high expression of other markers for epicardium or epicardium‐derived cells such as Wt1, Tbx18, Upk1b, and Upk3b (Appendix Fig S7) (Braitsch et al, 2013; Liu et al, 2019). The cluster c11 thus represents neither contaminated epicardial cells nor epicardium‐derived cells. Our smFISH (Fig 6E) and immunofluorescence staining (Appendix Fig S8A–H) results revealed that the Tcf21 high tdTomato + cells were mainly localized in the valve annulus region, thus indicating that the mesenchymal cluster c11 represents a subpopulation of CNCC‐derived valve interstitial cells specifically localized in the valve annulus region. Notably, this finding is in line with the previous reports regarding the presence of Tcf21 high valve interstitial cells (Acharya et al, 2011; Hulin et al, 2019).
Our laboratory previously identified a Penk + mesenchymal subpopulation in the developing OFT; however, whether this subpopulation is derived from CNCCs was not answered (Liu et al, 2019). In this study, we found the mesenchymal cluster c9 showed high expression of Penk (Fig 6F). Secondary clustering of the c9 cells further revealed three subclusters (Fig EV5A and B) and the expression of Penk was heterogeneous across the subclusters (Fig EV5C). Secreted Frizzled Related Protein 2 (Sfrp2) had a similar expression pattern to Penk (Fig EV5C and D). The subcluster sc2 expressing relatively low levels of Penk was mainly from early stages, thus representing progenitor states of the Penk high cells. The smFISH results showed that the Penk + cells were mainly localized in the OFT cushions where the aortopulmonary septum formed, and all the Penk + cells in the heart were derived from CNCCs (Fig 6G). The cluster c9 thus represents a CNCC‐derived mesenchymal subpopulation involved in the formation of the aortopulmonary septum.
Figure EV5. Secondary clustering of the c9 cells.
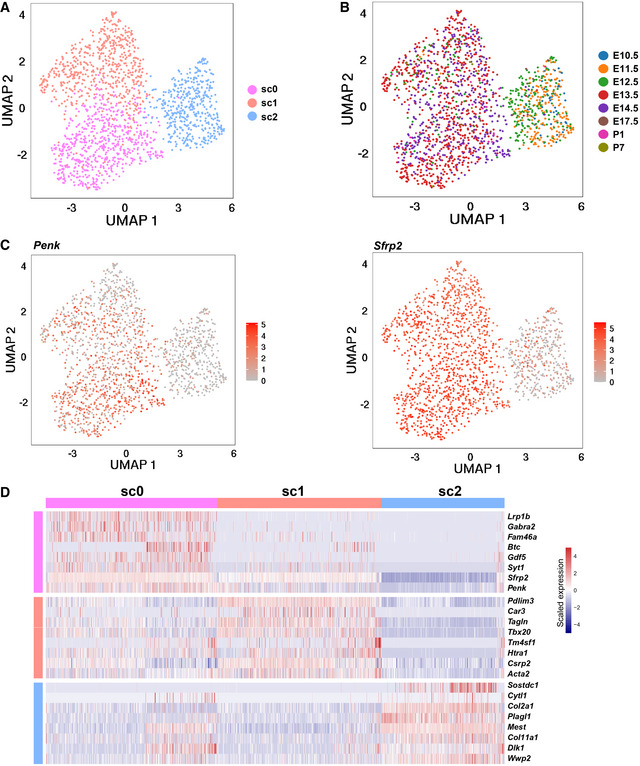
- UMAP plot showing three subclusters identified by secondary clustering of the c9 cells.
- UMAP plot showing the distribution of cells from each stage.
- UMAP plot showing the expression of Penk and Sfrp2.
- Heatmap showing the expression of molecular signatures of each cluster.
Reconstruction of the differentiation path and regulatory dynamics of CNCC derivatives after migrating into the heart
We next sought to understand the path and regulatory dynamics governing the differentiation of CNCC derivatives after migrating into the heart. We applied a probabilistic method implemented in scdiff2 (Ding et al, 2018), which integrates single‐cell time‐series expression data with TF‐target regulatory information to reconstruct the developmental path. Given that during early migration NCCs have already become specified for a particular lineage, including neural or glial cells (Soldatov et al, 2019), here we focused on the mesenchymal and VSMC lineages. This analysis revealed a branched developmental path and uncovered the relative position of each cluster along the path (Fig 7). Notably, the mesenchymal cluster c5, which comprised cells mainly from the early stages (Fig 4B), was inferred by the algorithm to represent the earliest state of the CNCC‐derived mesenchymal cells after migrating into the heart. Consistent with that Crabp1 is the top marker of CNCC‐derived mesenchymal cells at E9.25 (Soysa et al, 2019), c5 showed high expression of Crabp1 and Crabp2 (Appendix Fig S9A and B). As expected, starting from c5, the trajectory was split into two major branches: mesenchymal cell and VSMC developmental branches (Fig 7). We noted that c9, a CNCC‐derived mesenchymal subpopulation involved in the formation of aortopulmonary septum, was ordered as the terminal node of a developmental path (c5→c12→c18→c6→c10→c9). This path therefore represents CNCC‐derived OFT cushion mesenchyme development. The cluster c11, CNCC‐derived valve interstitial cell subpopulation, was ordered at the terminal node of the other mesenchymal developmental path (c5→c12→c0→c11), which thus represents CNCC‐derived valve interstitial cell development. In addition, we found that the development path for VSMCs of the great arteries (c5→c12→c16→c1→c3) was clearly separated from the path for VSMCs of the coronary vasculature (c5→c12→c15→c2).
Figure 7. Reconstruction of the differentiation trajectory and regulatory dynamics of CNCC derivatives after migrating into the heart.
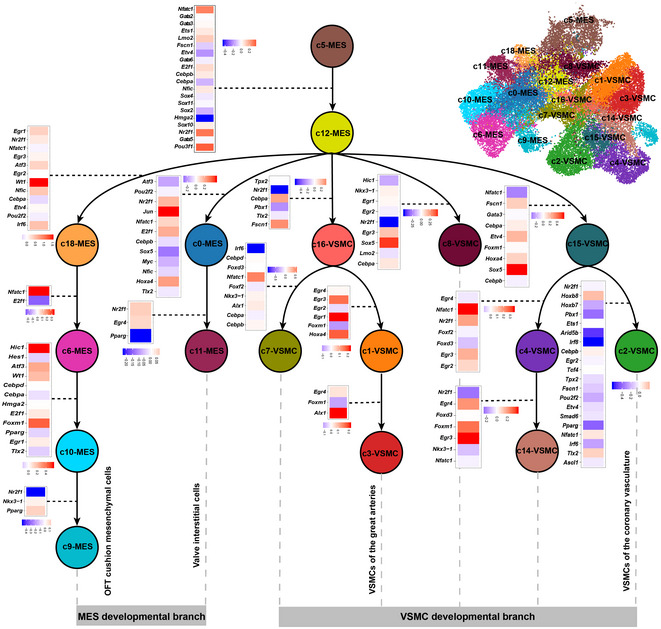
Nodes represent cell clusters. Potentially key TFs underlying the transition between nodes are shown and are color‐coded based on the log2 fold change of expression.
We also inferred the differentiation path of CNCC derivatives through RNA velocity analysis using a likelihood‐based dynamical model implemented in scVelo (Bergen et al, 2020). Strikingly, the latent time (the relative position of each cell during the differentiation) predicted by the scVelo analysis, which is solely based on the transcriptional dynamics, approximated the sampling time (Appendix Fig S10A and B), reflecting the reliability of the analysis. Albeit with distinct underlying algorithms, the scVelo and scdiff analyses predicted generally similar differentiation paths (Appendix Fig S10C). Staring from c5, the “root” state, as reflected by the inferred latent time, the trajectory was split into two major branches: mesenchymal cell and VSMC developmental branches (Appendix Fig S10C). Specifically, most differentiation paths were well recapitulated by the scVelo analysis. For example, the paths for VSMCs of the great arteries (c16→c1→c3) and valve interstitial cells (c0→c11).
The scdiff analysis also enables the identification of the potentially important TFs (Dataset EV3) and target genes (Dataset EV4) underlying the progressive fate changes across the clusters (Fig 7). Notably, known regulators involved in cardiac NCC differentiation, such as Ets1, Sox4, Sox11, and Sox10 (Gao et al, 2010; Paul et al, 2014), were found to be important in the early state transitions, for example, c5→c12. Nfatc1 was identified as a critical regulator across multiple transitions, for example, the developmental path for CNCC‐derived valve interstitial cells (c5→c12→c0→c11). The role of Nfatc1 in cardiac valve formation has been elucidated by a recent study, which reported that Nfatc1 mutants formed significantly fewer valve interstitial cells due to reduced proliferation and impaired recruitment of CNCC‐derived cells (Gunawan et al, 2020). Our results thus reinforce the established role of Nfatc1. In addition, we identified a series of regulators with limited knowledge about their roles during the differentiation of CNCC derivatives, such as early growth response (Egr) genes (e.g., Egr1, Egr2, Egr3, and Egr4) and Hox genes (e.g., Hoxa4, Hoxb7, and Hoxb8), which may serve as candidates for further exploration.
Discussion
The formation, migration, and differentiation of NCCs and NCC‐associated pathologies have been the subject of intense research since the discovery of these cells 150 years ago (Prasad et al, 2019). CNCCs play critical roles in the evolution and development of the vertebrate cardiovascular system (Keyte et al, 2014). In this study, we systematically investigated the transcriptional landscape of CNCC derivatives during cardiac development at a single‐cell resolution. Based on large‐scale single‐cell RNA‐seq analyses and smFISH validation, we reported the presence of CNCC‐derived mural cells associated with the microvasculature. Furthermore, we found the transition from CNCC‐derived pericytes to mVSMCs and identified the genes that were significantly regulated during the transition through pseudo‐temporal ordering analysis. We defined the developmental chronology of the CNCC‐derived lineages and found that the CNCC‐derived neurons first appeared at E10.5, which was earlier than previously recognized. Our data indicated that many CNCC derivatives had already committed or differentiated to a specific lineage when they arrived at the heart. We found that the CNCC derivatives were highly proliferative when migrating into the heart, and switched from a proliferative to a quiescent state with the progression of development. Gradual loss of the neural crest molecular signature with development was also observed in the CNCC derivatives. We confirmed some critical subpopulations of the CNCC derivatives with smFISH. Finally, we reconstructed the differentiation path and regulatory dynamics of CNCC derivatives after migrating into the heart.
Understanding the origin and regulators driving the development of the cardiac vasculature is an important topic in developmental biology. Microvascular mural cells, comprising microvascular pericytes and microvascular smooth muscle cells, have recently been recognized as playing a critical role in cardiac vascular homeostasis and disease (Holm et al, 2018). The plasticity of microvascular pericytes makes them promising cells for application in cardiac regenerative medicine (Avolio & Madeddu, 2016). Nevertheless, the phenotypes of microvascular mural cells are variable, and canonical markers such as Pdgfrb, Des, and Cspg4 do not specifically label them, as also shown in our data (Fig 2E), thus impeding the identification of the source and role of this important but heterogeneous population of cells. Using lineage tracing and canonical markers, previous studies have reported the embryonic origin of cardiac mural cells from epicardium or endocardial endothelial cells (Zhou et al, 2008; Chen et al, 2016). Based on single‐cell clustering and novel markers recently reported from single‐cell studies, we identified a third source of mural cells in the heart (i.e., CNCC‐derived mural cells; Fig 2B and C). This finding makes sense because NCCs have been reported to give rise to mural cells in many other organs, such as the brain, retina, and thymus (Zachariah & Cyster, 2010; Trost et al, 2013). We also found that the mural cells expanded greatly postnatally (especially at P7, Fig 4B), in line with the increase in capillary growth during the postnatal development of the heart (Riley & Smart, 2011). This may be one of the reasons why the CNCC‐derived mural cells were not identified in a previous study (Chen et al, 2016) since the CNCC‐derived mural cells are relatively few at E14.5 (the stage that study only examined). Consistent with the phenotypic heterogeneity of cardiac mural cells, our results reflected a more complex embryonic origin of cardiac mural cells than previously recognized. Whether cardiac mural cells of different origins behave differentially during pathological processes of the microvasculature deserves further study. Although a previous study indicated that pericytes can transition to mVSMCs (Volz et al, 2015), the gene expression dynamics underlying this transition are not yet fully elucidated. Through pseudo‐temporal ordering of single cells, we confirmed the linear trajectory of the pericyte‐to‐mVSMC transition and, for the first time, elucidated the previously unknown regulatory changes and potentially important regulators during the transition (Fig 3F). However, functional experiments remain to be performed to confirm their functions in the process.
Although our data do not support a direct contribution of CNCCs to the CCS and myocardium, our results highlight the contribution of CNCCs to cardiac vessels of different calibers, from the VSMCs of the great arteries to mural cells wrapping the microvasculature. Moreover, we found that the phenotypes of the cells wrapping the cardiac vessels may vary as a function of the caliber of the vessels. For example, the coronary arteries expressed significantly higher levels of the contractile marker Myh11 than the great arteries (Fig 6A and C). Our results reflect a continuum of cell phenotypes along the cardiac vascular tree with VSMCs and pericytes at the two ends of the phenotypic spectrum. The heterogeneity of the phenotypes of vessel‐associated cells in the brain vasculature has been dissected using single‐cell RNA‐seq (Vanlandewijck et al, 2018). The phenotypic heterogeneity of the cardiac vasculature is also complex and deserves to be explored at a single‐cell resolution in the future by integrating single‐cell RNA‐seq data with spatial transcriptomic data.
Due to the limitations of imaging‐based lineage tracing used in the previous studies (Jiang et al, 2000; Nakamura et al, 2006), we know little about the states of CNCC derivatives when they migrate to the heart or the molecular change dynamics during development. The large‐scale single‐cell RNA‐seq dataset gave us an unprecedented opportunity to explore these questions. Notably, the earliest sample from E10.5 contained multiple cell lineages and exhibited the expression of lineage‐specific mature markers, for example, mature neuron markers including Slc18a3 and Th (Fig 4C; Table EV3). The neuron, Schwann, and melanocyte lineages aligned relatively distant from the mesenchymal lineage in the UMAP embedding (Fig 4C), suggesting that most cells of these lineages were not differentiated from the mesenchymal cells after migrating into the heart. Taken together, our results support that many CNCC derivatives have already committed or differentiated to a specific lineage when they arrived at the heart. In a recent paper that focused on the early states of cranial and trunk neural crest (E8.5 to E10.5), the cell fate bifurcations of lineages including neuron, glia, and mesenchyme are found to have occurred during early migration (Soldatov et al, 2019). Our study fills the gap in knowledge on the cellular states of CNCC derivatives after migrating into the heart, and our results support the proposed cell fate decision model of the neural crest. In addition, we reconstructed the differentiation path of CNCC‐derived mesenchymal and VSMC lineages (Fig 7), which account for most of the CNCC derivatives and are closely related during heart development. Intriguingly, we found that the development path for the VSMCs of the coronary vasculature (c5→c12→c15→c2) was clearly separated from that of the great arteries (c5→c12→c16→c1→c3). It has been reported that neural crest‐derived VSMCs of the coronary vasculature and the great vessels have different spatial origins of neural crest (preotic region for the coronary vasculature and postotic region for the great vessels) (Arima et al, 2012). However, we know little about how the development of neural crest‐derived VSMCs of the coronary vasculature diverged from that of the great vessels. Our results provide a detailed map of the developmental path of CNCC‐derived mesenchymal and VSMC lineages during heart development.
Although the Wnt1‐Cre line is well‐established for neural crest lineage tracing, phenotypic variances may exist among different tracing models (Debbache et al, 2018). Thus, the current study may be limited by using only one tracing model. It is helpful to use additional driver lines (e.g., P0‐Cre and Pax3‐Cre) or a different recombination system such as Wnt1‐Flpe to confirm the findings of this study in the future.
In conclusion, our study provides novel insights into the cell lineages, molecular signatures, developmental chronology, and regulatory dynamics of CNCC derivatives during embryonic and neonatal development. Our dataset constitutes a valuable resource that will facilitate future efforts to explore the roles of CNCC derivatives in development and disease.
Materials and Methods
Mice
The Wnt1‐Cre;Rosa26‐tdTomato mice were obtained by crossing a Wnt1‐Cre transgenic line (Jax Labs; 003829) with a ROSA26‐tdTomato reporter line (Jax Labs; 007909). The Wnt1‐Cre; Rosa26‐tdTomato mice were confirmed by the presence of fluorescence in the heart using a Discovery V20 stereomicroscope equipped with a 550 nm laser and a Texas Red filter set (Carl Zeiss AG). The ROSA26‐tdTomato reporter line was purchased from Beijing Vitalstar Biotechnology Co., Ltd. The Wnt1‐Cre mouse line was transferred from Dr. Zhen Zhang's laboratory at Children's Hospital of Shanghai. All experiments were approved by the ethics committee of Fuwai Hospital (2017‐877). Randomization and blinding are not applicable to this study. The embryos and neonatal mice were not selected by sex. All animal experiments complied with the ARRIVE guidelines.
Single‐cell suspension preparation and cell sorting
The whole hearts of embryonic or postnatal Wnt1‐Cre;Rosa26‐tdTomato mice were microdissected under a Stemi 305 compact stereo microscope (Carl Zeiss AG, Germany). The dissected hearts were rinsed with cold Dulbecco's phosphate‐buffered saline to remove most of the red blood cells. To ensure a sufficient number of tdTomato‐positive cells for single‐cell capture, we pooled multiple hearts as a sample for each developmental stage (the numbers of hearts are indicated in Fig 1B). Then, the heart tissues were dissociated using a Pierce Primary Cardiomyocyte Isolation Kit (Thermo Fisher Scientific, #88281) according to the manufacturer's instructions. The obtained single‐cell suspensions were filtered using a 40‐mm strainer to remove any cell debris or large clumps. The tdTomato‐positive cells in the whole heart suspensions were sorted using a BD FACSAria™ II cell sorter (BD Biosciences, USA). Thereafter, the cell suspensions were pelleted and washed twice at 400 g for 5 min at 4˚C, and the pellets were resuspended in Hank's balanced salt solution with 0.04% bovine serum albumin. Cell viability and concentrations were measured with a TC20 automated cell counter (Bio‐Rad, USA). Cell viability was determined with a 0.4% trypan blue staining solution.
Single‐cell RNA‐seq library preparation and sequencing
Single‐cell Gel Beads‐in‐Emulsion (GEM) generation, barcoding, post‐GEM‐RT cleanup, cDNA amplification, and cDNA library construction were performed using Chromium Single Cell 3′ Reagent Kit v2 chemistry (10X Genomics, USA) following the manufacturer's protocol. The resulting libraries were sequenced on a NovaSeq 6000 System (Illumina, USA).
Sample demultiplexing, barcode processing, and UMI counting
The official software Cell Ranger v3.0.2 (https://support.10xgenomics.com) was applied for sample demultiplexing, barcode processing, and unique molecular identifier (UMI) counting. Briefly, the raw base call files generated by the sequencers were demultiplexed into reads in FASTQ format using the “cellranger mkfastq” pipeline. Then, the reads were processed using the “cellranger count” pipeline to generate a gene‐barcode matrix for each library. During this step, the reads were aligned to the mouse (Mus musculus) reference genome (version: mm10) and the tdTomato sequence. The resulting gene‐cell UMI count matrices of all samples were ultimately concatenated into one matrix using the “cellranger aggr” pipeline.
Data cleaning, normalization, feature selection, integration, and scaling
The concatenated gene‐cell barcode matrix was imported into Seurat v3.0.2 (Butler et al, 2018; Stuart et al, 2019) for data preprocessing. To exclude genes likely detected from random noise, we filtered out genes with counts in fewer than three cells. To exclude poor‐quality cells that might have resulted from doublets or other technical noise, we filtered cell outliers (> third quartile + 1.5 × interquartile range or < first quartile − 1.5 × interquartile range) based on the number of expressed genes, the sum of UMI counts, and the proportion of mitochondrial genes. To further remove doublets, we filtered out cells based on the predictions by Scrublet (Wolock et al, 2019). In addition, cells enriched in hemoglobin gene expression were considered red blood cells and were excluded from further analyses. The sum of the UMI counts for each cell was normalized to 10,000 and log‐transformed. For each sample, 2,000 features (genes) were selected using the “FindVariableFeatures” function of Seurat under the default settings. Genes on the sex chromosomes were removed from the list of selected features. To correct for potential batch effects and identify shared cell states across datasets, we integrated all the datasets via canonical correlation analysis (CCA) implemented in Seurat. To mitigate the effects of uninteresting sources of variation (e.g., the cell cycle), we regressed out the mitochondrial gene proportion, UMI count, S phase score, and G2M phase score (calculated by the “CellCycleScoring” function) with linear models using the “ScaleData” function. Then, the data were centered for each gene by subtracting the average expression of that gene across all cells and were scaled by dividing the centered expression by the standard deviation.
Dimensional reduction and clustering
The integrated data were imported into the Scanpy v1.4 toolkit (Wolf et al, 2018) for dimensional reduction and clustering. Briefly, the expression of the selected genes was subjected to linear dimensional reduction through principal component analysis (PCA). Then, the first 30 principal components of the PCA were used to compute a neighborhood graph of the cells. The neighborhood graph was ultimately embedded in two‐ or three‐dimensional space using the non‐linear dimensional reduction method of uniform manifold approximation and projection (UMAP) (Becht et al, 2019). The neighborhood graph of cells was clustered using Louvain clustering (resolution = 1) (Blondel et al, 2008).
Differential expression and function enrichment analysis
The gene signature of each cell cluster was obtained using the “scanpy.tl.rank_genes_groups” tool implemented in Scanpy. The significance threshold was set to a corrected P‐value < 0.05. The top 100 genes were retained as the gene signature of each cluster. Differentially expressed genes between two groups of cells were detected with the likelihood ratio test (test.use: “bimod”) implemented in the “FindMarkers” function of Seurat. The significance threshold was set to an adjusted P‐value < 0.05 and a log2‐fold change > 0.25. Functional enrichment analyses of a list of genes were performed using ClueGO (Bindea et al, 2009) with an adjusted P‐value threshold of 0.05 and a percentage of genes associated with the Gene Ontology term ≥ 10%.
RNA velocity analysis
RNA velocity analysis was performed using scVelo v0.2.2 (Bergen et al, 2020). First, the expression of the spliced and unspliced mRNAs of each gene in each cell was determined separately for each sample using the Velocyto v0.17 tool (https://github.com/velocyto‐team/velocyto.py). The first 30 PCA components were used to calculate the first‐ and second‐order moments. Then, the velocities were estimated using the “scvelo.tl.velocity” function (mode = 'dynamical'), and velocity graphs were constructed using the “scvelo.tl.velocity_graph” function. The latent time was inferred through the function “scvelo.tl.latent_time”. Finally, the velocities were visualized as streamlines and were projected onto a two‐dimensional UMAP embedding.
Pseudo‐temporal ordering of single cells along the differentiation trajectory
Pseudo‐temporal ordering of the cells along the differentiation trajectory was performed using Monocle2 (Qiu et al, 2017). Briefly, the ordering was based on 1,000 genes that differed in expression between clusters selected via an unsupervised procedure: “dpFeature”. Then, the data space was reduced to two dimensions with the method “DDRTree”. The cells were ultimately ordered in pseudotime, and cells exhibiting high expression of pericyte markers were considered to represent the beginning of the trajectory. Once the pseudotime was assigned for each cell, we identified genes that were significantly regulated as differentiation progressed using the “differentialGeneTest” function. The statistically significant threshold was set to a q‐value < 1E‐04.
Single‐molecule fluorescence in situ hybridization and quantitative analyses of the fluorescent signal intensity
To detect the expression of the target gene in vivo, we performed single‐molecule fluorescence in situ hybridization (smFISH) using RNAscope® technology for formalin‐fixed paraffin‐embedded (FFPE) tissues. In brief, the dissected embryo or heart tissues were subjected to formalin fixation, alcohol dehydration, and paraffin embedding. Then, we cut the embedded tissues into sections of 4 μm in thickness and performed smFISH using the RNAscope® Multiplex Fluorescent Reagent Kit v2 (Cat. No. 323100, Advanced Cell Diagnostics, USA) according to the manufacturer's instructions. Fluorescent signals were scanned with the Vectra® Polaris™ pathology imaging system (PerkinElmer, USA). The fluorescent signal intensities in different parts of the heart were quantified with the ImageJ v1.48 tool (Schneider et al, 2012).
Immunofluorescence staining
The whole heart tissues from each stage were fixed with neutral buffer formalin. Then, they were washed by current water, dehydrated using graded ethanol, vitrified by dimethylbenzene, and deposited in paraffin. All samples were sliced into 5‐μm sections using a paraffin slicing machine (Leica, RM2235). After dewaxing, EDTA antigen retrieval solution (ZSGB‐Bio, Cat#ZLI‐9069) was used for antigen retrieval, and then, blocking solution (ZSGB‐Bio, Cat#ZLI‐9022) was used to block the antigens at room temperature for 1 h. The primary antibody was added at 4 overnight, and the secondary antibody was added at room temperature for 40 min. Anti‐Cardiac Troponin T antibody (cTnT; Abcam, Cat#ab8295) was used to label cardiomyocytes, Anti‐Kir6.1/KCNJ8 antibody (Kcnj8; Abcam, Cat#ab241996) was used to label pericytes, and the Anti‐RFP (Abcam, Cat#ab62341) was used to label tdTomato‐positive cells.
Developmental path and regulatory dynamics reconstruction
The differentiation path and the underlying regulatory dynamics were reconstructed using scdiff2 (Ding et al, 2018) under default settings, which was developed for analyzing single‐cell time‐series data. In addition to single‐cell expression data, sampling time and TF‐target information were considered in this analysis.
Statistical analysis
All statistical analyses were performed using R. P‐values were calculated using two‐tailed tests, and Bonferroni corrections were conducted for multiple testing. The significance threshold was set to an adjusted P‐value < 0.05. The effect of vessel caliber on the fluorescence intensity of Myh11 was determined by one‐way ANOVA, and the statistical significance between groups was tested with post hoc tests (LSD).
Author contributions
WC and XL participated in designing the project. WC performed the wet laboratory experiments with the assistance of ZZe, HS, and KY. XL performed data analysis, interpreted the results, and wrote the manuscript. WL designed the web interfaces. JRP gave suggestions on result interpretation. ZZh conceived the project.
Conflict of interest
The authors declare that they have no conflict of interest.
Supporting information
Appendix
Expanded View Figures PDF
Dataset EV1
Dataset EV2
Dataset EV3
Dataset EV4
Table EV1
Table EV2
Table EV3
Acknowledgements
This work was supported by grants from the National Natural Science Foundation of China (81900282, 82070326), the CAMS Initiative for Innovative Medicine (2016‐I2M‐1‐016), the Post‐doctoral International Exchange Project (2018‐BSH04), China Postdoctoral Science Foundation (2021TQ0049) and the Foundation for Fuwai Hospital Youth Scholars (2019‐F08). We thank Dr. Zhen Zhang at Children's Hospital of Shanghai for transferring the Wnt1‐Cre mouse line to our laboratory.
EMBO reports (2021) 22: e52389.
Contributor Information
Xuanyu Liu, Email: liuxuanyu@fuwaihospital.org.
Zhou Zhou, Email: zhouzhou@fuwaihospital.org.
Data availability
The raw sequencing reads generated for this study can be accessed at Sequence Read Archive with the accession number: PRJNA562135 (https://www.ncbi.nlm.nih.gov/bioproject/PRJNA562135/).
References
- Acharya A, Baek ST, Banfi S, Eskiocak B, Tallquist MD (2011) Efficient inducible Cre‐mediated recombination in Tcf21 cell lineages in the heart and kidney. Genesis 49: 870–877 [DOI] [PMC free article] [PubMed] [Google Scholar]
- Arima Y, Miyagawa‐Tomita S, Maeda K, Asai R, Seya D, Minoux M, Rijli FM, Nishiyama K, Kim K‐S, Uchijima Y et al (2012) Preotic neural crest cells contribute to coronary artery smooth muscle involving endothelin signalling. Nat Commun 3: 1267 [DOI] [PubMed] [Google Scholar]
- Avolio E, Madeddu P (2016) Discovering cardiac pericyte biology: from physiopathological mechanisms to potential therapeutic applications in ischemic heart disease. Vascul Pharmacol 86: 53–63 [DOI] [PubMed] [Google Scholar]
- Becht E, McInnes L, Healy J, Dutertre CA, Kwok IWH, Ng LG, Ginhoux F, Newell EW (2019) Dimensionality reduction for visualizing single‐cell data using UMAP. Nat Biotechnol 37: 38–47 [DOI] [PubMed] [Google Scholar]
- Bergen V, Lange M, Peidli S, Wolf FA, Theis FJ (2020) Generalizing RNA velocity to transient cell states through dynamical modeling. Nat Biotechnol 38: 1408–1414 [DOI] [PubMed] [Google Scholar]
- Bhatt S, Diaz R, Trainor PA (2013) Signals and switches in mammalian neural crest cell differentiation. Cold Spring Harb Perspect Biol 5: a008326 [DOI] [PMC free article] [PubMed] [Google Scholar]
- Bindea G, Mlecnik B, Hackl H, Charoentong P, Tosolini M, Kirilovsky A, Fridman WH, Pages F, Trajanoski Z, Galon J (2009) ClueGO: a Cytoscape plug‐in to decipher functionally grouped gene ontology and pathway annotation networks. Bioinformatics 25: 1091–1093 [DOI] [PMC free article] [PubMed] [Google Scholar]
- Blondel VD, Guillaume JL, Lambiotte R, Lefebvre E (2008) Fast unfolding of communities in large networks. J Stat Mech Theory Exp 2008: P10008 [Google Scholar]
- Braitsch CM, Kanisicak O, van Berlo JH, Molkentin JD, Yutzey KE (2013) Differential expression of embryonic epicardial progenitor markers and localization of cardiac fibrosis in adult ischemic injury and hypertensive heart disease. J Mol Cell Cardiol 65: 108–119 [DOI] [PMC free article] [PubMed] [Google Scholar]
- Brito FC, Kos L (2008) Timeline and distribution of melanocyte precursors in the mouse heart. Pigment Cell Melanoma Res 21: 464–470 [DOI] [PubMed] [Google Scholar]
- Butler A, Hoffman P, Smibert P, Papalexi E, Satija R (2018) Integrating single‐cell transcriptomic data across different conditions, technologies, and species. Nat Biotechnol 36: 411–420 [DOI] [PMC free article] [PubMed] [Google Scholar]
- Camp JG, Badsha F, Florio M, Kanton S, Gerber T, Wilsch‐Bräuninger M, Lewitus E, Sykes A, Hevers W, Lancaster M et al (2015) Human cerebral organoids recapitulate gene expression programs of fetal neocortex development. Proc Natl Acad Sci USA 112: 15672–15677 [DOI] [PMC free article] [PubMed] [Google Scholar]
- Cao J, Spielmann M, Qiu X, Huang X, Ibrahim DM, Hill AJ, Zhang F, Mundlos S, Christiansen L, Steemers FJ et al (2019) The single‐cell transcriptional landscape of mammalian organogenesis. Nature 566: 496–502 [DOI] [PMC free article] [PubMed] [Google Scholar]
- Cavanaugh AM, Huang J, Chen J (2015) Two developmentally distinct populations of neural crest cells contribute to the zebrafish heart. Dev Biol 404: 103–112 [DOI] [PMC free article] [PubMed] [Google Scholar]
- Chen Q, Zhang H, Liu Y, Adams S, Eilken H, Stehling M, Corada M, Dejana E, Zhou B, Adams RH (2016) Endothelial cells are progenitors of cardiac pericytes and vascular smooth muscle cells. Nat Commun 7: 12422 [DOI] [PMC free article] [PubMed] [Google Scholar]
- Debbache J, Parfejevs V, Sommer L (2018) Cre‐driver lines used for genetic fate mapping of neural crest cells in the mouse: an overview. Genesis 56: e23105 [DOI] [PMC free article] [PubMed] [Google Scholar]
- Ding J, Aronow BJ, Kaminski N, Kitzmiller J, Whitsett JA, Bar‐Joseph Z (2018) Reconstructing differentiation networks and their regulation from time series single‐cell expression data. Genome Res 28: 383–395 [DOI] [PMC free article] [PubMed] [Google Scholar]
- Engleka KA, Gitler AD, Zhang M, Zhou DD, High FA, Epstein JA (2005) Insertion of Cre into the Pax3 locus creates a new allele of Splotch and identifies unexpected Pax3 derivatives. Dev Biol 280: 396–406 [DOI] [PubMed] [Google Scholar]
- Farahani RM, Xaymardan M (2015) Platelet‐derived growth factor receptor alpha as a marker of mesenchymal stem cells in development and stem cell biology. Stem Cells Int 2015: 8 [DOI] [PMC free article] [PubMed] [Google Scholar]
- Farbehi N, Patrick R, Dorison A, Xaymardan M, Janbandhu V, Wystub‐Lis K, Ho JW, Nordon RE, Harvey RP (2019) Single‐cell expression profiling reveals dynamic flux of cardiac stromal, vascular and immune cells in health and injury. Elife 8: e43882 [DOI] [PMC free article] [PubMed] [Google Scholar]
- Gao Z, Kim GH, Mackinnon AC, Flagg AE, Bassett B, Earley JU, Svensson EC (2010) Ets1 is required for proper migration and differentiation of the cardiac neural crest. Development 137: 1543–1551 [DOI] [PMC free article] [PubMed] [Google Scholar]
- Gunawan F, Gentile A, Gauvrit S, Stainier DYR, Bensimon‐Brito A (2020) Nfatc1 promotes interstitial cell formation during cardiac valve development in Zebrafish. Circ Res 126: 968–984 [DOI] [PubMed] [Google Scholar]
- Hatzistergos KE, Takeuchi LM, Saur D, Seidler B, Dymecki SM, Mai JJ, White IA, Balkan W, Kanashiro‐Takeuchi RM, Schally AV et al (2015) cKit+ cardiac progenitors of neural crest origin. Proc Natl Acad Sci USA 112: 13051–13056 [DOI] [PMC free article] [PubMed] [Google Scholar]
- Hildreth V, Webb S, Bradshaw L, Brown NA, Anderson RH, Henderson DJ (2008) Cells migrating from the neural crest contribute to the innervation of the venous pole of the heart. J Anat 212: 1–11 [DOI] [PMC free article] [PubMed] [Google Scholar]
- Holm A, Heumann T, Augustin HG (2018) Microvascular mural cell organotypic heterogeneity and functional plasticity. Trends Cell Biol 28: 302–316 [DOI] [PubMed] [Google Scholar]
- Hulin A, Hortells L, Gomez‐Stallons MV, O'Donnell A, Chetal K, Adam M, Lancellotti P, Oury C, Potter SS, Salomonis N et al (2019) Maturation of heart valve cell populations during postnatal remodeling. Development 146: dev173047 [DOI] [PMC free article] [PubMed] [Google Scholar]
- Jiang X, Rowitch DH, Soriano P, McMahon AP, Sucov HM (2000) Fate of the mammalian cardiac neural crest. Development 127: 1607–1616 [DOI] [PubMed] [Google Scholar]
- Kalcheim C (2006) Neural crest cells and their derivatives. In Encyclopedic Reference of Genomics and Proteomics in Molecular Medicine, Ganten D, Ruckpaul K, Birchmeier W, Epplen JT, Genser K, Gossen M, Kersten B, Lehrach H, Oschkinat H, Ruiz P, Schmieder P, Wanker E, Nolte C (eds), pp 1254–1258. Berlin: Springer, Berlin, Heidelberg; [Google Scholar]
- Keyte A, Hutson MR (2012) The neural crest in cardiac congenital anomalies. Differentiation 84: 25–40 [DOI] [PMC free article] [PubMed] [Google Scholar]
- Keyte AL, Alonzo‐Johnsen M, Hutson MR (2014) Evolutionary and developmental origins of the cardiac neural crest: building a divided outflow tract. Birth Defects Res Part C ‐ Embryo Today Rev 102: 309–323 [DOI] [PMC free article] [PubMed] [Google Scholar]
- Kirby ML, Gale TF, Stewart DE (1983) Neural crest cells contribute to normal aorticopulmonary septation. Science (80‐) 220: 1059–1061 [DOI] [PubMed] [Google Scholar]
- La Manno G, Soldatov R, Zeisel A, Braun E, Hochgerner H, Petukhov V, Lidschreiber K, Kastriti ME, Lönnerberg P, Furlan A et al (2018) RNA velocity of single cells. Nature 560: 494–498 [DOI] [PMC free article] [PubMed] [Google Scholar]
- Lignell A, Kerosuo L, Streichan SJ, Cai L, Bronner ME (2017) Identification of a neural crest stem cell niche by Spatial Genomic Analysis. Nat Commun 8: 1830 [DOI] [PMC free article] [PubMed] [Google Scholar]
- Lin C‐J, Lin C‐Y, Chen C‐H, Zhou B, Chang C‐P (2012) Partitioning the heart: mechanisms of cardiac septation and valve development. Development 139: 3277–3299 [DOI] [PMC free article] [PubMed] [Google Scholar]
- Ling ITC, Sauka‐Spengler T (2019) Early chromatin shaping predetermines multipotent vagal neural crest into neural, neuronal and mesenchymal lineages. Nat Cell Biol 21: 1504–1517 [DOI] [PMC free article] [PubMed] [Google Scholar]
- Liu X, Chen W, Li W, Li Y, Priest JR, Zhou B, Wang J, Zhou Z (2019) Single‐cell RNA‐seq of the developing cardiac outflow tract reveals convergent development of the vascular smooth muscle cells. Cell Rep 28: 1346–1361.e4 [DOI] [PubMed] [Google Scholar]
- Nakamura T, Colbert MC, Robbins J (2006) Neural crest cells retain multipotential characteristics in the developing valves and label the cardiac conduction system. Circ Res 98: 1547–1554 [DOI] [PubMed] [Google Scholar]
- Paul MH, Harvey RP, Wegner M, Sock E (2014) Cardiac outflow tract development relies on the complex function of Sox4 and Sox11 in multiple cell types. Cell Mol Life Sci 71: 2931–2945 [DOI] [PMC free article] [PubMed] [Google Scholar]
- Plass M, Solana J, Wolf FA, Ayoub S, Misios A, Glažar P, Obermayer B, Theis FJ, Kocks C, Rajewsky N (2018) Cell type atlas and lineage tree of a whole complex animal by single‐cell transcriptomics. Science (80‐) 360: eaaq1723 [DOI] [PubMed] [Google Scholar]
- Plein A, Fantin A, Ruhrberg C (2015) Neural crest cells in cardiovascular development. Curr Top Dev Biol 111: 183–200 [DOI] [PubMed] [Google Scholar]
- Poelmann RE, Jongbloed MRM, Molin DGM, Fekkes ML, Wang Z, Fishman GI, Doetschman T, Azhar M, Gittenberger‐De Groot AC (2004) The neural crest is contiguous with the cardiac conduction system in the mouse embryo: a role in induction? Anat Embryol (Berl) 208: 389–393 [DOI] [PubMed] [Google Scholar]
- Prasad MS, Charney RM, García‐Castro MI (2019) Specification and formation of the neural crest: perspectives on lineage segregation. Genesis 57: 1–21 [DOI] [PMC free article] [PubMed] [Google Scholar]
- Qiu X, Hill A, Packer J, Lin D, Ma YA, Trapnell C (2017) Single‐cell mRNA quantification and differential analysis with Census. Nat Methods 14: 309–315 [DOI] [PMC free article] [PubMed] [Google Scholar]
- Riley PR, Smart N (2011) Vascularizing the heart. Cardiovasc Res 91: 260–268 [DOI] [PubMed] [Google Scholar]
- Sawada H, Rateri DL, Moorleghen JJ, Majesky MW, Daugherty A (2017) Smooth muscle cells derived from second heart field and cardiac neural crest reside in spatially distinct domains in the media of the ascending aorta ‐ brief report. Arterioscler Thromb Vasc Biol 37: 1722–1726 [DOI] [PMC free article] [PubMed] [Google Scholar]
- Schneider CA, Rasband WS, Eliceiri KW (2012) NIH Image to ImageJ: 25 years of image analysis. Nat Methods 9: 671–675 [DOI] [PMC free article] [PubMed] [Google Scholar]
- Sieber‐Blum M (2004) Cardiac neural crest stem cells. Anat Rec 276: 34–42 [DOI] [PubMed] [Google Scholar]
- Sinha S, Iyer D, Granata A (2014) Embryonic origins of human vascular smooth muscle cells: implications for in vitro modeling and clinical application. Cell Mol Life Sci 71: 2271–2288 [DOI] [PMC free article] [PubMed] [Google Scholar]
- Skelly DA, Squiers GT, McLellan MA, Bolisetty MT, Robson P, Rosenthal NA, Pinto AR (2018) Single‐cell transcriptional profiling reveals cellular diversity and intercommunication in the mouse heart. Cell Rep 22: 600–610 [DOI] [PubMed] [Google Scholar]
- Soldatov R, Kaucka M, Kastriti ME, Petersen J, Chontorotzea T, Englmaier L, Akkuratova N, Yang Y, Häring M, Dyachuk V et al (2019) Spatiotemporal structure of cell fate decisions in murine neural crest. Science (80‐) 364: eaas9536 [DOI] [PubMed] [Google Scholar]
- de Soysa TY, Ranade S, Okawa S, Ravichandran S, Huang Y, Salunga H, Schricker A, del Sol A, Gifford C, Srivastava D (2019) Single‐cell transcriptome analysis during cardiogenesis reveals basis for organ level developmental anomalies. Nature 572: 120–124 [DOI] [PMC free article] [PubMed] [Google Scholar]
- Stuart T, Butler A, Hoffman P, Hafemeister C, Papalexi E, Mauck WM, Hao Y, Stoeckius M, Smibert P, Satija R (2019) Comprehensive integration of single‐cell data. Cell 177: 1888–1902.e21 [DOI] [PMC free article] [PubMed] [Google Scholar]
- Szabó A, Mayor R (2018) Mechanisms of neural crest migration. Annu Rev Genet 52: 43–63 [DOI] [PubMed] [Google Scholar]
- Tang W, Martik ML, Li Y, Bronner ME (2019) Cardiac neural crest contributes to cardiomyocytes in amniotes and heart regeneration in zebrafish. Elife 8: 1–16 [DOI] [PMC free article] [PubMed] [Google Scholar]
- Tani‐Matsuhana S, Vieceli FM, Gandhi S, Inoue K, Bronner ME (2018) Transcriptome profiling of the cardiac neural crest reveals a critical role for MafB. Dev Biol 444: S209–S218 [DOI] [PMC free article] [PubMed] [Google Scholar]
- Trost A, Schroedl F, Lange S, Rivera FJ, Tempfer H, Korntner S, Stolt CC, Wegner M, Bogner B, Kaser‐Eichberger A et al (2013) Neural crest origin of retinal and choroidal pericytes. Investig Ophthalmol Vis Sci 54: 7910–7921 [DOI] [PubMed] [Google Scholar]
- Vanlandewijck M, He L, Mäe MA, Andrae J, Ando K, Del Gaudio F, Nahar K, Lebouvier T, Laviña B, Gouveia L et al (2018) A molecular atlas of cell types and zonation in the brain vasculature. Nature 554: 475–480 [DOI] [PubMed] [Google Scholar]
- Végh A, Duim S, Smits A, Poelmann R, ten Harkel A, DeRuiter M, Goumans M, Jongbloed M (2016) Part and parcel of the cardiac autonomic nerve system: unravelling its cellular building blocks during development. J Cardiovasc Dev Dis 3: 28 [DOI] [PMC free article] [PubMed] [Google Scholar]
- Volz KS, Jacobs AH, Chen HI, Poduri A, McKay AS, Riordan DP, Kofler N, Kitajewski J, Weissman I, Red‐Horse K (2015) Pericytes are progenitors for coronary artery smooth muscle. Elife 4: e10036 [DOI] [PMC free article] [PubMed] [Google Scholar]
- Wolf FA, Angerer P, Theis FJ (2018) SCANPY: large‐scale single‐cell gene expression data analysis. Genome Biol 19: 15 [DOI] [PMC free article] [PubMed] [Google Scholar]
- Wolock SL, Lopez R, Klein AM (2019) Scrublet: computational identification of cell doublets in single‐cell transcriptomic data. Cell Syst 8: 281–291.e9 [DOI] [PMC free article] [PubMed] [Google Scholar]
- Wu SH, Lee JH, Koo BK (2019) Lineage tracing: computational reconstruction goes beyond the limit of imaging. Mol Cells 42: 104–112 [DOI] [PMC free article] [PubMed] [Google Scholar]
- Zachariah MA, Cyster JG (2010) Neural crest‐derived pericytes promote egress of mature thymocytes at the corticomedullary junction. Science (80‐) 328: 1129–1135 [DOI] [PMC free article] [PubMed] [Google Scholar]
- Zheng GXY, Terry JM, Belgrader P, Ryvkin P, Bent ZW, Wilson R, Ziraldo SB, Wheeler TD, McDermott GP, Zhu J et al (2017) Massively parallel digital transcriptional profiling of single cells. Nat Commun 8: 14049 [DOI] [PMC free article] [PubMed] [Google Scholar]
- Zhou B, Ma Q, Rajagopal S, Wu SM, Domian I, Rivera‐Feliciano J, Jiang D, von Gise A, Ikeda S, Chien KR et al (2008) Epicardial progenitors contribute to the cardiomyocyte lineage in the developing heart. Nature 454: 109–113 [DOI] [PMC free article] [PubMed] [Google Scholar]