

Abstract
TRPV3, a representative of the vanilloid subfamily of TRP channels, is predominantly expressed in skin keratinocytes and has been implicated in cutaneous sensation and associated with numerous skin pathologies and cancers. TRPV3 is inhibited by the natural coumarin derivative osthole, an active ingredient of Cnidium monnieri, which has been used in traditional Chinese medicine for the treatment of a variety of human diseases. However, the structural basis of channel inhibition by osthole has remained elusive. Here we present cryo‐EM structures of TRPV3 in complex with osthole, revealing two types of osthole binding sites in the transmembrane region of TRPV3 that coincide with the binding sites of agonist 2‐APB. Osthole binding converts the channel pore into a previously unidentified conformation with a widely open selectivity filter and closed intracellular gate. Our structures provide insight into competitive inhibition of TRPV3 by osthole and can serve as a template for the design of osthole chemistry‐inspired drugs targeting TRPV3‐associated diseases.
Keywords: competitive inhibitor, cryo‐EM, osthole, single‐channel recordings, TRP channels
Subject Categories: Membranes & Trafficking, Molecular Biology of Disease, Structural Biology
Osthole acts as competitive inhibitor of TRPV3 and converts the channel pore into a conformation with a widely open selectivity filter and closed intracellular gate.

Introduction
TRPV3, a representative of the vanilloid subfamily of transient receptor potential (TRP) channels, is predominantly expressed in skin keratinocytes (Peier et al, 2002; Smith et al, 2002; Xu et al, 2002; Szollosi et al, 2018) but is also detected in corneal (Yamada et al, 2010) and distal colon epithelial cells (Ueda et al, 2009). TRPV3 is implicated in cutaneous sensation, including thermosensation (Peier et al, 2002; Smith et al, 2002; Xu et al, 2002; Chung et al, 2004; Moqrich et al, 2005; Mandadi et al, 2009), nociception, and itch (Yamamoto‐Kasai et al, 2012; Cui et al, 2018; Zhao et al, 2020), in addition to maintenance of the skin barrier and wound healing (Yamada et al, 2010; Miyamoto et al, 2011; Aijima et al, 2015), hair growth (Asakawa et al, 2006; Imura et al, 2007; Cheng et al, 2010), and embryonic development (Carvacho et al, 2013). The dysfunction of TRPV3 channels, often a result of channelopathies represented by gain‐of‐function mutations, is associated with numerous skin diseases, including a genodermatosis known as Olmsted syndrome, atopic dermatitis, dermal fibrosis, rosacea, and itch (Lin et al, 2012; Sulk et al, 2012; Duchatelet et al, 2014; Ni et al, 2016; Sun et al, 2018; Qu et al, 2019; Zhang et al, 2019; Um et al, 2020). Furthermore, overexpression of TRPV3 is implicated in the development and progression of cancer (Li et al, 2016). Correspondingly, inhibition of TRPV3 might be beneficial for the treatment of a multitude of diseases.
Recently, it has been reported that TRPV3 is inhibited by a coumarin osthole, 7‐methoxy‐8‐(3‐methyl‐2‐butenyl)‐2H‐1‐benzopyran‐2‐one, an active ingredient of Cnidium monnieri as well as in other medicinal plants, such as Angelica, Archangelica, Citrus, and Clausena (Zhang et al, 2015). Accordingly, the discovered antipruritic effects of osthole have been linked to its inhibition of TRPV3 (Sun et al, 2018). In fact, osthole has been used in traditional Chinese medicine for the treatment of skin‐related diseases, such as atopic dermatitis, itch, vaginitis, and vulva eczema (You et al, 2009; Yang et al, 2016). Also relevant to TRPV3, osthole exhibits anticancer activity in different types of cancer, including breast, pancreatic, and gastric cancer (Zhang et al, 2015; Shokoohinia et al, 2018).
In order to better understand the molecular mechanism of TRPV3 inhibition by osthole and to gain knowledge necessary to design better drugs for treatment of atopic dermatitis, itch, inflammatory skin diseases, and various types of cancer, we embarked on structural characterization of the TRPV3‐osthole complex using cryo‐electron microscopy (cryo‐EM). We found that osthole binds to two different sites in the transmembrane domain (TMD) of TRPV3 and converts the channel pore into a unique and previously unseen conformation, with widely open selectivity filter and closed intracellular gate. Our structures provide structural evidence for and mechanistic understanding of the allosteric inhibition of TRPV3 by a natural compound that can serve as a template for the design of new drugs targeting various TRPV3‐linked diseases.
Results and Discussion
Functional characterization and cryo‐EM
To study osthole inhibition, we chose mouse TRPV3 (mTRPV3), which we used in our previous structural studies and which shares 93% sequence identity with human TRPV3. We tested the functional effect of osthole on wild‐type mTRPV3 activated by the agonist 2‐APB. In the absence of osthole, 5 μM 2‐APB induced robust single‐channel currents through wild‐type mTRPV3 incorporated into a lipid bilayer with the open probability (Po ) of 0.54 ± 0.15 (n = 10, number of events (NE) analyzed = 1,436) and the single‐channel conductance of 122.6 ± 5.6 pS (n = 10) (Fig 1A and B). Application of 5–50 μM osthole significantly reduced single‐channel activity, with almost none of it (Po = 0.00134 ± 0.00168, n = 10, NE = 92) observed at 50 μM osthole (Fig 1A and B).
Figure 1. Osthole inhibition and cryo‐EM.

-
ARepresentative single‐channel recordings at 80 mV membrane potential from mTRPV3 incorporated into a planar lipid bilayer, in response to 5 μM 2‐APB alone, or in combination with 5, 25, or 50 μM osthole.
-
BmTRPV3 open probability (Po ) at 80 mV in the presence of agonist 2‐APB and inhibitor osthole (0 vs. 5 μM osthole, ****P = 0.27 × 10⁻⁵; vs. 25 μM osthole ****P = 0.79 × 10⁻⁵; vs. 50 μM osthole ****P = 0.7 × 10⁻⁵, n = 10 independent experiments). Shown are also the chemical structures of 2‐APB and osthole. Statistical significance was calculated using one‐way ANOVA followed by Fisher’s least significant difference test. The data presented are mean ± SEM.
-
C, D3D cryo‐EM reconstruction of mTRPV3‐Y564AOsthole viewed from the side (C) or top (D), with TRPV3 subunits colored in green, yellow, purple, and cyan. Osthole densities at sites 2 and 3 are colored in red and labeled.
Wild‐type mTRPV3 has been previously characterized by cryo‐EM in the presence or absence of 2‐APB and the resulting structures were in the closed non‐conducting states (Singh et al, 2018a). We identified the Y564A mutation that increased affinity of mTRPV3 to 2‐APB. In the absence of 2‐APB, the mTRPV3‐Y564A construct yielded a closed‐state structure identical to wild‐type, while in the presence of 2‐APB, it produced the open‐state structure (Singh et al, 2018a). To be able to monitor TRPV3 inhibition structurally, we therefore focused on the mTRPV3‐Y564A construct. At 5 µM 2‐APB, mTRPV3‐Y564A demonstrated somewhat higher Po (0.74 ± 0.10, n = 9, NE = 2203) but similar single‐channel conductance (126.4 ± 8.1 pS, n = 9) to wild‐type mTRPV3 (Fig EV1A and B). In the presence of 50 µM osthole, mTRPV3‐Y564A single‐channel activity was even more strongly reduced than the activity of wild‐type mTRPV3, with Po = 0.000185 ± 0.00168 (n = 9, NE = 45).
Figure EV1. Comparison of mTRPV3 and mTRPV3‐Y564A single‐channel activity and osthole inhibition.
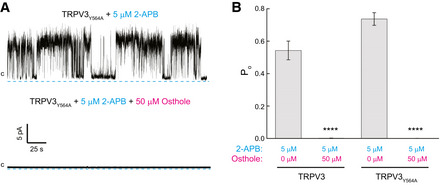
- Representative single‐channel recordings at 80 mV membrane potential from mTRPV3‐Y564A incorporated into a planar lipid bilayer, in response to 5 μM 2‐APB alone or in combination with 50 μM osthole.
- Open probability for mTRPV3 and mTRPV3‐Y564A at 80 mV in the presence of agonist 2‐APB and osthole (0 vs. 50 μM osthole: ****P = 0.7 × 10⁻⁵ for mTRPV3 and ****P = 0.4 × 10⁻⁹ for mTRPV3‐Y564A, n = 9 independent experiments). Statistical significance was calculated using one‐way ANOVA followed by Fisher’s least significant difference test. The data presented are mean ± SEM.
We determined a cryo‐EM structure of mTRPV3‐Y564A in the presence of 0.4 mM osthole. Micrographs of mTRPV3‐Y564AOsthole showed particles with diverse angular coverage and secondary structure features were readily visible in 2D class averages (Fig EV2A–F). Processing of these data (Fig EV3) resulted in 3D reconstruction of the mTRPV3‐Y564AOsthole map with 4‐fold rotational symmetry (C4) and the overall resolution of 3.64 Å (Figs 1C and D, and EV4, Table EV1). The map quality was sufficient for building an accurate model of the mTRPV3‐Y564AOsthole homotetramer for residues 115–756, excluding regions of the S1‐S2 (residues 463–476), S2‐S3 (residues 509–513) and S5‐P (residues 610–622) loops that were not represented clearly in cryo‐EM density.
Figure EV2. Overview of cryo‐EM data for mTRPV3‐Y564A.

-
A–FRepresentative micrographs with example particles circled in red (A, D), reference‐free 2D class averages (B, E), and Euler angle distribution of particles contributing to the final reconstructions with larger red cylinders representing orientations comprising more particles (C, F) for mTRPV3‐Y564Aosthole (A–C) and mTRPV3‐Y564A2APB+osthole (D–F).
Figure EV3.

3D reconstruction workflow for mTRPV3‐Y564Aosthole
Figure EV4. Resolution of mTRPV3‐Y564A cryo‐EM reconstructions.

-
A–DFSC curves (A‐B) and the local resolution presented as coloring of the cryo‐EM maps (C‐D) for mTRPV3‐Y564Aosthole (A, C) and mTRPV3‐Y564A2APB+osthole (B, D).
Structure and osthole binding sites
The overall architecture of mTRPV3‐Y564AOsthole (Fig 2A and B) is reminiscent of TRPV3 structures solved previously (Singh et al, 2018a, 2019; Zubcevic et al, 2018, 2019; Deng et al, 2020; Shimada et al, 2020; Nadezhdin et al, 2021) and includes the ion channel formed by TMDs of individual subunits, each contributing the S1‐S4 and pore domains in a domain‐swapped arrangement, and a large intracellular skirt that is primarily assembled of the ankyrin‐repeat domains (ARDs). Each ARD is connected to the TMD by a linker domain. Amphipathic TRP helices run nearly parallel to the membrane and interact with both the ARD and TMD.
Figure 2. Structure and osthole binding sites.

-
A, BmTRPV3‐Y564AOsthole structure viewed from the side (A) or top (B), with TRPV3 subunits colored in green, yellow, purple and cyan. Red mesh shows cryo‐EM densities for osthole.
-
C, DClose‐up views of site 2 (C) and site 3 (D), with red mesh showing densities for osthole. Osthole molecules and residues surrounding them are shown as sticks. Positions of residue substitutions in functional experiments (E) are labeled in red.
-
EDose–response curves for inhibition of wild‐type and mutant TRPV3 channels by osthole. The changes in the fluorescence intensity ratio at 340 and 380 nm (F 340/F 380) evoked by addition of 200 μM (wild type, R487A, Y540A) or 25 μM (Y564A) of 2‐APB or 5 mM of camphor (H426A) after pre‐incubation with various concentrations of osthole were normalized to their maximal values in the absence of osthole. Data points are mean ± SEM. Curves through the points are logistic equation fits, with the mean ± SEM values of the half‐maximal inhibitory concentration (IC50 ) and the Hill coefficient (n Hill), 20.5 ± 0.5 μM and n Hill = 1.84 ± 0.14 (n = 4 technical replicates) for mTRPV3, 44.3 ± 7.4 μM and n Hill = 0.76 ± 0.11 (n = 4 technical replicates) for mTRPV3‐Y540A, 54.3 ± 1.5 μM and n Hill = 1.66 ± 0.07 (n = 3 technical replicates) for mTRPV3‐R487A, 88.2 ± 11.0 μM and n Hill = 0.86 ± 0.09 (n = 8 technical replicates) for mTRPV3‐Y564A, and 141 ± 5 μM and n Hill = 2.44 ± 0.21 (n = 3 technical replicates) for mTRPV3‐H426A.
-
FDouble logarithmic Schild plot for 2‐APB concentration dependencies of TRPV3 activation in the presence of 10 µM (green squares, n = 6 technical replicates) and 30 µM (red circles, n = 6 technical replicates) osthole. Data points are mean ± SEM. Lines are linear fits.
We observed two non‐protein densities with the shape of osthole in each subunit of mTRPV3‐Y564AOsthole (Fig 2C and D). Their locations coincide with the binding sites 2 and 3 previously identified in studies of TRPV3 activation by the agonist 2‐APB (Singh et al, 2018a). One density (site 2 for 2‐APB) is located in a pocket formed by the intracellular half of the S1‐S4 bundle and the C‐terminal portion of the TRP helix (Fig 2C). In the absence of ligands, this pocket harbors a putative lipid, not only in TRPV3 (Singh et al, 2018a, 2019; Zubcevic et al, 2018, 2019; Deng et al, 2020; Shimada et al, 2020) but also in other TRPV channels (Gao et al, 2016; Zubcevic et al, 2016; Hughes et al, 2018; McGoldrick et al, 2018). An analogous pocket binds 2‐APB (Singh et al, 2018b) in TRPV6, as well as icilin and menthol analog WS‐18 in TRPM8 (Yin et al, 2018). We tested binding of osthole to site 2 using the Fura‐2 acetoxymethyl (AM) ester‐based measurements of changes in intracellular Ca2+ (Fig 2E) and found that the Y564A mutation in site 2 increased the IC 50 value of osthole inhibition to 88 ± 10 µM (n = 7), compared to 20.5 ± 0.5 µM (n = 7) for wild‐type channels. Our functional experiments, therefore, confirmed binding of osthole to site 2.
Another density (site 3 for 2‐APB) is located at the nexus of the linker domain and pre‐S1 and TRP helices and also matches the size and shape of osthole (Fig 2D). This site is contributed by residues R696, R693, H430, and H426. In fact, H426A mutation has previously been shown to alter TRPV3 activation by 2‐APB (Hu et al, 2009; Singh et al, 2018a). In analogy, we tested the effect of H426A on osthole inhibition using the Fura‐2 AM assay (Fig 2E) and found that the IC 50 value for the H426A mutant, 141 ± 5 µM (n = 6), was significantly increased compared to this value for wild‐type channels, 20.5 ± 0.5 µM (n = 7), strongly supporting binding of osthole to site 3.
Since osthole appears to bind to sites 2 and 3, which are also 2‐APB binding sites, we questioned whether another site of 2‐APB binding in TRPV3, site 4, can also bind osthole. Site 4 is nested in a cavity formed by the extracellular portions of helices S1‐S4, which in the closed‐state TRPV3 structure is occupied by the S1‐S2 loop (Singh et al, 2018a). 2‐APB binding at site 4 is mediated by several residues, including R487 and Y540. We mutated these two residues to alanines and tested osthole inhibition using the Fura‐2 AM assay. Both R487A (IC 50 = 54.3 ± 1.5 µM, n = 3) and Y540A (IC 50 = 44.3 ± 7.4 µM, n = 4) weakened osthole inhibition, suggesting that osthole may also bind to site 4, even though poorly resolved density in this region does not provide structural support for such interaction. Interestingly, two mutations that we introduced to test osthole binding sites only caused a rightward shift of the concentration‐response curve (R487A and H426A), while two others (Y540A and Y564A) also resulted in curve flattening (Fig 2E). A possible explanation for this behavior is that the first two mutations weakened osthole binding, while the other two destroyed one of the osthole binding sites, something that can be tested in future experiments. Overall, binding of osthole to at least two of three binding sites of agonist 2‐APB makes it an allosteric competitive inhibitor of TRPV3.
To test the competitive character of TRPV3 inhibition by osthole, we measured 2‐APB concentration dependencies of TRPV3 activation at two different concentrations of osthole, 10 and 30 µM. To outcompete osthole, we used the range of 2‐APB concentrations (50–400 µM for 10 µM osthole and 100–800 µM for 30 µM osthole) that exceeded the previously measured value of 2‐APB half maximal effective concentration (EC 50, 27.4 µM; Singh et al, 2018a). The resulting 2‐APB concentration dependencies in double logarithmic coordinates (Schild plots; Arunlakshana & Schild, 1959, Fig 2F) showed similar linear slopes (0.51 ± 0.03 for 10 µM osthole and 0.43 ± 0.01 for 30 µM osthole), strongly supporting the competition of 2‐APB and osthole for the same binding sites.
Conformational changes accompanying osthole inhibition
In addition to mTRPV3‐Y564AOsthole, we also solved the structure of mTRPV3‐Y564A in the presence of osthole (400 µM) and 2‐APB (40 µM), mTRPV3‐Y564A2APB‐Osthole. Since mTRPV3‐Y564AOsthole and mTRPV3‐Y564A2APB‐Osthole are very similar (Fig EV5A–C) but mTRPV3‐Y564AOsthole has better resolution (3.64 Å) than mTRPV3‐Y564A2APB‐Osthole (3.99 Å), we use the mTRPV3‐Y564AOsthole structure to characterize major conformational changes introduced by osthole. To reveal structural changes accompanying osthole inhibition, we compared the mTRPV3‐Y564AOsthole structure with the previously solved open‐state mTRPV3‐Y564A2APB structure (Singh et al, 2018a) (Fig 3).
Figure EV5. Comparison of mTRPV3‐Y564Aosthole with mTRPV3‐Y564A2APB‐osthole and mTRPV3 structures and pore radii.

-
A, BSuperposition of mTRPV3‐Y564Aosthole (green) and mTRPV3‐Y564A2APB‐osthole (purple) viewed parallel to the membrane (A) and extracellularly (B) with the osthole molecules shown as space‐filling models.
-
CSuperposition of the pore‐forming S6 and P‐loop domains with the pore‐lining residues shown as sticks.
-
DSuperposition of a single pore‐forming domain in the closed apo (blue) and antagonist osthole‐bound (green) TRPV3. Movement of the N‐terminal end of the TRP helix and P helix in mTRPV3 compared to mTRPV3‐Y564Aosthole is indicated by green arrows. The kink in S5 of mTRPV3‐Y564Aosthole is indicated.
-
ESuperposition of the pore‐forming S6 and P‐loop domains with the pore‐lining residues shown as sticks.
-
FPore radius for mTRPV3 (blue), mTRPV3‐Y564A2APB (orange), mTRPV3‐Y564Aosthole (green), and mTRPV3‐Y564A2APB+osthole (purple). The vertical dashed line denotes the radius of a water molecule, 1.4 Å.
Figure 3. Comparison of 2‐APB‐bound open and osthole‐bound closed TRPV3 structures.

-
A, BSuperposition of transmembrane domains in mTRPV3‐Y564A2APB (orange) and mTRPV3‐Y564Aosthole (green) viewed parallel to the membrane (A) and extracellularly (B), with molecules of 2‐APB and osthole shown as space‐filling models. In (A), only two of four TRPV3 subunits are shown, with the front and back subunits omitted for clarity. In (B), rotation of the pore‐forming domains in mTRPV3‐Y564Aosthole compared to mTRPV3‐Y564A2APB is indicated by green arrows.
-
CSuperposition of a single pore‐forming domain in mTRPV3‐Y564A2APB and mTRPV3‐Y564Aosthole. Movement of TRP and P helices in mTRPV3‐Y564Aosthole compared to mTRPV3‐Y564A2APB is indicated by green arrows. The region of S6 that undergoes α‐to‐π transition is highlighted in red. The kink in S5 of mTRPV3‐Y564Aosthole is indicated.
-
D, EPore‐forming domains in mTRPV3‐Y564A2APB and mTRPV3‐Y564Aosthole with residues lining the pore shown as sticks. Only two of four subunits are shown, with the front and back subunits omitted for clarity. The pore profiles are shown as space‐filling models (gray).
Binding of osthole results in larger separation of S1 and S2 as well as pre‐S1 and TRP helix. The first conformational change leads to movement of S3 and S4 away from the center of the pore. This in turn is followed by movement of S5 and S6 that results in a dramatic widening of the upper pore, including the selectivity filter, which is accompanied by an anticlockwise rotation of these domains when viewed extracellularly and a change in the tilt of the P‐helix relative to the pore axis (Fig 3A and B). On the other hand, movement of the TRP helix as a consequence of S5 and S6 dislocation leads to a kink in the S4‐S5 linker, which has not been observed in TRPV structures previously (Figs 3C and EV5D). This kink allows to disconnect the widening rearrangement of the upper pore from its gate region on the intracellular side. It also allows larger separation of S5 and S6, which is accompanied by a π‐to‐α transition in S6. Concomitantly, the lower portion of S6 below the π‐to‐α bulge rotates by ˜100° and exposes a different set of residues to the ion channel pore. These include methionines M677, which now hydrophobically seal the pore, finalizing conversion from the open (Fig 3D) to the osthole‐bound closed state (Fig 3E). Similar to the previously documented open‐to‐closed‐state transition in TRPV3 that is accompanied by the π‐to‐α transition in S6 (Singh et al, 2018a), the S6 helix becomes two helical turns shorter and the TRP helix two helical turns longer (Fig 3C).
Mechanism and implications of TRPV3 inhibition by osthole
Osthole produces TRPV3 inhibition by binding to the same sites as the agonist 2‐APB. This competitive antagonism does not require the agonist binding sites to be vacant. Indeed, similarity between mTRPV3‐Y564A2APB‐Osthole and mTRPV3‐Y564AOsthole structures (Fig EV5) and differences between mTRPV3‐Y564A2APB‐Osthole and mTRPV3‐Y564A2APB structures (Fig 3) suggest that osthole can outcompete 2‐APB from its binding sites. When bound, osthole does not convert TRPV3 back to its closed apo state‐like conformation but rather produces a new non‐conducting conformation (Fig EV5D and E). How do the corresponding conformational changes happen as a result of binding of osthole, which is a small molecule similar in size to 2‐APB? To answer this question, we individually superposed regions of mTRPV3‐Y564A2APB and mTRPV3‐Y564AOsthole structures encompassing binding sites 2–4 (Fig 4).
Figure 4. Comparison of binding site 2–4 regions in 2‐APB‐ and osthole‐bound structures.

-
A–CSuperposed regions of site 2 (A), 3 (B), and 4 (C) in mTRPV3‐Y564A2APB (orange) and mTRPV3‐Y564Aosthole (green) structures, with molecules of 2‐APB and osthole shown as ball‐and‐stick models. Residues contributing to ligand binding are shown as sticks. Arrows in C show movement of domains in mTRPV3‐Y564Aosthole compared to mTRPV3‐Y564A2APB. Residues mutated in functional experiments (Fig 2E) are labeled in red.
At sites 2 and 3, the structural environment of 2‐APB and osthole molecules is very similar, suggesting that binding to these sites is unlikely to cause drastic structural rearrangements (Fig 4A and B). In contrast, site 4 appears structurally different in mTRPV3‐Y564A2APB and mTRPV3‐Y564AOsthole, with a larger separation of S2 and S3 in the 2‐APB‐bound structure (Fig 4C). Relative movement of S3 toward S2 in mTRPV3‐Y564AOsthole, which is apparent from changes in side chain positions for Y460, Y461 and R462 in S3 and R487 in S2, is accompanied by movement of S5 and P‐loop helix followed by S6 toward the S1‐S4 bundle, which is apparent from changes in side chain positions for V603 and S607 in S5 and F625 and S626 in P‐loop. Therefore, site 4 appears to play the most critical role in the osthole‐induced conformational changes, further supporting the direct binding of the inhibitor to this site, while sites 2 and 3 are modulatory (Fig 2E). Since the molecule of osthole at site 4 is unresolved in our structures, additional research will be necessary to advance understanding of osthole’s action at site 4.
The osthole‐induced movement of S5, P‐loop helix and S6 toward the S1–S4 bundle results in a dramatic widening of the selectivity filter, which is the signature of osthole inhibition. This widening is largest in mTRPV3‐Y564AOsthole (Fig 3D and E) but is also easily noticeable in mTRPV3‐Y564A2APB‐Osthole (Fig EV5F). Between these two structures, the selectivity filter is slightly narrower in mTRPV3‐Y564A2APB‐Osthole, which might be a result of incomplete replacement of 2‐APB by osthole. Previously, no substantial widening of the selectivity filter was observed during activation gating of mTRPV3. Indeed, while the narrowest constriction of the selectivity filter was shown to be formed by the backbone carbonyl of L639 in the closed state and backbone carbonyl of G638 in the open state, the diameter of the narrowest constriction remained about the same (with interatomic distance of ˜7.5 Å) (Singh et al, 2018a). The selectivity filter in human TRPV3 was found to be somewhat wider in the open (˜6.8 Å, measured as a distance between G638; PDB ID: 6UW6) compared to the closed state (˜4.5 Å, measured as a distance between G638; PDB ID: 6UW4; Deng et al, 2020). Nevertheless, the selectivity filter in the osthole‐bound closed‐state mTRPV3‐Y564AOsthole (˜11.4 Å, measured as a distance between I637) is substantially wider than in any previously published TRPV3 structure. We suspect that osthole, while stabilizing the gate region of TRPV3, destabilizes its selectivity filter. Indeed, the majority of particles in mTRPV3‐Y564A2APB‐Osthole and mTRPV3‐Y564AOsthole micrographs had 2‐fold symmetrical appearance, a likely feature of transitional conformational states (Zubcevic et al, 2018; Singh et al, 2019). Attempts to use these particles for 3D reconstruction resulted in densities with a missing ion channel core, similar to the intermediate conformational state of mTRPV3‐Y564A heated to 37 °C (Singh et al, 2019).
Despite the potential disruptive effect of osthole on TRPV3, it might only be relevant to high osthole concentrations. In fact, pharmacokinetic studies have previously demonstrated fast and efficient osthole uptake and utilization in the body (Zhang et al, 2015). The usefulness of osthole and its derivatives for disease treatment might also be due to their action on numerous targets. Indeed, beyond targeting TRPV3 (Sun et al, 2018; Qu et al, 2019) and TRPV1 (Yang et al, 2016), osthole has been found to regulate various types of sodium, acid‐sensing and cystic fibrosis transmembrane conductance regulator (CFTR) ion channels, and its vasorelaxant, immunomodulatory, antifibrotic, neuroprotective, anticonvulsant, and pain‐relieving effects have been linked to its interaction with some of these ion channels (Leung et al, 2010; Zhang et al, 2015). While many pharmacological effects of osthole are yet to be determined, our structures provide the first glimpse on its inhibition of TRPV3. These structures open new avenues for rational osthole‐inspired drug design for the treatment of TRPV3‐linked diseases.
Materials and Methods
Expression and purification
mTRPV3‐Y564A was expressed and purified as previously described (Singh et al, 2018a, 2019) with slight modification. In short, bacmids and baculoviruses were produced using a standard method (Goehring et al, 2014). Baculovirus was made in Sf9 cells for ˜72 h (Thermo Fisher Scientific, mycoplasma test negative, GIBCO #12659017) and was added to the suspension‐adapted HEK 293S cells lacking N‐acetyl‐glucosaminyltransferase I (GnTI−, mycoplasma test negative, ATCC #CRL‐3022) that were maintained at 37°C and 5% CO2 in Freestyle 293 media (Gibco‐Life Technologies #12338‐018) supplemented with 2% FBS. To enhance protein expression, sodium butyrate (10 mM) was added 12 h after transduction and the temperature was reduced to 30°C. At 48–72 h post‐transduction, the cells were harvested by centrifugation at 5,471 g for 15 min using a Sorvall Evolution RC centrifuge (Thermo Fisher Scientific), washed in phosphate buffer saline (PBS) pH 8.0, and pelleted by centrifugation at 3,202 g for 10 min using an Eppendorf 5810 centrifuge. The cell pellet was resuspended in ice‐cold lysis buffer, containing Tris pH 8.0 (20 mM), NaCl (150 mM), Aprotinin (0.8 μM), Leupeptin (4.3 μM), Pepstatin A (2 μM), phenylmethylsulfonyl fluoride (PMSF) (1 μM), and β‐mercaptoethanol (βME) (1 μM). Cells were subsequently lysed using a Misonix Sonicator with a preset program (6 cycles of 15 s “on” at the amplitude of 8 followed by 15 s “off”; this program was repeated 3 times for optimal cell lysis) under constant stirring on ice. Unbroken cells and cell debris were pelleted in an Eppendorf 5810 centrifuge at 3,202 g and 4°C for 10 min. The supernatant was subjected to ultracentrifugation in a Beckman Coulter ultracentrifuge using a Beckman Coulter Type 45Ti rotor at 186,000 g and 4°C for 1 h in order to pellet the membranes. The membrane pellet was mechanically homogenized and solubilized in lysis buffer supplemented with 2% (w/v) digitonin under constant stirring at 4°C for 2 h. Insoluble material was removed by ultracentrifugation for 40 min in a Beckman Coulter Type 45Ti rotor at 186,000 g, and the supernatant was added to strep resin and rotated for 14–16 h at 4°C. Next, the resin was washed with 10 column volumes of wash buffer containing Tris (20 mM) pH 8.0, NaCl (150 mM), βME (1 mM) and glyco‐diosgenin (GDN) (0.01%, w/v) and the protein was eluted with the same buffer supplemented with D‐desthiobiotin (2.5 mM). The eluted protein was concentrated using a 100 kDa NMWL centrifugal filter (MilliporeSigma™ Amicon™) to 0.5 ml and then centrifuged in a Sorvall MTX 150 Micro‐Ultracentrifuge (Thermo Fisher Scientific) using a S100AT4 rotor for 30 min at 66,000 g and 4°C before injection into a size‐exclusion chromatography (SEC) column. The protein was further purified using a Superose™ 6 10/300 GL SEC column attached to an AKTA FPLC (GE Healthcare) and equilibrated in NaCl (150 mM), Tris pH 8.0 (20 mM), βME (1 mM), and GDN (0.01%). The tetrameric peak fractions were pooled and concentrated using 100 kDa NMWL centrifugal filter (MilliporeSigma™ Amicon™) to 2–4 mg ml−1. Osthole was dissolved in DMSO to a concentration of 52 mM and added to the protein 30 min before grid preparation.
Cryo‐EM sample preparation and data collection
Au/Au grids were prepared as described previously (Russo & Passmore, 2014). Briefly, grids were prepared by first coating C‐flat (Protochips, Inc., Morrisville, NC) CF‐1.2/1.3‐2Au mesh holey carbon grids with ˜60 nm gold using an Edwards Auto 306 evaporator. Subsequently, an Ar/O2 plasma treatment (4 min, 50 watts, 35.0 sccm Ar, 11.5 sccm O2) was used to remove the carbon with a Gatan Solarus (model 950) Advanced Plasma Cleaning System (Gatan, Pleasanton, CA, USA). The grids were again plasma treated (H2/O2, 25 s, 10 watts, 6.4 sccm H2, 27.5 sccm O2) prior to sample application to make their surfaces hydrophilic. A Mark IV Vitrobot (Thermo Fisher Scientific) set to 100% humidity at 4°C was used to plunge‐freeze the grids in liquid ethane after applying 3 µl of protein sample to their gold‐coated side using a blot time of 3 s, a blot force of 3 and a wait time of 20 s. The grids were stored in liquid nitrogen before imaging.
Images of frozen‐hydrated particles of mTRPV3‐Y564AOsthole were collected on a Titan Krios transmission electron microscope (TEM) (Thermo Fisher Scientific) operating at 300 kV and equipped with a post‐column GIF Quantum energy filter and a Gatan K3 Summit direct electron detection (DED) camera (Gatan, Pleasanton, CA, USA). 3,991 micrographs were collected in the counting mode with an image pixel size of 0.83 Å across a defocus range of −1.5 to −2.5 µm. A total dose of ˜58 e−Å−2 was attained by using a dose rate of ˜16 e−pixel−1s−1 across 50 frames of the total 2.5‐s exposure time. Images of frozen‐hydrated particles of mTRPV3‐Y564A2APB+osthole were collected on a Polara TEM (FEI) operating at 300 kV and equipped with a Schottky field emission gun, cartridge loading system, and a Gatan K3 Summit DED camera. 3,977 micrographs were collected in the counting mode with the image pixel size of 1.1 Å across a defocus range of −1.5 to −3.5 μm. A total dose of ˜96.5 e− Å−2 was attained by using a dose rate of ˜16 e− pixel−1 s−1 across 40 frames of the total 4‐s exposure time.
Image processing and 3D reconstruction
All datasets were processed in RELION (Scheres, 2012) or cryoSPARC (Punjani, Rubinstein et al, 2017). Movies were motion‐corrected with MotionCor2 (Zheng, Palovcak et al, 2017) algorithm implemented in RELION. Contrast transfer function (CTF) estimation was performed on non‐dose‐weighted micrographs using Gctf (Zhang, 2016). Subsequent data processing was done on dose‐weighted micrographs. Following CTF estimation, micrographs were manually inspected and those with outliers in defocus values, ice thickness, and astigmatism as well as micrographs with lower predicted CTF‐correlated resolution (higher than 5 Å) were excluded from further processing (individually assessed for each parameter relative to the overall distribution). Particles were picked using the previously published mTRPV3‐Y564A structure (EMD‐20494) as a template and further classified into 2D classes. A selection of 2D classes was used to generate templates that were further used for template‐based picking. Picked particles were subjected to several rounds of selection through 2D and 3D classification. Selected 3D classes were used for 3D template generation and refinement. The reported resolutions of the final maps were estimated using the gold standard Fourier shell correlation (GSFSC) in cryoSPARC. The local resolution predictions were calculated in cryoSPARC, with the resolution range estimated using the FSC = 0.143 criterion (Scheres, 2012). Cryo‐EM density visualization was done in UCSF Chimera (Pettersen et al, 2004).
As an example, 1,102,239 particles of mTRPV3‐Y564AOsthole were picked in RELION using the previously published mTRPV3‐Y564A structure (EMD‐20494) as a 3D reference. After several rounds of selection through 2D and 3D classification, 580,844 particles (representing 11 classes) were extracted using 4× binning (128‐pixel binned box size) and 3D‐classified twice into five classes. The final particle stack of 68,101 particles was further refined using 3D refinement, CTF refinement, and Bayesian polishing in RELION. The particles stack together with the corresponding final postprocessed map, resulting in a 3.73 Å reconstruction, were imported into cryoSPARC and non‐uniformly refined to a final map at 3.64‐Å resolution. Throughout the processing, we observe a dominant 2‐fold symmetrical shape of mTRPV3‐Y564AOsthole tetramer, with ARDs stretched into a diamond‐shape and visibly distorted TMD. 3D reconstructions of the C2‐symmetrical particles resulted in maps with poorly resolved TMDs.
Model building
To build models of mTRPV3 in Coot (Emsley et al, 2010), we used the previously published cryo‐EM structures of TRPV3 as guides (Singh et al, 2018a, 2019). The models were tested for overfitting by shifting their coordinates by 0.5 Å (using Shake) in Phenix (Adams et al, 2010), refining each shaken model against the corresponding unfiltered half map, and generating densities from the resulting models in Chimera. Structures were visualized and figures were prepared in UCSF Chimera, UCSF ChimeraX (Pettersen et al, 2021), and Pymol (Afonine et al, 2012). Pore radius was calculated using HOLE (Smart et al, 1996).
FURA‐2 AM measurements
GFP‐free C‐terminally strep‐tagged wild‐type mTRPV3, mTRPV3‐H426A, mTRPV3‐H487A, mTRPV3‐Y540A, and mTRPV3‐Y564A were expressed in HEK 293S cells as previously described (Singh et al, 2018a, 2019). In short, 48 h after transduction, 1‐ml aliquots of cell suspension were collected by centrifugation at 500 g for 5 min using an Eppendorf 5424 centrifuge. The cells were resuspended in pre‐warmed modified HEPES‐buffered saline solution (HBS: NaCl (118 mM), KCl (4.8 mM), MgCl2 (1 mM), D‐glucose (5 mM), and HEPES pH 7.4 (10 mM)) containing Fura‐2 AM (5 μg ml−1) (Thermo Fisher Scientific) and incubated at 37°C for 45 min. The Fura‐2‐loaded cells were then centrifuged for 5 min at 500 g, resuspended in pre‐warmed, modified HBS, and incubated again at 37°C for 30 min in the dark. The cells were subsequently pelleted and washed twice in modified HBS. The washed cell pellets were kept on ice in the dark before an aliquot was taken for fluorescence measurements.
The cell pellets were resuspended in modified HBS (2 ml) to which CaCl2 (2 mM), and osthole at various concentrations were added. Fluorescence measurements were conducted using a QuantaMaster 40 spectrofluorometer (Photon Technology International) at room temperature in a quartz cuvette under constant stirring. 100 s after the recording started, it was paused and 2‐APB was added at the concentration that was determined for each individual mutant as the concentration at which the 2‐APB concentration‐dependence reached its maximum plateau level (Singh et al, 2018a). 30 s after addition of 2‐APB, the recording was continued for additional 200 s. For activation of H426A, we used camphor instead of 2‐APB because this mutant is not activated by 2‐APB even at high concentrations (Singh et al, 2018a). Intracellular Ca2+ was measured in response to different concentrations of osthole by taking the ratio of fluorescence emitted at 510 nm at the excitation wavelength 340 nm (excites Ca2+ bound Fura‐2 AM) and 380 nm (excites Ca2+ free Fura‐2 AM). The excitation wavelength was switched at 1‐s intervals. ΔF340/F380 was measured as the difference between baseline F340/F380 ratio recorded 30 s prior to the addition of osthole and the maximum F340/F380 after the addition of osthole.
Planar lipid bilayer recordings
Planar lipid bilayers measurements were performed as described previously (Cao et al, 2013). Briefly, planar lipid bilayers were formed from a solution of synthetic 1‐palmitoyl‐2‐oleoyl‐glycero‐3‐phosphocoline (POPC) and 1‐palmitoyl‐2‐oleoyl‐glycero‐3‐phosphoethanolamine (POPE; Avanti Polar Lipids) at a 3:1 ratio in n‐decane (Sigma‐Aldrich). The solution was used to paint a bilayer in an aperture of ∼250 µm diameter in a Delrin cup (Warner Instruments) between symmetric aqueous bathing solutions of KCl (150 mM), MgCl2 (0.02 mM), and HEPES (pH 7.2) (20 mM), in the presence of EGTA (4 mM). All reagents (Sigma‐Aldrich) were ultrapure (> 99%). Bilayer capacitances were in the range of 50–75 pF.
After the bilayers had formed, mTRPV3 or mTRPV3‐Y564A protein was added by painting from a micellar solution (20 ng ml−1). Unitary currents were recorded using the Axopatch 200B patch‐clamp amplifier (Molecular Devices). The trans solution (command voltage side) was connected to the CV 201A head‐stage input, while the cis solution was held at a virtual ground via a pair of matched Ag‐AgCl electrodes. Currents through the voltage‐clamped bilayers (background conductance, < 1 pS) were filtered at the amplifier output (low pass, −3 dB at 10 kHz, 8‐pole Bessel response). Data were filtered at 100 Hz through an 8‐pole Bessel filter (950 TAF; Frequency Devices) and digitized at 1 kHz with an analog‐to‐digital converter Digidata 1322A controlled by pClamp10.3 software (Molecular Devices). Single‐channel conductance events, all‐points histograms, and open probability (Po) were identified and analyzed with Clampfit10.3 software (Molecular Devices). Statistical analysis was performed using Origin 9.0 (Microcal Software Inc.). Statistical significance was calculated using one‐way ANOVA followed by Fisher’s least significant difference test. All data are presented as mean ± SEM.
Author contributions
AN and KDN made constructs, prepared protein samples, carried out cryo‐EM data collection and processing, and Fura‐2 intracellular calcium imaging. AN, KDN and AIS analyzed structural data and built molecular models. EZ performed and analyzed planar lipid bilayer recordings. AN, KDN, EZ, and AIS wrote the manuscript. AN and KDN contributed equally to this work.
Conflict of interest
The authors declare that they have no conflict of interest.
Supporting information
Expanded View Figures PDF
Table EV1
Acknowledgements
Some of this work was performed at the Columbia University Cryo‐Electron Microscopy Center. A.N. is a Walter Benjamin Fellow funded by the Deutsche Forschungsgemeinschaft (DFG, German Research Foundation)—464295817. A.I.S. was supported by the NIH (R01 CA206573, R01 NS083660, and R01 NS107253), and NSF (1818086). E.Z. was supported by the NSF grant IOS‐1922428.
EMBO reports (2021) 22: e53233.
Data availability
The datasets produced in this study (see Table EV1 for details) are available in the following databases:
Cryo‐EM density map: EMDB EMD‐24385 (https://www.ebi.ac.uk/pdbe/entry/emdb/EMD‐24385).
Cryo‐EM density map: EMDB EMD‐24386 (https://www.ebi.ac.uk/pdbe/entry/emdb/EMD‐24386).
Atomic coordinates: PDB 7RAS (https://www.rcsb.org/structure/7RAS).
Atomic coordinates: PDB 7RAU (https://www.rcsb.org/structure/7RAU).
Additional data related to this paper may be requested from the corresponding author.
References
- Adams PD, Afonine PV, Bunkóczi G, Chen VB, Davis IW, Echols N, Headd JJ, Hung LW, Kapral GJ, Grosse‐Kunstleve RW et al (2010) PHENIX: a comprehensive Python‐based system for macromolecular structure solution. Acta Crystallogr D Biol Crystallogr 66: 213–221 [DOI] [PMC free article] [PubMed] [Google Scholar]
- Afonine PV, Grosse‐Kunstleve RW, Echols N, Headd JJ, Moriarty NW, Mustyakimov M, Terwilliger TC, Urzhumtsev A, Zwart PH, Adams PD (2012) Towards automated crystallographic structure refinement with phenix.refine. Acta Crystallogr D Biol Crystallogr 68: 352–367 [DOI] [PMC free article] [PubMed] [Google Scholar]
- Aijima R, Wang B, Takao T, Mihara H, Kashio M, Ohsaki Y, Zhang J‐Q, Mizuno A, Suzuki M, Yamashita Y et al (2015) The thermosensitive TRPV3 channel contributes to rapid wound healing in oral epithelia. FASEB J 29: 182–192 [DOI] [PubMed] [Google Scholar]
- Arunlakshana O, Schild HO (1959) Some quantitative uses of drug antagonists. Br J Pharmacol Chemother 14: 48–58 [DOI] [PMC free article] [PubMed] [Google Scholar]
- Asakawa M, Yoshioka T, Matsutani T, Hikita I, Suzuki M, Oshima I, Tsukahara K, Arimura A, Horikawa T, Hirasawa T et al (2006) Association of a mutation in TRPV3 with defective hair growth in rodents. J Invest Dermatol 126: 2664–2672 [DOI] [PubMed] [Google Scholar]
- Cao C, Zakharian E, Borbiro I, Rohacs T (2013) Interplay between calmodulin and phosphatidylinositol 4,5‐bisphosphate in Ca2+‐induced inactivation of transient receptor potential vanilloid 6 channels. J Biol Chem 288: 5278–5290 [DOI] [PMC free article] [PubMed] [Google Scholar]
- Carvacho I, Lee HC, Fissore RA, Clapham DE (2013) TRPV3 channels mediate strontium‐induced mouse‐egg activation. Cell Rep 5: 1375–1386 [DOI] [PMC free article] [PubMed] [Google Scholar]
- Cheng X, Jin J, Hu L, Shen D, Dong X‐P, Samie MA, Knoff J, Eisinger B, Liu M‐L, Huang SM et al (2010) TRP channel regulates EGFR signaling in hair morphogenesis and skin barrier formation. Cell 141: 331–343 [DOI] [PMC free article] [PubMed] [Google Scholar]
- Chung MK, Lee H, Mizuno A, Suzuki M, Caterina MJ (2004) 2‐aminoethoxydiphenyl borate activates and sensitizes the heat‐gated ion channel TRPV3. J Neurosci 24: 5177–5182 [DOI] [PMC free article] [PubMed] [Google Scholar]
- Cui TT, Wang GX, Wei NN, Wang K (2018) A pivotal role for the activation of TRPV3 channel in itch sensations induced by the natural skin sensitizer carvacrol. Acta Pharmacol Sin 39: 331–335 [DOI] [PMC free article] [PubMed] [Google Scholar]
- Deng Z, Maksaev G, Rau M, Xie Z, Hu H, Fitzpatrick JAJ, Yuan P (2020) Gating of human TRPV3 in a lipid bilayer. Nat Struct Mol Biol 27: 635–644 [DOI] [PMC free article] [PubMed] [Google Scholar]
- Duchatelet S, Pruvost S, de Veer S, Fraitag S, Nitschke P, Bole‐Feysot C, Bodemer C, Hovnanian A (2014) A new TRPV3 missense mutation in a patient with Olmsted syndrome and erythromelalgia. JAMA Dermatol 150: 303–306 [DOI] [PubMed] [Google Scholar]
- Emsley P, Lohkamp B, Scott WG, Cowtan K (2010) Features and development of Coot. Acta Crystallogr D Biol Crystallogr 66: 486–501 [DOI] [PMC free article] [PubMed] [Google Scholar]
- Gao Y, Cao E, Julius D, Cheng Y (2016) TRPV1 structures in nanodiscs reveal mechanisms of ligand and lipid action. Nature 534: 347–351 [DOI] [PMC free article] [PubMed] [Google Scholar]
- Goehring A, Lee CH, Wang KH, Michel JC, Claxton DP, Baconguis I, Althoff T, Fischer S, Garcia KC, Gouaux E (2014) Screening and large‐scale expression of membrane proteins in mammalian cells for structural studies. Nat Protoc 9: 2574–2585 [DOI] [PMC free article] [PubMed] [Google Scholar]
- Hu H, Grandl J, Bandell M, Petrus M, Patapoutian A (2009) Two amino acid residues determine 2‐APB sensitivity of the ion channels TRPV3 and TRPV4. Proc Natl Acad Sci USA 106: 1626–1631 [DOI] [PMC free article] [PubMed] [Google Scholar]
- Hughes TET, Lodowski DT, Huynh KW, Yazici A, Del Rosario J, Kapoor A, Basak S, Samanta A, Han XU, Chakrapani S et al (2018) Structural basis of TRPV5 channel inhibition by econazole revealed by cryo‐EM. Nat Struct Mol Biol 25: 53–60 [DOI] [PMC free article] [PubMed] [Google Scholar]
- Imura K, Yoshioka T, Hikita I, Tsukahara K, Hirasawa T, Higashino K, Gahara Y, Arimura A, Sakata T (2007) Influence of TRPV3 mutation on hair growth cycle in mice. Biochem Biophys Res Commun 363: 479–483 [DOI] [PubMed] [Google Scholar]
- Leung YM, Kuo YH, Chao CC, Tsou YH, Chou CH, Lin CH, Wong KL (2010) Osthol is a use‐dependent blocker of voltage‐gated Na+ channels in mouse neuroblastoma N2A cells. Planta Med 76: 34–40 [DOI] [PubMed] [Google Scholar]
- Li X, Zhang Q, Fan K, Li B, Li H, Qi H, Guo J, Cao Y, Sun H (2016) Overexpression of TRPV3 correlates with tumor progression in non‐small cell lung cancer. Int J Mol Sci 17: 437 [DOI] [PMC free article] [PubMed] [Google Scholar]
- Lin Z, Chen Q, Lee M, Cao XU, Zhang J, Ma D, Chen L, Hu X, Wang H, Wang X et al (2012) Exome sequencing reveals mutations in TRPV3 as a cause of Olmsted syndrome. Am J Hum Genet 90: 558–564 [DOI] [PMC free article] [PubMed] [Google Scholar]
- Mandadi S, Sokabe T, Shibasaki K, Katanosaka K, Mizuno A, Moqrich A, Patapoutian A, Fukumi‐Tominaga T, Mizumura K, Tominaga M (2009) TRPV3 in keratinocytes transmits temperature information to sensory neurons via ATP. Pflugers Arch 458: 1093–1102 [DOI] [PMC free article] [PubMed] [Google Scholar]
- McGoldrick LL, Singh AK, Saotome K, Yelshanskaya MV, Twomey EC, Grassucci RA, Sobolevsky AI (2018) Opening of the human epithelial calcium channel TRPV6. Nature 553: 233–237 [DOI] [PMC free article] [PubMed] [Google Scholar]
- Miyamoto T, Petrus MJ, Dubin AE, Patapoutian A (2011) TRPV3 regulates nitric oxide synthase‐independent nitric oxide synthesis in the skin. Nat Commun 2: 369 [DOI] [PMC free article] [PubMed] [Google Scholar]
- Moqrich A, Hwang SW, Earley TJ, Petrus MJ, Murray AN, Spencer KS, Andahazy M, Story GM, Patapoutian A (2005) Impaired thermosensation in mice lacking TRPV3, a heat and camphor sensor in the skin. Science 307: 1468–1472 [DOI] [PubMed] [Google Scholar]
- Nadezhdin KD, Neuberger A, Trofimov YA, Krylov NA, Sinica V, Kupko N, Vlachova V, Zakharian E, Efremov RG, Sobolevsky AI (2021) Structural mechanism of heat‐induced opening of a temperature‐sensitive TRP channel. Nat Struct Mol Biol 28: 564–572 [DOI] [PMC free article] [PubMed] [Google Scholar]
- Ni C, Yan M, Zhang J, Cheng R, Liang J, Deng D, Wang Z, Li M, Yao Z (2016) A novel mutation in TRPV3 gene causes atypical familial Olmsted syndrome. Sci Rep 6: 21815 [DOI] [PMC free article] [PubMed] [Google Scholar]
- Peier AM, Reeve AJ, Andersson DA, Moqrich A, Earley TJ, Hergarden AC, Story GM, Colley S, Hogenesch JB, McIntyre P et al (2002) A heat‐sensitive TRP channel expressed in keratinocytes. Science 296: 2046–2049 [DOI] [PubMed] [Google Scholar]
- Pettersen EF, Goddard TD, Huang CC, Couch GS, Greenblatt DM, Meng EC, Ferrin TE (2004) UCSF Chimera–a visualization system for exploratory research and analysis. J Comput Chem 25: 1605–1612 [DOI] [PubMed] [Google Scholar]
- Pettersen EF, Goddard TD, Huang CC, Meng EC, Couch GS, Croll TI, Morris JH, Ferrin TE (2021) UCSF ChimeraX: Structure visualization for researchers, educators, and developers. Protein Sci 30: 70–82 [DOI] [PMC free article] [PubMed] [Google Scholar]
- Punjani A, Rubinstein JL, Fleet DJ, Brubaker MA (2017) cryoSPARC: algorithms for rapid unsupervised cryo‐EM structure determination. Nat Methods 14: 290–296 [DOI] [PubMed] [Google Scholar]
- Qu Y, Wang G, Sun X, Wang K (2019) Inhibition of the warm temperature‐activated Ca(2+)‐permeable transient receptor potential vanilloid TRPV3 channel attenuates atopic dermatitis. Mol Pharmacol 96: 393–400 [DOI] [PubMed] [Google Scholar]
- Russo CJ, Passmore LA (2014) Electron microscopy: Ultrastable gold substrates for electron cryomicroscopy. Science 346: 1377–1380 [DOI] [PMC free article] [PubMed] [Google Scholar]
- Scheres SH (2012) RELION: implementation of a Bayesian approach to cryo‐EM structure determination. J Struct Biol 180: 519–530 [DOI] [PMC free article] [PubMed] [Google Scholar]
- Shimada H, Kusakizako T, Dung Nguyen TH, Nishizawa T, Hino T, Tominaga M, Nureki O (2020) The structure of lipid nanodisc‐reconstituted TRPV3 reveals the gating mechanism. Nat Struct Mol Biol 27: 645–652 [DOI] [PubMed] [Google Scholar]
- Shokoohinia Y, Jafari F, Mohammadi Z, Bazvandi L, Hosseinzadeh L, Chow N, Bhattacharyya P, Farzaei M, Farooqi A, Nabavi S et al (2018) Potential anticancer properties of osthol: a comprehensive mechanistic review. Nutrients 10: 36 [DOI] [PMC free article] [PubMed] [Google Scholar]
- Singh AK, McGoldrick LL, Sobolevsky AI (2018a) Structure and gating mechanism of the transient receptor potential channel TRPV3. Nat Struct Mol Biol 25: 805–813 [DOI] [PMC free article] [PubMed] [Google Scholar]
- Singh AK, McGoldrick LL, Demirkhanyan L, Leslie M, Zakharian E, Sobolevsky AI (2019) Structural basis of temperature sensation by the TRP channel TRPV3. Nat Struct Mol Biol 26: 994–998 [DOI] [PMC free article] [PubMed] [Google Scholar]
- Singh AK, Saotome K, McGoldrick LL, Sobolevsky AI (2018b) Structural bases of TRP channel TRPV6 allosteric modulation by 2‐APB. Nat Commun 9: 2465 [DOI] [PMC free article] [PubMed] [Google Scholar]
- Smart OS, Neduvelil JG, Wang X, Wallace BA, Samsom MS (1996) HOLE: a program for the analysis of the pore dimensions of ion channel structural models. J Mol Graph 14: 354–360 [DOI] [PubMed] [Google Scholar]
- Smith GD, Gunthorpe MJ, Kelsell RE, Hayes PD, Reilly P, Facer P, Wright JE, Jerman JC, Walhin J‐P, Ooi L et al (2002) TRPV3 is a temperature‐sensitive vanilloid receptor‐like protein. Nature 418: 186–190 [DOI] [PubMed] [Google Scholar]
- Sulk M, Seeliger S, Aubert J, Schwab VD, Cevikbas F, Rivier M, Nowak P, Voegel JJ, Buddenkotte J, Steinhoff M (2012) Distribution and expression of non‐neuronal transient receptor potential (TRPV) ion channels in rosacea. J Invest Dermatol 132: 1253–1262 [DOI] [PMC free article] [PubMed] [Google Scholar]
- Sun XY, Sun LL, Qi H, Gao Q, Wang GX, Wei NN, Wang K (2018) Antipruritic effect of natural coumarin osthole through selective inhibition of thermosensitive TRPV3 channel in the skin. Mol Pharmacol 94: 1164–1173 [DOI] [PubMed] [Google Scholar]
- Szöllősi AG, Vasas N, Angyal Á, Kistamás K, Nánási PP, Mihály J, Béke G, Herczeg‐Lisztes E, Szegedi A, Kawada N et al (2018) Activation of TRPV3 regulates inflammatory actions of human epidermal keratinocytes. J Invest Dermatol 138: 365–374 [DOI] [PubMed] [Google Scholar]
- Ueda T, Yamada T, Ugawa S, Ishida Y, Shimada S (2009) TRPV3, a thermosensitive channel is expressed in mouse distal colon epithelium. Biochem Biophys Res Commun 383: 130–134 [DOI] [PubMed] [Google Scholar]
- Um JY, Kang SY, Kim HJ, Chung BY, Park CW, Kim HO (2020) Transient receptor potential vanilloid‐3 (TRPV3) channel induces dermal fibrosis via the TRPV3/TSLP/Smad2/3 pathways in dermal fibroblasts. J Dermatol Sci 97: 117–124 [DOI] [PubMed] [Google Scholar]
- Xu H, Ramsey IS, Kotecha SA, Moran MM, Chong JA, Lawson D, Ge P, Lilly J, Silos‐Santiago I, Xie YU et al (2002) TRPV3 is a calcium‐permeable temperature‐sensitive cation channel. Nature 418: 181–186 [DOI] [PubMed] [Google Scholar]
- Yamada T, Ueda T, Ugawa S, Ishida Y, Imayasu M, Koyama S, Shimada S (2010) Functional expression of transient receptor potential vanilloid 3 (TRPV3) in corneal epithelial cells: involvement in thermosensation and wound healing. Exp Eye Res 90: 121–129 [DOI] [PubMed] [Google Scholar]
- Yamamoto‐Kasai E, Imura K, Yasui K, Shichijou M, Oshima I, Hirasawa T, Sakata T, Yoshioka T (2012) TRPV3 as a therapeutic target for itch. J Invest Dermatol 132: 2109–2112 [DOI] [PubMed] [Google Scholar]
- Yang N‐N, Shi H, Yu G, Wang C‐M, Zhu C, Yang Y, Yuan X‐L, Tang M, Wang Z‐L, Gegen T et al (2016) Osthole inhibits histamine‐dependent itch via modulating TRPV1 activity. Sci Rep 6: 25657 [DOI] [PMC free article] [PubMed] [Google Scholar]
- Yin Y, Wu M, Zubcevic L, Borschel WF, Lander GC, Lee SY (2018) Structure of the cold‐ and menthol‐sensing ion channel TRPM8. Science 359: 237–241 [DOI] [PMC free article] [PubMed] [Google Scholar]
- You L, Feng S, An R, Wang X (2009) Osthole: a promising lead compound for drug discovery from a traditional Chinese medicine (TCM). Nat Prod Commun 4: 297–302 [PubMed] [Google Scholar]
- Zhang H, Sun X, Qi H, Ma Q, Zhou Q, Wang W, Wang K (2019) Pharmacological inhibition of the temperature‐sensitive and Ca(2+)‐permeable transient receptor potential vanilloid TRPV3 channel by natural forsythoside b attenuates pruritus and cytotoxicity of keratinocytes. J Pharmacol Exp Ther 368: 21–31 [DOI] [PubMed] [Google Scholar]
- Zhang K (2016) Gctf: Real‐time CTF determination and correction. J Struct Biol 193: 1–12 [DOI] [PMC free article] [PubMed] [Google Scholar]
- Zhang ZR, Leung WN, Cheung HY, Chan CW (2015) Osthole: a review on its bioactivities, pharmacological properties, and potential as alternative medicine. Evid Based Complement Alternat Med 2015: 919616 [DOI] [PMC free article] [PubMed] [Google Scholar]
- Zhao J, Munanairi A, Liu X‐Y, Zhang J, Hu L, Hu M, Bu D, Liu L, Xie Z, Kim BS et al (2020) PAR2 mediates itch via TRPV3 signaling in keratinocytes. J Invest Dermatol 140: 1524–1532 [DOI] [PMC free article] [PubMed] [Google Scholar]
- Zheng SQ, Palovcak E, Armache JP, Verba KA, Cheng Y, Agard DA (2017) MotionCor2: anisotropic correction of beam‐induced motion for improved cryo‐electron microscopy. Nat Methods 14: 331–332 [DOI] [PMC free article] [PubMed] [Google Scholar]
- Zubcevic L, Borschel WF, Hsu AL, Borgnia MJ, Lee SY (2019) Regulatory switch at the cytoplasmic interface controls TRPV channel gating. Elife 8: 47746 [DOI] [PMC free article] [PubMed] [Google Scholar]
- Zubcevic L, Herzik MA Jr, Chung BC, Liu Z, Lander GC, Lee SY (2016) Cryo‐electron microscopy structure of the TRPV2 ion channel. Nat Struct Mol Biol 23: 180–186 [DOI] [PMC free article] [PubMed] [Google Scholar]
- Zubcevic L, Herzik MA Jr, Wu M, Borschel WF, Hirschi M, Song AS, Lander GC, Lee SY (2018) Conformational ensemble of the human TRPV3 ion channel. Nat Commun 9: 4773 [DOI] [PMC free article] [PubMed] [Google Scholar]