

Abstract
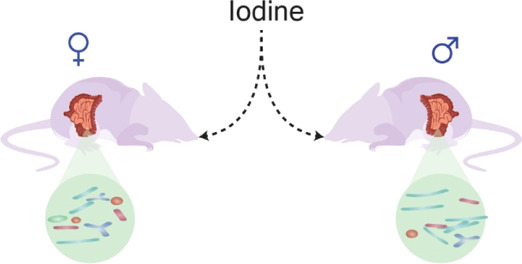
Iodine plays a key role in maintaining thyroid homeostasis, which is influenced by hormones through almost all nucleated cells and is essential for growth and metabolism. The most common kinds of thyroid dysfunction, hypothyroidism and hyperthyroidism, are markedly related to iodine intake. In addition, the prevalence and incidence of hypothyroidism and hyperthyroidism are much higher in women than in men. However, the association between thyroid homeostasis and the gut microbiota is not yet completely clear, especially when comparing women and men. In this study, differences in the gut microbiota compositions, metabolic syndromes, and molecular mechanisms of female and male mice were investigated after iodine supplementation. The gut microbiota in male mice was changed more than that of female mice. The abundances of Muribacium intestinale, Barnesiella, Alloprevotella, Enterococcus, Desulfovibrionaceae, and Clostridium were significantly increased in female mice. This finding indicates that the high risk of thyroid disease in women could be related to the gut microbiota composition.
Introduction
The thyroid hormones triiodothyronine (T3) and thyroxine (T4) are essential for the regulation of normal growth and numerous physiological processes occurring throughout the body.1 These processes include nutrient metabolism, energy metabolism, growth, body temperature control, and nervous and immune system regulation.2 Iodine is one of the key micronutrients involved in thyroid hormone synthesis (THS), comprising 65% of the weight of T4 and 58% of the weight of T3, and its sole known source is via dietary intake.3,4 There are several forms of dietary iodine. Iodate, an additive widely used for salt iodization, is reduced into iodine in the gut,5 and dietary iodine can be rapidly absorbed by the gastric mucosa and gut and carried into circulation. Then, this absorbed iodine is transported to the thyroid gland, which is regulated by specific enzymes such as the sodium iodine symporter and sodium–potassium–adenosine triphosphatase (Na+–K+–ATPase).6 Thyroid dysfunctions, hypothyroidism and hyperthyroidism, are the most common etiologies of uneven iodine distribution worldwide.5 Hypothyroidism occurs when subjects are deficient of the thyroid hormone and thus cannot keep their body running regularly. Hypothyroidism leads to an increase in thyroid-stimulating hormone (TSH) levels, which has been related to increased levels of serum cholesterol in some populations.7 Disruption of the iodine balance can lead to endemic goiters, irreversible brain damage, impaired thyroid function, and thyroid cancer, among others.6
Moreover, thyroid disease is a sex-related disease occurring in women that are biologically more prone to thyroid disorders.8 Thyroid disease is estimated to affect 2% of women and only 0.2% of men globally,1,8 and the prevalence of hypothyroidism in women (2.7%) is 11 times higher than that in men (0.23%).9 For example, subclinical hypothyroidism is an early and mild hypothyroidism in which the body produces thyroid hormones at levels lower than the normal circulating levels. This condition is more common in older individuals and is twice as likely in women than in men.10 While it is not common in younger people, the overall prevalence of the disorder by the age of 65 is approximately 17% in women and only 7% in men.11 It is well known that thyroid disease occurs more frequently in women than in men; however, the molecular basis for this sex-based difference is still not clear.12 Further studies are necessary to explain the differences in the incidence rates of thyroid disease in males and females, which is the focus of our study.
Gut microbiota are microorganisms that colonize the digestive tracts of humans and include not only bacteria but also other microbiota, such as fungi, archaea, viruses, and protozoa.13 Because it has a variety of functions, the gut microbiota is considered an organ, and the microbiota and human cells work symbiotically in the body.14 Species of the gut microbiota influence the metabolic functions of each other, nutrient absorption, the immune system, and other physiological functions, and have played a significant role in the development of humans.15 Healthy gut microbiota mostly consist of the phyla Firmicutes and Bacteroidetes,16 and microbiota balance is very important for humans. Gut microbial dysbiosis causes a variety of chronic17 and metabolic diseases,18 and numerous factors, such as the region, age, dietary habits, sex, and lifestyle, influence the composition of the gut microbiota.19,20 Several studies have revealed that thyroid-related diseases are associated with the abundance and composition of gut microbiota.21−23 The gut microbiota regulates homeostasis and immune system development, while the immune system itself influences the composition of the gut microbiota.24 Studies have found dysbiosis of the microbial composition in euthyroid and hypothyroid patients.25,26 The gut microbiota also influences neurotransmitters, which can inhibit TSH.27
Thus, this study aimed to elucidate the mechanism underlying sex differentiation in subjects with thyroid-related diseases. The blood biochemical indices and shifts in the gut microbiota structure were investigated in mice treated with different iodine supplements. The transcription of iodine metabolism-related genes was monitored using real-time fluorescence quantitative polymerase chain reaction (qRT-PCR). This study may provide a new perspective for understanding sex differentiation in subjects with thyroid-related diseases and novel insights into iodine metabolism. Moreover, the results of this study provide new approaches to iodine mechanistic research.
Results
Effects of Iodine Treatment on Physiological Indicators and Organ Indices
After 10 weeks of feeding, the mouse weights were decreased (P < 0.001) significantly in the NI group compared with the chow group, and the weights of the male mice were higher (P < 0.05 in the chow feed group and P > 0.05 in the NI feed group) than those of the female mice (Figure 1A). The thyroid index of the mice was increased in the NI group compared with the chow group (P < 0.05 in female mice and P > 0.05 in male mice), and the indices of the male mice were higher (P < 0.01 in the chow feed group and P > 0.05 in the NI feed group) than those of the female mice (Figure 1B).
Figure 1.

Effects of iodine treatment on body weight (A) and thyroid indices (B). The differences were assessed by unpaired two-tailed Student’s t-tests (*p < 0.05, **p < 0.01, and ***P < 0.001). Chow: mice that received saline via gavage; NI: mice that received sodium iodine.
Effects of Iodine Treatment on Urinary and Fecal Iodine Levels
The urinary and fecal iodine concentrations increased in a time-dependent manner, and the values for the male mice were higher than those for the female mice in the NI group; the same trend was observed in the chow group. In the NI group, the urinary iodine (331.9 μg/L) and fecal iodine (118.6 μg/L) concentrations in the male mice were increased by 10.39 and 22.63%, respectively, compared with those of the female mice after 9 weeks of feeding (Figure 2A–B).
Figure 2.

Effects of iodine treatment on urinary iodine (A) and fecal iodine (B). The differences were assessed by unpaired two-tailed Student’s t-tests (*p < 0.05, **p < 0.01, and ***P < 0.001). Chow: mice that received saline via gavage; NI: mice that received sodium iodine.
Effects of Iodine Treatment on the Metabolism of Thyroid-Related Hormones in Mouse Blood
In brief, the simplified THS pathway (Figure 3A) shows that the pituitary gland releases TSH, which stimulates the thyroid gland to sequentially produce the primary thyroid hormones TT4 and TT3.28 THS involves two main enzymes, sodium iodide symporter (NIS) and thyroid peroxidase (TPO). NIS, a transmembrane glycoprotein, regulates active iodide ion transport into thyroid follicular cells, which is the initial step in thyroid hormone biosynthesis.29 TPO is also an important enzyme for thyroid hormone biosynthesis, as it plays a role in organification, iodination, and iodotyrosine coupling.30 TT3/TT4 are considered two parts of combined T3/T4 and free T3/T4. In fact, FT3 is used by organisms, and T4 can be transformed into the bioactive T3 enzyme via deiodinase.
Figure 3.

Simplified schematic of the thyroid hormone synthesis pathway (A). Effects of iodine treatment on TT3 (B), TT4 (C), FT3 (D), FT4 (E), and TSH (F). The differences were assessed by unpaired two-tailed Student’s t-tests (*p < 0.05, **p < 0.01, and ***P < 0.001). Chow: mice that received saline via gavage; NI: mice that received sodium iodine.
The proportion of TT3 in mouse blood (Figure 3B) was decreased in the NI group compared with the chow group. In both the NI and chow groups, the TT3 values were higher in male mice than in female mice. All concentrations of TT4 (Figure 3C), FT3 (Figure 3D), and FT4 (Figure 3E) were decreased in the female mice and increased in the male mice in the NI group compared with the chow group. In the chow group, the concentrations of TT4, FT3, and FT4 were higher in the sera of the female mice than in the sera of the male mice. In the NI group, these were lower in the sera of the female mice than in the sera of the male mice. The proportions of TSH (Figure 3F) in both females and males of the NI group were significantly increased compared with those in the males and females of the chow group. In the chow group, the concentrations of TSH in male mouse sera were higher than those in the sera of female mice. However, the opposite trend was observed, as the TSH concentrations were lower in the sera of male mice than in the sera of female mice.
Effects of Iodine Treatment on Serum Lipids
The serum lipid indices, total cholesterol (TC) (Figure 4A), high-density lipoprotein (HDL-C) (Figure 4B), triglycerides (TG) (Figure 4C), and low-density lipoprotein (LDL) (Figure 4D), were increased in the NI group compared with the chow group. Specifically, the TC values in females and the LDL values in both females and males were significantly higher in the NI group than in the chow group. In the NI group, all four indices of serum lipids were higher in female mice than in male mice. In the chow group, the TC and HDL-C values were higher in the sera of male mice than in the sera of female mice, but TG and LDL showed the opposite trend.
Figure 4.

Effects of iodine treatment on the serum levels of TC (A), HDL-C (B), TG (C), and LDL (D). The differences were evaluated by unpaired two-tailed Student’s t-tests (*p < 0.05, **p < 0.01, and ***P < 0.001). Chow: mice that received saline via gavage; NI: mice that received sodium iodine.
Effects of Iodine Treatment on Relative mRNA Gene Transcript Levels
Compared with those in the chow group, the relative gene transcript levels of TPO (P > 0.05 in female mice and P < 0.05 in male mice) (Figure 5A), NIS (P > 0.05) (Figure 5B), D1 (Figure 5C) (P > 0.05 in male mice and P < 0.05 in female mice), and TSH (Figure 5D) (P < 0.05) were increased in the NI group, and the TPO and NIS levels in male mice were higher than those in female mice; however, D1 and TSH showed the opposite trend.
Figure 5.

Effects of iodine treatment on the mRNA transcript levels of TPO (A), NIS (B), D1 (C), and TSH (D). The differences were assessed by unpaired two-tailed Student’s t-tests (*p < 0.05, **p < 0.01, and ***P < 0.001). Chow: mice that received saline via gavage; NI: mice that received sodium iodine.
Effects of Iodine Treatment on the Fecal Microbiota Structure
The Shannon (Figure 6A) and Chao1 (Figure 6B) indices were applied to assess the diversity and abundance of the microbial communities in each group. The Shannon and Chao1 diversity indices of the female and male mice were significantly increased in the NI group compared with the chow group, and were higher in male mice than in female mice (P < 0.05) in all the groups.
Figure 6.

Shannon diversity (A) and Chao1 diversity (B) representing the diversity of the bacteria in all four groups. The microbiota structure of feces under iodine treatment; the plots were generated through a weighted version of UniFrac-based PCoA (C). The data are presented as the means ± SEMs. Bacterial taxonomic profiling at the phylum and family levels in different groups. (D) RDP classification of the sequences at the phylum level in different groups. (E) RDP classification of the sequences at the family level in different groups. Chow: mice that received saline via gavage; NI: mice that received sodium iodine.
Principal coordinate analysis (PCoA) was applied to assess the overall gut microbiota in mice from each of the four groups (Figure 6C). The PCoA matrix scores, determined by multivariate analysis of variance, depicted a statistically significant separation (P < 0.05) between the microbiota of the female and male mice. Iodine supplementation (NI group) caused the overall gut microbiota composition to markedly separate from that of the chow group. The gut microbiota compositions were the most substantially different in the NI and chow groups of male mice. The structures of the gut microbiota in the NI group of female mice were relatively more similar to those in the chow group of female mice.
The Ribosomal Database Project (RDP) classifier was applied to evaluate the variation in the structure of gut microbiota in mice receiving iodine supplements. The dominant bacterial phyla included Firmicutes, Bacteroidetes, Candidatus, and Proteobacteria in all samples (Figure 6D and Table S2). Firmicutes and Bacteroidetes were the major phyla in all samples. The community structure of the gut microbiota was obviously changed at the phylum level after 10 weeks of feeding. Compared with that in the chow group, the richness of Firmicutes (P > 0.05) and Proteobacteria (P > 0.05) was increased in the NI group, while the richness of Bacteroidetes (P < 0.05) and Candidatus (P > 0.05) was decreased. The ratios of Firmicutes and Candidatus were reduced, and the ratios of Bacteroidetes and Proteobacteria were increased in male mice compared with female mice.
The major families included (Figure 6E) Porphyromonadaceae, Lactobacillaceae, Lachnospiraceae, Clostridiales, Desulfovibrionaceae, Ruminococcaceae, and Prevotellaceae. Compared with those in the chow group, the abundances of Porphyromonadaceae (P < 0.05), Lactobacillaceae (P > 0.05), and Lachnospiraceae (P < 0.05) were decreased in the NI group, while those of Clostridiales (P < 0.05), Desulfovibrionaceae (P < 0.05), and Ruminococcaceae (P < 0.05) were increased. The ratio of Desulfovibrionaceae to Lachnospiraceae was reduced, and the Porphyromonadaceae, Candidatus, Clostridiales, Lactobacillaceae, Ruminococcaceae, and Prevotellaceae ratios were increased in the feces of male mice compared with female mice.
OTU Analysis of Intergroup Differences in Mouse Feces
We used Statistical Analysis of Metagenomic Profiles (STAMP) software to evaluate operational taxonomic units (OTUs) that were related to significant changes in richness between groups. Our results showed significant changes in a total of 68 distinct OTUs (Figure 7A). The gut microbiota of the male mice changed more than that of the female mice. The abundances of Muribacium intestinale, Barnesiella, Alloprevotella, Enterococcus, Desulfovibrionaceae, and Clostridium were significantly increased in the feces of female mice. The abundances of Leadbetterella, Parabacteroides, Alloprevotella, Faecalibacterium prausnitzii, Lactobacillus, Bifidobacterium, and Oscillospira were significantly increased in the feces of male mice.
Figure 7.

Heat map showing the abundances of 68 OTUs that were significantly changed in iodine-treated mice according to STAMP software. (A) Bacterial taxa information (species and phylum) for the 68 OTUs. (B) Correlations between the biochemical indicators and the OTUs. The intensity of the color indicates the degree of correlation between the OTU abundance and the biochemical indicator as evaluated by Spearman’s correlation. Significant correlations are indicated with an asterisk (*) in the squares. The OTU taxonomy is listed on the right (C). Chow: mice that received saline via gavage; NI: mice that received sodium iodine.
The 68 OTUs and specific plasma biochemical indicators were subjected to Spearman’s correlation analysis (Figure 7B). Thirty-four OTUs had a significant correlation with at least one plasma biochemical indicator. Twenty-five OTUs were positively related to thyroid disease phenotypes, while 11 OTUs were negatively related to thyroid disease phenotypes. We found that Muribaculum intestinale (P < 0.01), Leadbetterella (P < 0.05), Parabacteroides (P < 0.01), Enterococcus (P < 0.01), Desulfovibrionaceae (P < 0.01), Lactococcus (P < 0.05), Enbacterium (P < 0.05), and Oxobacter (P < 0.05) were positively associated with metabolic indices, while the other bacteria [Barnesiella (P < 0.05), F. prausnitzii (P < 0.05), Prevotella (P < 0.05), Lactobacillus (P < 0.05), Bifidobacterium (P < 0.05), Parabacteroides (P < 0.05), and Mitsnokella (P < 0.05)] were negatively correlated with the expression of related biomarkers. Twenty-six OTUs were associated with FT4, the most highly correlated biochemical index.
Discussion
Thyroid function is regulated by the hypothalamus-pituitary-thyroid axis,31 and the abnormal secretion of thyroid hormones causes a range of pathological and physiological changes. We found that in the female mice, the serum concentration of TSH was increased and those of TT3, TT4, FT3, and FT4 were decreased compared with the levels in male mice. Serum TSH can be a useful indicator of thyroid dysfunction,32 and abnormal secretion can cause thyroid dysfunction.
Our results showed that the serum TC levels in female mice were significantly higher than those in the males. The magnitude of the increase in the serum cholesterol concentration is related to the degree of hypothyroidism.33 Hypercholesterolemia in subjects with hypothyroidism probably leads to the reduced catabolism of lipoproteins.31 Hypothyroid patients always have high levels of HDL, primarily due to low activity of the cholesterol ester transfer protein. This results in the decreased transfer of cholesteryl esters from HDL to very LDL, thus leading to increased HDL cholesterol levels.31 In this study, the LDL and HDL levels were elevated in female mice compared to males, which was consistent with the findings of a previous study.10 The serum TG levels were also higher in female mice than in males, which was similar to the results of a previous study.31 These changes resulted in the altered activity of lipoprotein lipase (LPL), which led to the quick clearance of triglyceride-rich lipoproteins.31 All these abnormalities were resolved when the serum T4 concentration remained normal,31 indicating that hypothyroidism was correlated with an abnormal lipid profile, especially with respect to TC and TG levels. However, women are more likely to have hyperlipidemia than men, which may explain why women develop thyroid disease more easily.
In addition to the serum index changes in the thyroid gland, we observed significant alterations in thyroid gene transcription in mice. Our data showed that the pituitary expression of TSH mRNA was increased in female mice, which was consistent with the increased TSH level in the serum. Our study also showed that the transcription levels of TPO and NIS were decreased in female mice. It is well known that TSH upregulates NIS synthesis and activity, which is a limiting process of THS.34 The low TSH signaling could explain the decreased transcription of NIS. Type I iodothyronine deiodinase (D1) was shown to participate in the thyroidal and peripheral conversion of T4 to T3.35 In this study, the transcription level of D1 mRNA was increased in female mice. Thus, the increased transcription of D1 mRNA could have been fedback to the decreased serum TT3 levels because D1 is regulated by T3.36
In the past decade, many studies have assessed the impact of the microbiota on different disease states. The microbiota is correlated with diseases via multiple mechanisms, including abnormalities in gut microbiota diversity and the targeting of immunological dysregulation.37
Interestingly, iodine treatment enhanced a variety of bacterial species in female mice, including Desulfovibrionaceae, Enterococcus, and Clostridium, while the abundances of these bacteria were decreased in the males. Species of the Desulfovibrio genus can promote the decay of sulfur compounds in the digestive tract into hydrogen sulfide (H2S), which could harm the intestinal barrier, further causing a variety of diseases.38 Endogenous H2S poisons digestive tract epithelial cells, impedes butyric acid oxidation, and subsequently leads to chronic and apoptotic inflammation.39 In our study, the abundance of Desulfovibrionaceae was increased significantly in female mice, which was potentially due to iodine intervention altering the colonic pH and the oxidation/reduction potential, thereby causing the digest tract to be suitable for Desulfovibrionaceae. Enterococcus is a Gram-positive, facultative anaerobic genus in the Firmicutes phylum that has a high level of intrinsic antibiotic resistance.40 The increased abundance of Enterococcus in females might be a risk factor for infections, as the presence of these bacteria in females makes them more susceptible to diseases.
The results revealed that the abundances of F. prausnitzii, Parabacteroides, Lactobacillus, and Bifidobacterium were increased markedly in male mice. This correlation may be a potential regulatory effect of this species, as a previous study demonstrated that the production of proinflammatory cytokines induced by the addition of F. prausnitzii to cultures of human peripheral blood mononuclear cells was less extensive than that induced by other bacterial strains.41F. prausnitzii reportedly has anti-inflammatory properties and contributes to gut health through the short-chain fatty acid (SCFA) butyrate.42 SCFAs can elevate intercellular junctions together with thyroid hormones.43 Butyrate may have a direct anti-inflammatory effect,44 and it can increase both the pool of colonic regulatory T cells and FoxP3 production in this population.45 Thus, the low prevalence and incidence rates of hypo- and hyperthyroidism in males may be due to high concentrations of SCFAs in the gut. Parabacteroides may reduce gut inflammation by influencing the anti-inflammatory cytokine IL-10 and inhibiting the secretion of inflammatory cytokines such as IL-17, IL-6, and IFN-γ.46 The positive immune system influence and the inflammatory regulation of an impaired microbiota may relieve autoimmune diseases such as autoimmune thyroid diseases.43Lactobacilli and Bifidobacteria are considered typical probiotic microorganisms that are advantageous for human health and can regulate the immune system47 and improve intestinal functions.48 The abundances of Lactobacillus and Bifidobacterium are usually reduced in subjects with hypothyroidism and hyperthyroidism, indicating that males have a lower risk of thyroid disease than females.24 The increased abundances of F. prausnitzii, Bifidobacterium, and Lactobacillus might enhance immune system function, causing the host to be less susceptible to disease. In addition, male mice exhibited increased abundances of some hydrogen-producing bacteria, such as Prevotella. Hydrogen can selectively remove cytotoxic reactive oxygen species and protect cells far away from oxidative stress injuries.49Prevotella can produce anti-inflammatory metabolites, which subsequently induce Th17 polarization and stimulate the differentiation of anti-inflammatory cells in the digestive tract.46
In summary, this study supports previous opinions that the more frequent occurrence of thyroid disease in women than in men is related to gut microbiota.1,12 In the future, several in-depth studies should be conducted to confirm the role and mechanism of gut microbiota in regulating thyroid homeostasis.
Materials and Methods
Animal Experimental Design
Female and male ICR mice were purchased from the Institutional Animal Care and Use Committee (IACUC, Hangzhou, China) and handled according to Guidelines for the Regulation of Animals provided by the IACUC of Ningbo University. The animals were housed at 24 ± 2 °C and a relative humidity of 60 ± 5% on a 12 h light/dark cycle and had free access to water and regular feed (obtained from the Laboratory Animal Center of Ningbo University). The mice were randomly distributed into the following four groups (six animals each): (1) the chow female group (♀), which received saline via gavage once a day; (2) the chow male group (♂), which received saline via gavage once a day; and (3) the sodium iodine (NI) female group (♀), which received 18 μg/kg/d NaIO3 (Sinopharm Chemical Reagent, Shanghai, China) via gavage once a day; and (4) the NI male group (♂), which received 18 μg/kg/d NaIO3 via gavage once a day. The iodine intake of the mice was in accordance with that recommended by the World Health Organization.50
The mouse body weights were recorded once a week, and urinary and fecal samples were collected every three weeks to determine the iodine concentrations. After 10 weeks of the experiment, the feces were sampled to characterize the gut microbiota, and all the animals were sacrificed after 12 h of food deprivation. The animals were anesthetized with tribromoethanol (i.p. injection, 250 mg/kg body weight),51 and blood samples were obtained through the ophthalmic venous plexus and stored at −80 °C. Major tissues, including the thyroid, heart, liver, spleen, lung, and kidney, were weighed and stored at −80 °C until used for analysis.
Blood Biochemistry and Hormone Concentration Measurements
TSH, total triiodothyronine (TT3), total thyroxine (TT4), free triiodothyronine (FT3), and free thyroxine (FT4) were quantified with ELISA kits (Yuanye Biotechnology, Shanghai, China) according to the manufacturers’ protocols. The serum levels of TC, TG, LDL, and HDL-C were quantified using commercial detection kits (Jiancheng Bioengineering Institute, Nanjing, China).52
Urinary Iodine and Fecal Iodine Measurements
The concentrations of iodine in urine and feces were determined by catalytic spectrophotometry according to a previously reported method.53 Specifically, the samples were digested with ammonium persulfate at 100 °C, and the residual Ce4+ concentration was determined at an optical density of 400 nm. Finally, the optical density values were plotted to show their linear logarithmic relationships to the iodine concentrations.
Ribonucleic Acid (RNA) Isolation, Reverse Transcription, and qRT-PCR
Total RNA was extracted with an RNA kit (Transgen Biotech, Beijing, China) according to the standard protocol and quantified by a NanoDrop (2000C, Thermo Fisher Scientific, Waltham, USA); the RNA integrity was evaluated by gel electrophoresis. Reverse transcription was performed with a reverse transcription kit (Transgen Biotech, Beijing, China) in an all-in-one real-time PCR biosystem as follows: 15 min at 42 °C, followed by incubation at 85 °C to stop the enzymatic activity. qRT-PCR was conducted in triplicate with SYBR Green I. The relative expression of each gene was calculated based on the expression in the chow mouse group using the 2–ΔΔCt method.54 β-actin served as the reference gene. The sequences of the primers, obtained from Shanghai Sangon Biotech (Shanghai, China), are listed in Table S1.
Gut Microbiota Analysis
The fecal samples were snap-frozen in liquid nitrogen and then stored at −80 °C. Deoxyribonucleic acid (DNA) was extracted from all the samples with a DNA Kit (Omega, Norcross, USA). The forward and reverse primers were designed to amplify the V3–V4 region of the 16S rRNA gene for fecal samples. The 50 μL PCR solution for each sample contained 50 ng of the DNA template, 12.5 μL of master mix (Phusion Hot Start Flex), 2.5 μL of the target primer, and 25 μL of ddH2O. The PCR conditions were as follows: 98 °C for 3 min; 35 cycles of 98 °C for 10 s; 54 °C for 30 s; 72 °C for 45 s; and a final extension of 72 °C for 10 min. The PCR-amplified products were evaluated by electrophoresis and purified with a PCR Cleanup Kit (Axygen, Hangzhou, China). The PCR products were cleaned with purification beads (AMPure XT, Beckman Coulter Genomics, Danvers, USA) and quantified by Qubit (Invitrogen, Norcross, USA). The amplicon pools were prepared for sequencing, and the size and quantity of the amplicon DNA library were evaluated using a bioanalyzer (Agilent 2100, Palo Alto, USA) and a library quantification kit for Illumina (Kapa Biosciences, Woburn, USA), respectively.22
The DNA samples were sequenced on an Illumina MiSeq platform according to the manufacturer’s protocol provided by LC-Bio (Hangzhou, China). Paired-end reads were assigned to the specific samples based on the unique barcodes marked. The reads were truncated by cutting off the barcodes and primer sequences and subsequently merged by FLASH. The raw tags were filtered by FastQC (V 0.10.1) to obtain high-quality tags, and the chimeric sequences were filtered by Verseach software (v2.3.4). Sequences were considered to have the same OTUs when they were more than 97% similar as determined by Verseach (v2.3.4). Representative sequences were classified for each OTU, and the taxonomic data were then assigned to each representative sequence by the RDP classifier. To assess differences in the major species among the different groups, multiple sequence alignment was performed by PyNAST to assess the phylogenetic relationships between the different OTUs. A standard sequence of numbers was applied to normalize the OTU counts matching the sample to the fewest sequences. To assess the species diversity in a sample, alpha diversity was assessed based on four indices, the Simpson, Chao1, Observed Species, and Shannon indices, which were analyzed by QIIME.55 Beta diversity analysis was performed to assess the species diversity among the different samples, and beta diversity was calculated by PCoA and cluster analysis through QIIME.55 Intergroup analysis of gut microbial diversity was conducted using the STAMP program.
Statistical Analysis
Correlations between the gut microbiota structure and thyroid-related hormone phenotypes were analyzed via Spearman’s correlation. The data of six replicate experimental samples were analyzed by an unpaired two-tailed Student’s t-test and the Mann–Whitney test. Differences were considered statistically significant at P < 0.05.
Ethics Statement
Ethical Approval and Consent to Participate
All experimental and animal care procedures were conducted in accordance with the guidelines of standard animal care established by the Ningbo University Experimental Animal Center. All animal protocols were approved by the IACUC of Ningbo University (no. SCXK, ZHE 2014-0001).
Acknowledgments
This study was sponsored by the Regional Demonstration Project of Marine Economic Innovation and Development in 2014 and 2016 and by the K.C.W. Magna Fund of Ningbo University. The authors wish to thank the manager of the Ningbo University Experimental Animal Center for organizing and assisting with the animal care. The authors acknowledge ACS ChemWorx for the English language editing.
Supporting Information Available
The Supporting Information is available free of charge at https://pubs.acs.org/doi/10.1021/acsomega.1c02697.
Target gene primer sequence; RDP classification of the sequences from the four groups at the phylum; RDP classification of the sequences from the four groups at the family level; taxonomic assignments of 68 OTUs responding to iodine treatment identified by redundancy analysis; and correlation between the biochemical indicators and the 68 OTUs by redundancy analysis (STAMP) (PDF)
Author Contributions
H.S. and J.X. contributed equally to this work. X.S. and J.X. contributed in conceptualization; C.L,J.H, J.Z., and Y.L. contributed in methodology; H.S and T.M. supported in investigation; H.T and T.M. contributed in data curation; H.S., J.X., and X.S. contributed in writing––original draft; J.X. and X.S. contributed in writing––review and editing; H.S. contributed in visualization; X.S supported in supervision; X.S. contributed in project administration; and X.S. contributed in funding acquisition.
The authors declare no competing financial interest.
Notes
The original data presented in the study are publicly available and can be found at https://www.ncbi.nlm.nih.gov/bioproject/675215 with the assigned identifier PRJNA675215.
Supplementary Material
References
- Taylor P. N.; Albrecht D.; Scholz A.; Gutierrez-Buey G.; Lazarus J. H.; Dayan C. M.; Okosieme O. E. Global epidemiology of hyperthyroidism and hypothyroidism. Nat. Rev. Endocrinol. 2018, 14, 301. 10.1038/nrendo.2018.18. [DOI] [PubMed] [Google Scholar]
- Wolmarans D. W. Maintaining Euthyroidism: Fundamentals of Thyroid Hormone Physiology, Iodine Metabolism and Hypothyroidism. S. Afr. Fam. Pract. 2017, 59, 18–27. 10.4102/safp.v59i4.4723. [DOI] [Google Scholar]
- Milanesi A.; Brent G. A. Chapter 12—Iodine and Thyroid Hormone Synthesis, Metabolism, and Action. Mol., Genet., Nutr. Aspects Major Trace Miner. 2017, 12, 143–150. 10.1016/b978-0-12-802168-2.00012-9. [DOI] [Google Scholar]
- Rousset B.; Dupuy C.; Miot F.; Dumont F.. Thyroid hormone synthesis and secretion. [Updated 2015 Sep 2]; Endotext [Internet]: South Dartmouth (MA), 2000; Chapter 2. [Google Scholar]
- Zimmermann M. B. Iodine deficiency. Endocr. Rev. 2009, 30, 376–408. 10.1210/er.2009-0011. [DOI] [PubMed] [Google Scholar]
- Zbigniew S. Role Of Iodine In Metabolism. Recent Pat. Endocr. Metab. Immune Drug Discov. 2016, 10, 123. 10.2174/1872214811666170119110618. [DOI] [PubMed] [Google Scholar]
- Mondal S. I.; Das S. A.; Akter A.; Hasan R.; Talukdar S. A.; Reza M. S. Thyroid Hormone And Its Correlation With Age, Sex And Serum Lipid Levels In Hypothyroid And Euthyroid Sylheti Populations In Bangladesh. J. Clin. Diagn. Res. 2011, 5, 1347–1351. [Google Scholar]
- Merrill S. J.; Mu Y. Thyroid autoimmunity as a window to autoimmunity: An explanation for sex differences in the prevalence of thyroid autoimmunity. J. Theor. Biol. 2015, 375, 95–100. 10.1016/j.jtbi.2014.12.015. [DOI] [PubMed] [Google Scholar]
- Tunbridge W. M. G.; Evered D. C.; Hall R.; Appleton D.; Brewis M.; Clark F.; Evans J. G.; Young E.; Bird T.; Smith P. A. The spectrum of thyroid disease in a community: the Whickham survey. Clin. Endocrinol. 1977, 7, 481–493. 10.1111/j.1365-2265.1977.tb01340.x. [DOI] [PubMed] [Google Scholar]
- Hueston W. J.; Pearson W. S. Subclinical hypothyroidism and the risk of hypercholesterolemia. Ann. Fam. Med. 2004, 2, 351–355. 10.1370/afm.79. [DOI] [PMC free article] [PubMed] [Google Scholar]
- Danese M. D.; Ladenson P. W.; Meinert C. L.; Powe N. R. Effect of thyroxine therapy on serum lipoproteins in patients with mild thyroid failure: A quantitative review of the literature. J. Clin. Endocrinol. Metab. 2000, 85, 2993–3001. 10.1210/jcem.85.9.6841. [DOI] [PubMed] [Google Scholar]
- Antico-Arciuch V. G.; Dima M.; Liao X.-H.; Refetoff S.; Di Cristofano A. Cross-talk between PI3K and estrogen in the mouse thyroid predisposes to the development of follicular carcinomas with a higher incidence in females. Oncogene 2010, 29, 5678–5686. 10.1038/onc.2010.308. [DOI] [PMC free article] [PubMed] [Google Scholar]
- Jiang Q.; Lu C.; Sun T.; Zhou J.; Li Y.; Ming T.; Bai L.; Wang Z. J.; Su X. Alterations of the Brain Proteome and Gut Microbiota in d-Galactose-Induced Brain-Aging Mice with Krill Oil Supplementation. J. Agric. Food Chem. 2019, 67, 9820–9830. 10.1021/acs.jafc.9b03827. [DOI] [PubMed] [Google Scholar]
- Lederberg J. Infectious history. Science 2000, 288, 287–293. 10.1126/science.288.5464.287. [DOI] [PubMed] [Google Scholar]
- Martin F. P. J.; Dumas M. E.; Wang Y.; Legido-Quigley C.; Yap I. K. S.; Tang H.; Zirah S.; Murphy G. M.; Cloarec O.; Lindon J. C.; Sprenger N.; Fay L. B.; Kochhar S.; van Bladeren P.; Holmes E.; Nicholson J. K. A top-down systems biology view of microbiome-mammalian metabolic interactions in a mouse model. Mol. Syst. Biol. 2007, 3, 112. 10.1038/msb4100153. [DOI] [PMC free article] [PubMed] [Google Scholar]
- Ramakrishna; Balakrishnan S. The Normal Bacterial Flora of the Human Intestine and Its Regulation. J. Clin. Gastroenterol. 2007, 41, S2–S6. 10.1097/mcg.0b013e31802fba68. [DOI] [Google Scholar]
- Murphy E. A.; Velazquez K. T.; Herbert K. M. Influence of high-fat diet on gut microbiota: a driving force for chronic disease risk. Curr. Opin. Clin. Nutr. Metab. Care 2015, 18, 515. 10.1097/mco.0000000000000209. [DOI] [PMC free article] [PubMed] [Google Scholar]
- Cani P. D.; Delzenne N. M. The role of the gut microbiota in energy metabolism and metabolic disease. Curr. Pharm. Des. 2009, 15, 1546. 10.2174/138161209788168164. [DOI] [PubMed] [Google Scholar]
- Sommer F.; Bäckhed F. The gut microbiota--masters of host development and physiology. Nat. Rev. Microbiol. 2013, 11, 227–238. 10.1038/nrmicro2974. [DOI] [PubMed] [Google Scholar]
- Yatsunenko T.; Rey F. E.; Manary M. J.; Trehan I.; Dominguez-Bello M. G.; Contreras M.; Magris M.; Hidalgo G.; Baldassano R. N.; Anokhin A. P.; Heath A. C.; Warner B.; Reeder J.; Kuczynski J.; Caporaso J. G.; Lozupone C. A.; Lauber C.; Clemente J. C.; Knights D.; Knight R.; Gordon J. I. Human gut microbiome viewed across age and geography. Nature 2012, 486, 222–227. 10.1038/nature11053. [DOI] [PMC free article] [PubMed] [Google Scholar]
- Virili C.; Centanni M. With a little help from my friends″ - The role of microbiota in thyroid hormone metabolism and enterohepatic recycling. Mol. Cell. Endocrinol. 2017, 458, 39. 10.1016/j.mce.2017.01.053. [DOI] [PubMed] [Google Scholar]
- Shen H.; Han J.; Li Y.; Lu C.; Zhou J.; Li Y.; Su X. Different host-specific responses in thyroid function and gut microbiota modulation between diet-induced obese and normal mice given the same dose of iodine. Appl. Microbiol. Biotechnol. 2019, 103, 3537–3547. 10.1007/s00253-019-09687-1. [DOI] [PubMed] [Google Scholar]
- Virili C.; Centanni M. Does microbiota composition affect thyroid homeostasis?. Endocrine 2015, 49, 583–587. 10.1007/s12020-014-0509-2. [DOI] [PubMed] [Google Scholar]
- Knezevic J.; Starchl C.; Tmava Berisha A.; Amrein K. Thyroid-Gut-Axis: how does the microbiota influence thyroid function?. Nutrients 2020, 12, 1769. 10.3390/nu12061769. [DOI] [PMC free article] [PubMed] [Google Scholar]
- Zhao F.; Feng J.; Li J.; Zhao L.; Liu Y.; Chen H.; Jin Y.; Zhu B.; Wei Y. Alterations of the gut microbiota in Hashimoto’s thyroiditis patients. Thyroid 2018, 28, 175–186. 10.1089/thy.2017.0395. [DOI] [PubMed] [Google Scholar]
- Ishaq H. M.; Mohammad I. S.; Guo H.; Shahzad M.; Hou Y. J.; Ma C.; Naseem Z.; Wu X.; Shi P.; Xu J. Molecular estimation of alteration in intestinal microbial composition in Hashimoto’s thyroiditis patients. Biomed. Pharmacother. 2017, 95, 865–874. 10.1016/j.biopha.2017.08.101. [DOI] [PubMed] [Google Scholar]
- Wostmann B. S.Germfree and gnotobiotic animal models: background and applications; CRC Press, 2020. [Google Scholar]
- Duntas L. H. Thyroid disease and lipids. Thyroid 2002, 12, 287–293. 10.1089/10507250252949405. [DOI] [PubMed] [Google Scholar]
- Dohán O.; De l. V. A.; Paroder V.; Riedel C.; Artani M.; Reed M.; Ginter C. S.; Carrasco N. The sodium/iodide Symporter (NIS): characterization, regulation, and medical significance. Endocr. Rev. 2003, 24, 48–77. 10.1210/er.2001-0029. [DOI] [PubMed] [Google Scholar]
- Hannoush Z. C.; Weiss R. E. Defects of Thyroid Hormone Synthesis and Action. Endocrinol Metab. Clin. N. Am. 2017, 46, 375–388. 10.1016/j.ecl.2017.01.005. [DOI] [PMC free article] [PubMed] [Google Scholar]
- Li W.; Changsheng C.; Jiangfang F.; Bin G.; Nanyan Z.; Xiaomiao L.; Deqiang L.; Ying X.; Wensong Z.; Qiuhe J. Effects of sex steroid hormones, thyroid hormone levels, and insulin regulation on thyrotoxic periodic paralysis in Chinese men. Endocrine 2010, 38, 386. 10.1007/s12020-010-9396-3. [DOI] [PMC free article] [PubMed] [Google Scholar]
- Ladenson P. W.; Singer P. A.; Ain K. B.; Bagchi N.; Bigos S. T.; Levy E. G.; Smith S. A.; Daniels G. H. American Thyroid Association Guidelines for Detection of Thyroid Dysfunction. Arch. Intern. Med. 2000, 160, 1573. 10.1001/archinte.160.11.1573. [DOI] [PubMed] [Google Scholar]
- Dichek H. L.; Agrawal N.; Andaloussi N. E.; Qian K. Attenuated corticosterone response to chronic ACTH stimulation in hepatic lipase-deficient mice: evidence for a role for hepatic lipase in adrenal physiology. Am. J. Physiol. Endocrinol. Metab. 2006, 290, E908 10.1152/ajpendo.00442.2005. [DOI] [PubMed] [Google Scholar]
- Wen G.; Ringseis R.; Eder K. Endoplasmic reticulum stress inhibits expression of genes involved in thyroid hormone synthesis and their key transcriptional regulators in FRTL-5 thyrocytes. PloS One 2017, 12, e0187561 10.1371/journal.pone.0187561. [DOI] [PMC free article] [PubMed] [Google Scholar]
- Yen P. M. Physiological and molecular basis of thyroid hormone action. Physiol. Rev. 2001, 81, 1097. 10.1152/physrev.2001.81.3.1097. [DOI] [PubMed] [Google Scholar]
- Bianco A. C.; Kim B. W. Deiodinases: implications of the local control of thyroid hormone action. J. Clin. Invest. 2006, 116, 2571–2579. 10.1172/jci29812. [DOI] [PMC free article] [PubMed] [Google Scholar]
- Stoll M. L. Gut microbes, immunity, and spondyloarthritis. Clin. Immunol. 2015, 159, 134–142. 10.1016/j.clim.2015.05.001. [DOI] [PubMed] [Google Scholar]
- Scott K. P.; Gratz S. W.; Sheridan P. O.; Flint H. J.; Duncan S. H. The influence of diet on the gut microbiota. Pharmacol. Res. 2013, 69, 52. 10.1016/j.phrs.2012.10.020. [DOI] [PubMed] [Google Scholar]
- Hulin S. J.; Singh S.; Chapman M. A. S.; Allan A.; Langman M. J. S.; Eggo M. C. Sulphide-induced energy deficiency in colonic cells is prevented by glucose but not by butyrate. Aliment. Pharmacol. Ther. 2002, 16, 325–331. 10.1046/j.1365-2036.2002.01164.x. [DOI] [PubMed] [Google Scholar]
- Fisher K.; Phillips C. The ecology, epidemiology and virulence of Enterococcus. Microbiology 2009, 155, 1749–1757. 10.1099/mic.0.026385-0. [DOI] [PubMed] [Google Scholar]
- Sokol H.; Pigneur B.; Watterlot L.; Lakhdari O.; Bermúdez-Humarán L. G.; Gratadoux J.-J.; Blugeon S.; Bridonneau C.; Furet J.-P.; Corthier G.; Grangette C.; Vasquez N.; Pochart P.; Trugnan G.; Thomas G.; Blottiere H. M.; Dore J.; Marteau P.; Seksik P.; Langella P. Faecalibacterium prausnitzii Is an Anti-Inflammatory Commensal Bacterium Identified by Gut Microbiota Analysis of Crohn Disease Patient. Proc. Natl. Acad. Sci. U.S.A. 2008, 105, 16731–16736. 10.1073/pnas.0804812105. [DOI] [PMC free article] [PubMed] [Google Scholar]
- Eckburg P. B.; Bik E. M.; Bernstein C. N.; Purdom E.; Dethlefsen L.; Sargent M.; Gill S. R.; Nelson K. E.; Relman D. A. Diversity of the human intestinal microbial flora. Science 2005, 308, 1635. 10.1126/science.1110591. [DOI] [PMC free article] [PubMed] [Google Scholar]
- Fröhlich E.; Wahl R. Microbiota and thyroid interaction in health and disease. Trends Endocrinol. Metab. 2019, 30, 479–490. 10.1016/j.tem.2019.05.008. [DOI] [PubMed] [Google Scholar]
- Segain J.-P.; Raingeard d. l. B. D.; Bourreille A.; Leray V.; Gervois N.; Rosales C.; Ferrier L.; Bonnet C.; Blottière H. M.; Galmiche J. P. Butyrate inhibits inflammatory responses through NFkappaB inhibition: implications for Crohn’s disease. Gut 2000, 47, 397–403. 10.1136/gut.47.3.397. [DOI] [PMC free article] [PubMed] [Google Scholar]
- Smith P. M.; Howitt M. R.; Panikov N.; Michaud M.; Gallini C. A.; Bohlooly-Y M.; Glickman J. N.; Garrett W. S. The Microbial Metabolites, Short-Chain Fatty Acids, Regulate Colonic Treg Cell Homeostasis. Science 2013, 341, 569–573. 10.1126/science.1241165. [DOI] [PMC free article] [PubMed] [Google Scholar]
- Zhao F.; Feng J.; Li J.; Zhao L.; Liu Y.; Chen H.; Jin Y.; Zhu B.; Wei Y. Alterations of the gut microbiota in Hashimoto’s thyroiditis patients. Thyroid 2018, 28, 175. 10.1089/thy.2017.0395. [DOI] [PubMed] [Google Scholar]
- Gill H.; Prasad J. Probiotics, immunomodulation, and health benefits. Bioact. Compon. Milk 2008, 606, 423. [DOI] [PubMed] [Google Scholar]
- Mennigen R.; Bruewer M. Effect of probiotics on intestinal barrier function. Ann. N. Y. Acad. Sci. 2009, 1165, 183–189. 10.1111/j.1749-6632.2009.04059.x. [DOI] [PubMed] [Google Scholar]
- Xiao C.; Qiao Z.; Hai Y.; Xue J. S. Lactulose: An indirect antioxidant ameliorating inflammatory bowel disease by increasing hydrogen production. Med. Hypotheses 2011, 76, 325–327. 10.1016/j.mehy.2010.09.026. [DOI] [PubMed] [Google Scholar]
- Zimmermann M. B.; Andersson M. Assessment of iodine nutrition in populations: past, present, and future. Nutr. Rev. 2012, 70, 553–570. 10.1111/j.1753-4887.2012.00528.x. [DOI] [PubMed] [Google Scholar]
- Zhu D.; Ma Y.; Ding S.; Jiang H.; Fang J. Effects of Melatonin on Intestinal Microbiota and Oxidative Stress in Colitis Mice. BioMed Res. Int. 2018, 2018, 1–6. 10.1155/2018/2607679. [DOI] [PMC free article] [PubMed] [Google Scholar]
- Dong L.; Li Y.; Zhang D.; Zhang H.; Han J.; Wang Z.; Zhou J.; Lu C.; Su X. Dietary Apostichopus japonicus alleviates diabetes symptoms and modulates genes expression in kidney tissues of db/db mice. J. Agric. Food Chem. 2018, 66, 154–162. 10.1021/acs.jafc.7b04743. [DOI] [PubMed] [Google Scholar]
- Zhao S.-J.; Ye Y.; Sun F.-J.; Tian E.-J.; Chen Z.-P. The Impact of Dietary Iodine Intake on Lipid Metabolism in Mice. Biol. Trace Elem. Res. 2011, 142, 581–588. 10.1007/s12011-010-8767-1. [DOI] [PubMed] [Google Scholar]
- Chaplin A.; Parra P.; Serra F.; Palou A. Conjugated Linoleic Acid Supplementation under a High-Fat Diet Modulates Stomach Protein Expression and Intestinal Microbiota in Adult Mice. PloS One 2015, 10, e0125091 10.1371/journal.pone.0125091. [DOI] [PMC free article] [PubMed] [Google Scholar]
- Chang C.-J.; Lin C.-S.; Lu C.-C.; Martel J.; Ko Y.-F.; Ojcius D. M.; Tseng S.-F.; Wu T.-R.; Chen Y.-Y. M.; Young J. D.; Lai H.-C. Ganoderma lucidum reduces obesity in mice by modulating the composition of the gut microbiota. Nat. Commun. 2015, 6, 7489. 10.1038/ncomms8489. [DOI] [PMC free article] [PubMed] [Google Scholar]
Associated Data
This section collects any data citations, data availability statements, or supplementary materials included in this article.