

Abstract
Natural killer (NK)-cell-based immunotherapy is emerging as an attractive approach for cancer treatment. However, to facilitate and expedite clinical implementation, important questions must be answered regarding the in vivo functionality and trafficking patterns of the transferred cells. We have recently developed a noninvasive cell-tracking technique, based on gold nanoparticles (GNPs) as cell-labeling and contrast agents for whole-body computed tomography (CT) imaging. Herein, we report the implementation of this technique for longitudinal and quantitative tracking of NK cell kinetics, the migration and biodistribution in tumor-bearing mice. NK cells were successfully labeled with GNPs, without impairing their biological function, as assessed both in vitro, by cytokine release and cytotoxicity assays, and in vivo, using a xenograft model of human tumors. Using CT, we longitudinally tracked the migration of intravenously injected NK cells and observed an accumulation of effector cell clusters at the tumor site, up to 72 h. Fluorescence imaging of the cells over time correlated with ex vivo quantitative analysis of gold content in the tumor, validating the accuracy and reliability of our technique. Our cell-tracking approach thus offers a valuable tool for preclinical studies, as well as for clinical applications, to elucidate the fate of NK cells and promote the implementation of NK-cell-based immunotherapy.
Introduction
Cellular immunotherapy is a rapidly expanding paradigm with immense potential for effective cancer treatment. Several immune cell types play important roles in antitumor response, including T cells, dendritic cells, and natural killer (NK) cells.1 The latter are especially appealing for cell-based immunotherapy, due to their intrinsic capacity to recognize and target tumor cells often bypassing HLA restriction, their rapid killing ability, and better safety, as compared to T-cell-based therapy.2 A large body of recent preclinical and clinical research makes use of the functional effector NK cell line NK92, the only allogeneic cell line currently used in clinical trials. This cell line, isolated in the early ‘90s,3 was demonstrated to be functional and has several technical advantages over the use of donor-derived peripheral NK cells.4 Importantly, it displays the ability to detect and eliminate tumor cells and secrete antitumor cytokines such as TNF-α and IFN-γ.5 NK92 cells, both unmodified and genetically engineered, have garnered success in allogeneic settings in phase I clinical trials,6,7 presenting a low-toxicity burden and almost no side effects, as observed in melanoma and renal carcinoma patients.8,9 These findings confirm the potential of NK92 cells as a convenient and universal alternative cell platform for immunotherapy.10
Despite the recent progress in NK-cell-based immunotherapy, critical issues remain to be defined, including optimal cell dosage, trafficking and migration patterns, survival, and final fate of NK cells post-transplantation. This lack of information is a major obstacle that hinders the more rapid progress of NK-cell-based therapy and prevents it from reaching its full potential. Addressing these challenges requires a reliable, noninvasive, and real-time cell-tracking technique that can continuously evaluate the kinetics, biodistribution, and functionality of NK cells post-injection.11
To date, NK cell tracking has been achieved mainly by optical imaging techniques, that is, fluorescence or bioluminescence methods,12,13 which are limited by low tissue penetration, or via nuclear-based tracking systems, which use short-lived radionuclide imaging agents.14 While nanoparticle-based magnetic resonance imaging may offer advantages over NK cell tracking due to its high sensitivity, the contrast generated by nanoparticles can interfere with imaging of the surrounding tissues.
Recently, we developed a novel methodology for longitudinal and quantitative in vivo cell tracking, based on the combination of computed tomography (CT) as an imaging modality and gold nanoparticles (GNPs) as cell-labeling agents.15−23 CT is one of the most widely used imaging techniques in the clinic, due to its cost-effectiveness, high spatial resolution, short scan time, and ease of imaging processes.24 Moreover, GNPs have unique physical, chemical, and biological properties, making them attractive contrast agents for CT imaging. In recent years, GNPs have attracted broad interest as in vivo tracking agents, due to their inert and nontoxic nature.25−28
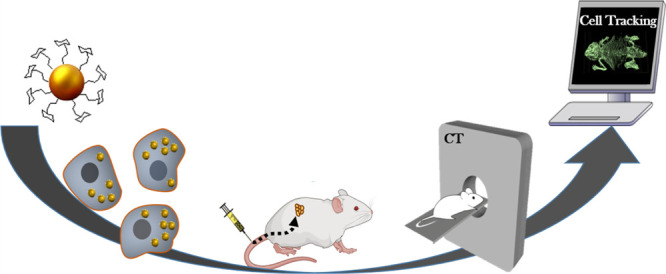
Herein, we developed a sensitive NK-cell-tracking approach based on GNP labeling for precise CT imaging (Figure 1A). First, we established a protocol for efficient NK92 cell-labeling with GNPs, while maintaining NK92 cell functions and viability. Labeled cells were longitudinally tracked in tumor-bearing mice using CT, up to 72 h post-intravenous (IV) injection. The cells mediated tumor growth inhibition independent of GNP labeling, demonstrating the safety of our approach. Overall, this work demonstrates a novel ability to longitudinally visualize clusters of NK cells as they accumulate at the tumor site.
Figure 1.

(A) Scheme of the NK-cell-tracking procedure. NK cells are labeled with GNPs in vitro. Then, the cells are injected intravenously into mice and tracked in vivo using CT imaging. (B) TEM image of 20 nm GNPs. (C) Optical properties of the GNPs, as assessed by ultraviolet–visible (UV–vis) spectroscopy.
Results and Discussion
In Vitro Characterization and Functionality of GNP-Labeled NK92 Cells
GNPs were synthesized and coated with polyethylene glycol (PEG) and d-(β)-glucosamine, as we have recently shown that glucose coating increases the cellular uptake of GNPs.18,19 The particles were characterized using transmission electron microscopy (TEM) and UV–vis spectroscopy (Figure 1B,C) and displayed an average size of 20 nm with an absorption peak at 525 nm.
Next, NK cells were incubated with 0.75 mg/mL GNPs for 1 h, as we have previously shown that these conditions allow efficient labeling and optimal biological activity in other immune cell types.17 The NK cell-uptake efficiency was quantitatively analyzed using flame atomic absorption spectroscopy (FAAS), showing an average uptake of 130 pg Au/cell, which corresponds to 1.6 × 10⁶ particles per single cell. To verify that GNP-labeled NK cells preserve the therapeutic potential, the antitumor activity against specific target cells was examined and cell cycle analysis was performed. GNP-labeled NK92 cells were co-cultured with either the K562 human erythroleukemia cell line (efficiently recognized as a positive target) or the 888 human melanoma cell line (as a negative control) for 18 h. We found that the GNP-loaded NK92 cells secreted IFN-γ and TNF-α at levels similar to those of the nonlabeled NK-92 cells (825 pg/mL IFN-γ and 415 pg/mL TNF-α secretion in GNP-loaded NK92 cells vs 1035 pg/mL IFN-γ and 519 pg/mL TNF-α in controls, p ≥ 0.706) (Figure 2A,B). No significant changes in cytokine secretion levels were noted in co-cultures with the control 888 cell line (p ≥ 0.56, Figure 2A,B).
Figure 2.

Function of the GNP-loaded NK92 cells. (A,B) Human NK92 cells either loaded with 0.75 mg/mL gold (NK92(+GNP)) or unloaded (NK92(−)) were co-cultured with the positive-target K562 cell line or negative 888 cells as controls. Secreted levels of IFN-γ (A) and TNF-α (B) in the co-culture supernatant were measured by ELISA. Data presented as mean ± SEM (n = 3). (C) Tumor-cell-killing ability of human NK92 cells either loaded with 0.75 mg/ml gold (NK92(+GNP)) or unloaded (NK92(−)). GNP-loaded NK92 cytotoxicity levels were measured in a co-culture with carboxyfluorescein succinimidyl ester (CFSE)-labeled K562 cancer cells. PI/CFSE double-positive population was assessed. The average percentage of PI expression levels (% cytotoxicity) is shown. (D) Cell cycle analysis of GNP-loaded NK92 cells. Cells were PI-stained and analyzed using flow cytometry. Data are presented as mean ± SEM (n = 3).
Likewise, GNP-labeled NK92 cells showed tumor-cell-killing abilities similar to those of nonlabeled NK92 cells (p = 0.997, Figure 2C). Additionally, cell cycle analysis showed no significant difference in the viability of NK92-GNP loaded cells, as compared to nonlabeled cells (Figure 2D).
These findings demonstrate that GNP-labeled NK92 cells can specifically identify target cells and maintain their cytokine secretion and antitumor functions.
CT Imaging of NK92 Gold-Labeled Cells in Tumor-Bearing Mice
We next examined the efficacy of GNP labeling of NK92 cells for longitudinal in vivo tracking and imaging with CT. Mice were subcutaneously injected with either K562 positive target cells or 888 negative target control cells, and after tumor establishment, they received an intravenous injection of either GNP-labeled NK92 cells, nonlabeled NK92 cells, or saline (four mice per group). CT imaging was conducted at 24 h, 48 h, and 72 h post-injection (see the Supporting Information, Figs. S1–S5). Two-dimensional (2D) and three-dimensional (3D) CT imaging revealed that the GNP-labeled NK92 cells accumulated in K562 tumors and formed clusters at the tumor site over time (Figure 3; representative images at 48 and 72 h post-injection are shown). As expected, no signal was detected at the tumor site for the nonlabeled NK92 cells, confirming that the cells could not be visualized without GNP labeling. Furthermore, no signal was detected at the control 888 tumor site, showing that the GNP-labeled NK cells did not accumulate in the control tumors.
Figure 3.
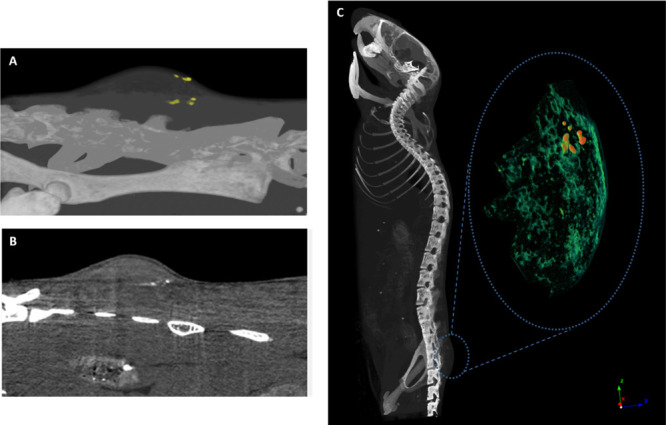
CT images of NK92 cell clusters in K562 tumor 48 h and 72 h post-injection. (A) 3D CT image of the GNP-labeled cells (yellow) in the entire tumor (top) at 48 h post-injection; (B) 2D image of the labeled cells (white) in a single slice of the tumor (top) at 48 h post-injection. (C) 3D volume-rendering image of NK-cell accumulation in K562 tumor 72 h post-injection. GNP-labeled cells (red) are seen within the surrounding tumor tissue (green). These data are representative of four experiments.
Validation of Cell Tracking by Fluorescence Imaging
To further characterize and validate our in vivo tracking system, NK92 cells labeled with a red fluorescent dye (CellTracker Deep Red) were intravenously injected into K562 or 888 tumor-bearing mice, visualized with whole-body fluorescence imaging, and compared to the GNP-based technique, as measured by inductively coupled plasma mass spectrometry (ICP), at 24, 48, and 72 h post-injection. Fluorescence imaging showed an accumulation of NK cells at the K562 tumor site over a period of 3 days (Figure 4A), which matched with the CT imaging findings. Additionally, we found that the fluorescent signal intensity quantified at the tumor correlated with gold accumulation measured in the tumor over time, showing the same trend of increase with a maximum signal reached at 72 h post-injection (Figure 4B,C). It should be noted that the reduced sensitivity of fluorescence imaging did not allow detection of cells at 24 h, while ICP-based GNP quantification as well as the CT imaging (see Supporting Information Fig. S2) was able to detect accumulation as early as 24 h post-injection.
Figure 4.

(A) Fluorescence imaging of NK92 cell accumulation at target tumor vs nontarget tumor over time: fluorescence imaging of NK cells in tumor-bearing mice (K562 or 888 cell lines) was conducted over time using the Maestro II in vivo imaging system. The tumor area is demarcated by a circle; NK cells can be seen in red within the K562 tumor. (B,C) Comparison of quantitative ICP and fluorescent signals at the tumor site over time: maximum fluorescence intensity (MFI) quantified at the tumor site over time. Average intensity over the tumor surface area was calculated using ImageJ software (B). Gold quantified in tumor from 24 to 72 h. Average mg Au/gr tissue measured by ICP (C). Both GNP and fluorescence measurements show the same trend of quantitative increase up to 72 h post-injection. The low sensitivity of FLI did not enable cell detection at 24 h.
In Vivo Tumor Regression Mediated by Gold-Labeled NK92 Cells
We next validated if GNP-labeled NK92 cells retained their antitumor therapeutic effect in vivo. The tumor growth rate was evaluated in K562 tumor-bearing mice after intravenous administration of either GNP-labeled or non-labeled NK92 cells or saline. Both GNP-labeled and nonlabeled NK cells significantly inhibited tumor growth, as compared to saline-treated controls (Figure 5A, p < 0.01 using Student’s t-test).
Figure 5.

Therapeutic efficacy and tumor infiltration of GNP-labeled NK92 cells. K562 tumor-bearing mice received an IV injection of either GNP-labeled [NK92(+GNP)] or nonlabeled NK92 [NK92(−)] cells. (A) Labeled and nonlabeled NK92 cells show similar inhibition of tumor growth; the difference between the two NK92-treated groups and saline-treated controls is statistically significant (p = 0.0034). (B) Tumor infiltration levels of GNP-labeled NK92 cells are similar to those in the nonlabeled NK92-treated group, on day 11 (p = 0.396). Results are presented as a percentage of total single-cell suspension and mean ± SEM.
At the end of the experiment (day 11), tumors were excised and analyzed by flow cytometry for CD56 expression (an NK cell marker), to assess the level of tumor-infiltrating NK92 cells. A similar percentage of GNP-labeled or nonlabeled NK92 cells was found within tumors (Figure 5B; 25.3 and 20% NK cells, respectively; p = 0.396).
These findings demonstrate that GNP-labeled and nonlabeled NK92 cell traffic and infiltration of the tumor were at similar levels and mediated a similar antitumor effect. Taken together, these results confirm that GNPs do not impair the therapeutic effect of NK92 cells in vivo.
Biodistribution of GNP-Labeled NK92 Cells
To determine the biodistribution of NK92 cells following IV injection, mice treated with GNP-loaded NK cells were sacrificed at 24, 48, and 72 h after injection, and their organs were excised and analyzed for gold content using FAAS. Significant gold uptake was found in clearance organs, namely, the spleen and the liver, as well as in the lungs. Lung accumulation gradually decreased over time (Figure 6). No gold was detected in the blood and kidney 24 h post-injection.
Figure 6.
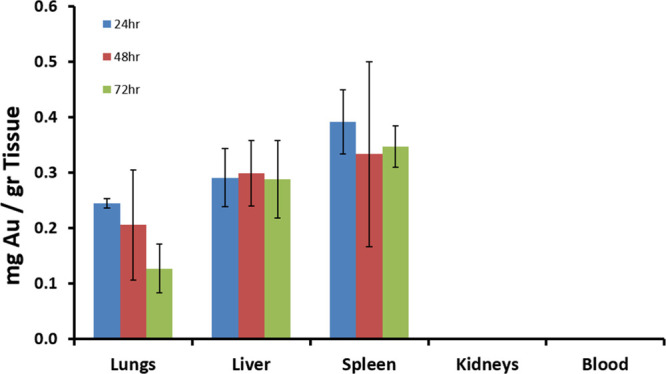
Biodistribution of GNP-labeled NK92 cells in mice. Gold concentrations in major organs 24, 48, and 72 h post-IV injection of GNP-labeled NK92 cells, as quantitatively measured by FAAS. No significant amount of gold was detected in the kidney and blood.
Discussion
Developing sensitive techniques for non-invasive in vivo cell tracking is essential for elucidating mechanisms underlying adoptive transfer treatments. In this study, we utilized GNPs as CT-imaging contrast agents for tracking NK cells in vivo. Our approach provided important information on NK92 cell trafficking kinetics, biodistribution, and fate.
Reliable nanoparticle-based cell tracking requires several key parameters. The first is efficient cell labeling for successful imaging. Here, we achieved loading of a sufficient number of particles into each cell and thereby attained satisfactory contrast. Importantly, the cells maintained their biological function and viability and showed a maximal therapeutic effect, as demonstrated both in vitro and in vivo. The second parameter is the accurate analysis and interpretation of the obtained images; identifying small clusters of cells and differentiating them from the surrounding soft tissue is a challenging task. Our GNP-based approach overcame this challenge by achieving a distinct CT signal that enabled discerning the accumulation of cells at the tumor site over 72 h. Finally, as longitudinal cell tracking involves imaging days after treatment, it is important to validate whether the tracked nanoparticles indeed remained within the cells over time. Herein, the longitudinal NK92 cell tumor accumulation observed by CT up to 72 h was found to be comparable with that observed by fluorescence imaging. In addition, ex vivo analysis of gold quantity at the tumor site closely correlated with the fluorescence intensity recorded 72 h post-transplantation, further establishing that the NK92 cells were indeed those being imaged in the tumor over time.
Given the wide applicability of our GNP-based cell-tracking concept, the ability to track NK cells can be further applied to state-of-the-art chimeric antigen receptor (CAR)-modified NK cell products. As opposed to identifying the target cells independent of the T cell receptor and the major histocompatibility complex, CAR-modified cells enable identification of antigens expressed upon the target cell surface, including proteins, carbohydrates, and glycolipids.29 Although CAR-modified T cell therapy has led to a dramatic clinical response in hematological malignancies,30 it entails many logistic limitations as a personalized treatment and cannot be used as an allogeneic product, due to the high risk of graft-versus-host disease.31,32 The use of allogeneic NK cells can circumvent these limitations and therefore NK cells (whether primary or NK92) may be used as an “off-the-shelf” cellular source for immunotherapy. The next-generation engineered NK cells show great promise in preclinical research,33 and several CAR-NK based clinical trials34−36 are underway.37−40 Recent studies have also attempted to determine the NK cell dosage to be used to treat cancer patients with different tumor types and disease severity.41 Thus, we trust that the present tracking approach could facilitate the identification of optimal and personalized treatment conditions.
In summary, we present a novel method for longitudinal and quantitative in vivo NK cell tracking, based on the superior visualization ability of CT, combined with the state-of-the-art nanotechnology. NK cell in vivo visualization can solve previously unanswered questions regarding the fate of cells and allow for the real-time evaluation of their functions in clinical applications. We trust that a precise and reliable ability to track native and genetically engineered NK cells will greatly facilitate the safe implementation of this kind of promising immunotherapy.
Materials and Methods
GNP Synthesis, Conjugation, and Characterization
GNPs were prepared using sodium citrate according to the known methodology described by Enustun and Turkevich.42 First, 0.414 mL of 1.4 M HAuCl4 solution in 200 mL of water was added to a 250 mL single-neck round-bottom flask and stirred in an oil bath on a hot plate until boiling. Then, 4.04 mL of 10% sodium citrate solution (0.39 M sodium citrate tribasic dihydrate 98%, Sigma CAS 6132-04-3) was quickly added. The solution was stirred for 5 min and then the flask was removed from the hot oil and placed aside until it cooled. To prevent aggregation and stabilize the particles in physiological solutions, O-(2-carboxyethyl)-O-(2-mercaptoethyl) heptaethylene glycol (PEG7) (95%, Sigma-Aldrich, Israel Ltd.) was adsorbed onto the GNPs. This layer also provided the chemical groups required for further conjugation (−COOH). First, the solution was centrifuged to dispose of excess citrate. PEG7 solution was then added to the GNP solution, stirred overnight, and put in a centrifuge in order to dispose of excess PEG. To increase the cell-uptake rate, stabilized GNPs were further coated with glucose. Excess N-ethyl-N-(3-(dimethylamino)-propyl) carbodiimide (EDC) and N-hydroxysuccinimide (NHS) (Thermo Fisher Scientific, Inc., Rockford, IL) were added to the solution, followed by the addition of glucose-2 (2GF) (d-(+)-glucosamine hydrochloride, Sigma-Aldrich Israel Ltd). NHS and EDC form an active ester intermediate with the −COOH functional groups, which can then undergo an amidation reaction with the glucose -NH2 group. Glucosamine molecule C-2 (2GF-GNP): d-(+)-glucosamine hydrochloride (3 mg; Sigma-Aldrich) was added to the activated linker-coated GNPs. TEM (JEM-1400, JEOL) was used to measure the size and shape of the GNPs, which were further characterized using UV–vis spectroscopy (UV-1650 PC; Shimadzu Corporation, Kyoto, Japan) following each level of coating.
Cell Lines
NK92 cells were a kind gift from Prof. Angel Porgador from the Faculty of Health Sciences at Ben-Gurion University. The melanoma cell line 888 was cultured in DMEM and the K562 cell line was cultured in RPMI (Biological Industries, Beth Haemek, Israel), supplemented with 10% heat-inactivated fetal bovine serum (FBS; Biological Industries, Beth Haemek, Israel), and maintained in a 5% CO2 incubator at 37 °C. NK92 cells were cultured in α-MEM medium (Biological Industries, Beth Haemek, Israel) supplemented with 15% FBS, 15% horse serum, 10% myo-inositol (Biological Industries, Beth Haemek, Israel), 10% MEM sodium pyruvate (Biological Industries, Beth Haemek, Israel), and 200 IU/mL IL-2 and maintained at 37 °C in a 5% CO2 incubator.
Cytokine Release Assay
NK92 cell cultures were tested for reactivity by the cytokine release assay performed using a commercially available ELISA kit for detecting IFN-γ (R&D Systems, Minneapolis, MN). For this assay, 1 × 10⁵ responder cells (NK92) and 1 × 10⁵ stimulator cells (tumor cells) were incubated in a 0.2 mL culture volume in individual wells of 96-well plates. Stimulator cells and responder cells were co-cultured for 18 h. Cytokine secretion was measured in culture supernatants diluted to be in the linear range of the assay.
Cell-Mediated Cytotoxicity Assay
Target cells were labeled with 2 mM CFSE (eBioscience, San Diego, CA) for 6 min and then co-cultured with labeled lymphocytes at 37 °C for 4 h, at an E/T ratio of 3:1. After co-culture, 1 mM propidium iodide (PI; Sigma-Aldrich Israel Ltd.) was added for assigning the ratio of cell death. Samples were analyzed by flow cytometry.
Cell Cycle Analysis
NK92 cells were loaded with GNP by incubation in saline for 1 h with gold at a concentration of 0.76 mg gold/mL. The cells were then washed from gold residues and transferred to medium for another 48 h. Next, the cells were harvested and washed twice in cold PBS and fixed for 24 h at 4 °C, using 4 mL of cold 70% ethanol. For PI staining and flow cytometry analysis, the fixed cells were washed and centrifuged at 500g for 5 min. Cell pellets were then resuspended in 400 mL of PBS supplemented with 8 mL of RNAse (1 mg/mL) and 4 mL of PI (2 mg/mL). Samples were incubated for 10 min in the dark, before being analyzed by flow cytometry.
Flow Cytometry Analysis and Antibodies
Immunofluorescence of anti-human CD56 (BioLegend, San Diego, CA) and fluorophore-labeled antibodies, analyzed as the relative log fluorescence of live cells, was measured using a CyAn-ADP flow cytometer (Beckman Coulter, Brea). Approximately, 1 × 10⁵ cells were analyzed. Cells were stained in the FACS buffer made of PBS, 0.5% BSA, and 0.02% sodium azide.
Animal Model and Injections
6 week old NOD SCID gamma (NSG) male mice (Harlan, Jerusalem, Israel) were subcutaneously injected with 2 × 10⁶ 888 or K562 cells (12 mice in each group). After tumor establishment (7–10 days), mice were divided into three groups, and 10 × 106 GNP-loaded NK92 lymphocytes were intravenously injected into the mice. Tumor growth measurements were conducted in a blinded fashion using a caliper and calculated using the following formula: [D × d2] × π/6, where D is the largest tumor diameter and d its perpendicular one. All procedures were performed according to the guidelines of the University Committee for Animal Welfare.
Live Fluorescence Imaging
Fluorescence was examined by the Maestro II in vivo imaging system, a 2D planar fluorescence imaging of small animals (Cambridge Research & Instrumentation, Inc., Woburn, MA). A deep red excitation/emission filter set was used for our experiments (λex: 641–681 nm, λem >700 nm). The liquid crystal tunable filter (LCTF) was programed to acquire image cubes with an increment of 10 nm per image. Fluorescence intensity measurements were calculated as the average intensity over the tumor surface area, using ImageJ software.
Flame Gold Analysis
For analyzing the amount of GNPs within the cells, the cells were incubated with GNPs (30 mg/mL) for 2 h. The cells were melted with aqua regia, a mixture of nitric acid and hydrochloric acid in a volume ratio of 1:3. The uptake was analyzed using flame atomic absorption spectroscopy (FAAS, SpectrAA140), Agilent Technologies.
For the biodistribution assay, tumor-bearing mice treated with GNP-loaded NK cells were sacrificed at 24, 48, and 72 h after injection, and their organs were excised and analyzed for the gold content using FAAS. The organs (tumor, lungs, liver, spleen, kidneys, and blood) were melted with 1 mL of aqua regia and then evaporated and diluted to a total volume of 10 mL. A Au lamp was used in order to determine the gold concentration in the samples. The gold concentration in each sample was determined according to its absorbance value with correlation to a calibration curve. Each sample was analyzed in triplicate and averages and standard deviations were taken.
In Vivo Micro-CT Scans
In vivo scans were performed using a micro-CT scanner (SkyScan high-resolution model 1176) with a nominal resolution of 35 μm, a 0.2 mm aluminum filter, and a tube voltage of 45 kV. Reconstruction was done with a modified Feldkamp39 algorithm using SkyScan NRecon software accelerated by GPU.43 Ring artifact reduction, Gaussian smoothing (3%), and beam-hardening correction (20%) were applied. 2D images and quantitative measurements were obtained using CT-Analyze (“CT-An”) software. Volume-rendered 3D images were generated using an RGBA transfer function in both SkyScan CT-Volume (“CTVol”) and CT-Voxel (“CTVox”) software.
Statistical Analysis
Comparison of the tumor growth rate and of data between two groups were performed using paired two-tailed Student’s t-test. The p-values below 0.05 were considered significant.
Acknowledgments
We thank the Ministry of Science and Technology for R.M.’s and K.S.’s doctoral scholarship. We thank the Adelis Foundation for their support (C.J.C.). This work was supported by the Israel Science Foundation (616/20).
Supporting Information Available
The Supporting Information is available free of charge at https://pubs.acs.org/doi/10.1021/acsomega.1c02143.
CT images of GNP-labeled cell accumulation in the tumor over time (PDF)
Author Contributions
§ K.S. and R.M. have contributed equally.
The authors declare no competing financial interest.
Supplementary Material
References
- Gangadaran P.; Ahn B.-C. Molecular Imaging: A Useful Tool for the Development of Natural Killer Cell-Based Immunotherapies. Front. Immunol. 2017, 8, 1090. 10.3389/fimmu.2017.01090. [DOI] [PMC free article] [PubMed] [Google Scholar]
- Mehta R. S.; Randolph B.; Daher M.; Rezvani K. NK cell therapy for hematologic malignancies. Int. J. Hematol. 2018, 107, 262–270. 10.1007/s12185-018-2407-5. [DOI] [PubMed] [Google Scholar]
- Reiniš M. Immunotherapy of MHC class I-deficient tumors. Future Oncol. 2010, 6, 1577–1589. 10.2217/fon.10.128. [DOI] [PubMed] [Google Scholar]
- Klingemann H.; Boissel L.; Toneguzzo F. Natural Killer Cells for Immunotherapy - Advantages of the NK-92 Cell Line over Blood NK Cells. Front. Immunol. 2016, 7, 91. 10.3389/fimmu.2016.00091. [DOI] [PMC free article] [PubMed] [Google Scholar]
- Tarazona R.; Duran E.; Solana R. Natural Killer Cell Recognition of Melanoma: New Clues for a More Effective Immunotherapy. Front. Immunol. 2015, 6, 649. 10.3389/fimmu.2015.00649. [DOI] [PMC free article] [PubMed] [Google Scholar]
- Arai S.; et al. Infusion of the allogeneic cell line NK-92 in patients with advanced renal cell cancer or melanoma: a phase I trial. Cytotherapy 2008, 10, 625–632. 10.1080/14653240802301872. [DOI] [PubMed] [Google Scholar]
- Tonn T.; et al. Treatment of patients with advanced cancer with the natural killer cell line NK-92. Cytotherapy 2013, 15, 1563–1570. 10.1016/j.jcyt.2013.06.017. [DOI] [PubMed] [Google Scholar]
- Suck G.; et al. NK-92: an ‘off-the-shelf therapeutic’ for adoptive natural killer cell-based cancer immunotherapy. Cancer Immunol. Immunother. 2016, 65, 485–492. 10.1007/s00262-015-1761-x. [DOI] [PMC free article] [PubMed] [Google Scholar]
- Tonn T.; Becker S.; Esser R.; Schwabe D.; Seifried E. Cellular immunotherapy of malignancies using the clonal natural killer cell line NK-92. J. Hematother. Stem Cell Res. 2001, 10, 535–544. 10.1089/15258160152509145. [DOI] [PubMed] [Google Scholar]
- LeslieSep M. 2018 & Pm, 1:05, Engineered natural killer cells may be the next great cancer immunotherapy. Science|AAAS. 2018, https://www.sciencemag.org/news/2018/09/engineered-natural-killer-cells-may-be-next-great-cancer-immunotherapy.
- Ahrens E. T.; Bulte J. W. M. Tracking immune cells in vivo using magnetic resonance imaging. Nat. Rev. Immunol. 2013, 13, 755–763. 10.1038/nri3531. [DOI] [PMC free article] [PubMed] [Google Scholar]
- Boissel L.; et al. Retargeting NK-92 cells by means of CD19- and CD20-specific chimeric antigen receptors compares favorably with antibody-dependent cellular cytotoxicity. Oncoimmunology 2013, 2, e26527 10.4161/onci.26527. [DOI] [PMC free article] [PubMed] [Google Scholar]
- Olson J. A.; Zeiser R.; Beilhack A.; Goldman J. J.; Negrin R. S. Tissue-specific homing and expansion of donor NK cells in allogeneic bone marrow transplantation. J. Immunol. 2009, 183, 3219–3228. 10.4049/jimmunol.0804268. [DOI] [PMC free article] [PubMed] [Google Scholar]
- Lauri C.; Di Traglia S.; Galli F.; Pizzichini P.; Signore A. Current status of PET imaging of differentiated thyroid cancer with second generation radiopharmaceuticals. Q. J. Nucl. Med. Mol. Imag. 2015, 59, 105–115. [PubMed] [Google Scholar]
- Meir R.; Popovtzer R. Cell tracking using gold nanoparticles and computed tomography imaging. Wiley Interdiscip. Rev.: Nanomed. Nanobiotechnol. 2018, 10, e1480 10.1002/wnan.1480. [DOI] [PubMed] [Google Scholar]
- Meir R.; Motiei M.; Popovtzer R. Gold nanoparticles for in vivo cell tracking. Nanomed 2014, 9, 2059–2069. 10.2217/nnm.14.129. [DOI] [PubMed] [Google Scholar]
- Meir R.; et al. Nanomedicine for Cancer Immunotherapy: Tracking Cancer-Specific T-Cells in Vivo with Gold Nanoparticles and CT Imaging. ACS Nano 2015, 9, 6363–6372. 10.1021/acsnano.5b01939. [DOI] [PubMed] [Google Scholar]
- Meir R.; et al. Design principles for noninvasive, longitudinal and quantitative cell tracking with nanoparticle-based CT imaging. Nanomed. Nanotechnol. Biol. Med. 2017, 13, 421–429. 10.1016/j.nano.2016.09.013. [DOI] [PubMed] [Google Scholar]
- Betzer O.; et al. In-vitro Optimization of Nanoparticle-Cell Labeling Protocols for In-vivo Cell Tracking Applications. Sci. Rep. 2015, 5, 15400. 10.1038/srep15400. [DOI] [PMC free article] [PubMed] [Google Scholar]
- Bier A.; et al. Placenta-derived mesenchymal stromal cells and their exosomes exert therapeutic effects in Duchenne muscular dystrophy. Biomaterials 2018, 174, 67–78. 10.1016/j.biomaterials.2018.04.055. [DOI] [PubMed] [Google Scholar]
- Betzer O.; et al. Nanoparticle-based CT imaging technique for longitudinal and quantitative stem cell tracking within the brain: application in neuropsychiatric disorders. ACS Nano 2014, 8, 9274–9285. 10.1021/nn503131h. [DOI] [PubMed] [Google Scholar]
- Popovtzer R.; et al. Targeted gold nanoparticles enable molecular CT imaging of cancer. Nano Lett. 2008, 8, 4593–4596. 10.1021/nl8029114. [DOI] [PMC free article] [PubMed] [Google Scholar]
- Meir R.; et al. Fast Image-Guided Stratification Using Anti-Programmed Death Ligand 1 Gold Nanoparticles for Cancer Immunotherapy. ACS Nano 2017, 11, 11127–11134. 10.1021/acsnano.7b05299. [DOI] [PubMed] [Google Scholar]
- Kim J.; et al. Use of Nanoparticle Contrast Agents for Cell Tracking with Computed Tomography. Bioconjug. Chem. 2017, 28, 1581–1597. 10.1021/acs.bioconjchem.7b00194. [DOI] [PMC free article] [PubMed] [Google Scholar]
- Davidi E. S.; et al. Cisplatin-conjugated gold nanoparticles as a theranostic agent for head and neck cancer. Head Neck 2018, 40, 70–78. 10.1002/hed.24935. [DOI] [PubMed] [Google Scholar]
- Perets N.; et al. Golden Exosomes Selectively Target Brain Pathologies in Neurodegenerative and Neurodevelopmental Disorders. Nano Lett. 2019, 19, 3422–3431. 10.1021/acs.nanolett.8b04148. [DOI] [PubMed] [Google Scholar]
- Popovtzer R.; Natan A.; Shacham-Diamand Y. Mathematical model of whole cell based bio-chip: An electrochemical biosensor for water toxicity detection. J. Electroanal. Chem. 2007, 602, 17–23. 10.1016/j.jelechem.2006.11.022. [DOI] [Google Scholar]
- Jakobsohn K.; Motiei M.; Sinvani M.; Popovtzer R. Towards real-time detection of tumor margins using photothermal imaging of immune-targeted gold nanoparticles. Int. J. Nanomed. 2012, 7, 4707. 10.2147/IJN.S34157. [DOI] [PMC free article] [PubMed] [Google Scholar]
- Eisenberg V.; Hoogi S.; Shamul A.; Barliya T.; Cohen C. J. T-cells ‘à la CAR-T(e)’ - Genetically engineering T-cell response against cancer. Adv. Drug Deliv. Rev. 2019, 141, 23–40. 10.1016/j.addr.2019.01.007. [DOI] [PubMed] [Google Scholar]
- Grupp S. A.; et al. Chimeric antigen receptor-modified T cells for acute lymphoid leukemia. N. Engl. J. Med. 2013, 368, 1509–1518. 10.1056/nejmoa1215134. [DOI] [PMC free article] [PubMed] [Google Scholar]
- Graham C.; Jozwik A.; Pepper A.; Benjamin R. Allogeneic CAR-T Cells: More than Ease of Access?. Cells 2018, 7, 155. 10.3390/cells7100155. [DOI] [PMC free article] [PubMed] [Google Scholar]
- Yang Y.; Jacoby E.; Fry T. J. Challenges and opportunities of allogeneic donor-derived CAR T cells. Curr. Opin. Hematol. 2015, 22, 509–515. 10.1097/moh.0000000000000181. [DOI] [PMC free article] [PubMed] [Google Scholar]
- Daher M.; Rezvani K. Next generation natural killer cells for cancer immunotherapy: the promise of genetic engineering. Curr. Opin. Immunol. 2018, 51, 146–153. 10.1016/j.coi.2018.03.013. [DOI] [PMC free article] [PubMed] [Google Scholar]
- Liu E.; et al. Cord blood NK cells engineered to express IL-15 and a CD19-targeted CAR show long-term persistence and potent antitumor activity. Leukemia 2018, 32, 520–531. 10.1038/leu.2017.226. [DOI] [PMC free article] [PubMed] [Google Scholar]
- Liu E.; et al. Use of CAR-Transduced Natural Killer Cells in CD19-Positive Lymphoid Tumors. N. Engl. J. Med. 2020, 382, 545–553. 10.1056/nejmoa1910607. [DOI] [PMC free article] [PubMed] [Google Scholar]
- Del Zotto G.; et al. Markers and function of human NK cells in normal and pathological conditions. Cytometry B Clin. Cytometry 2017, 92, 100–114. 10.1002/cyto.b.21508. [DOI] [PubMed] [Google Scholar]
- Ankri R.; et al. Intercoupling surface plasmon resonance and diffusion reflection measurements for real-time cancer detection. J. Biophot. 2013, 6, 188–196. 10.1002/jbio.201200016. [DOI] [PubMed] [Google Scholar]
- Barnoy E. A.; Fixler D.; Popovtzer R.; Nayhoz T.; Ray K. An ultra-sensitive dual-mode imaging system using metal-enhanced fluorescence in solid phantoms. Nano Res. 2015, 8, 3912–3921. 10.1007/s12274-015-0891-y. [DOI] [PMC free article] [PubMed] [Google Scholar]
- Zhou Y.; et al. Radiotherapy-Sensitized Tumor Photothermal Ablation Using γ-Polyglutamic Acid Nanogels Loaded with Polypyrrole. Biomacromolecules 2018, 19, 2034–2042. 10.1021/acs.biomac.8b00184. [DOI] [PubMed] [Google Scholar]
- Shwartz A.; et al. Therapeutic Effect of Astroglia-like Mesenchymal Stem Cells Expressing Glutamate Transporter in a Genetic Rat Model of Depression. Theranostics 2017, 7, 2690–2703. 10.7150/thno.18914. [DOI] [PMC free article] [PubMed] [Google Scholar]
- Lee J.; Thall P. F.; Rezvani K. Optimizing natural killer cell doses for heterogeneous cancer patients on the basis of multiple event times. J. Roy. Stat. Soc. C Appl. Stat. 2019, 68, 461–474. 10.1111/rssc.12271. [DOI] [PMC free article] [PubMed] [Google Scholar]
- Enustun B. V.; Turkevich J. Coagulation of Colloidal Gold. J. Am. Chem. Soc. 1963, 85, 3317. 10.1021/ja00904a001. [DOI] [Google Scholar]
- Yan G.; Tian J.; Zhu S.; Dai Y.; Qin C. Fast cone-beam CT image reconstruction using GPU hardware. J. X Ray Sci. Technol. 2008, 16, 225. 10.3204/DESY-PROC-2014-05/35. [DOI] [Google Scholar]
Associated Data
This section collects any data citations, data availability statements, or supplementary materials included in this article.